US stock ended Friday’s session with gains as investors digested data showing inflation is continuing to ease and the Federal Reserve’s rate hikes are serving their purpose. Data on Friday showed the Fed’s closely watched measure of inflation cooling and consumer spending stagnating. Consumers’ year-ahead inflation expectations also dropped this month to the lowest since June 2021. Both sets of data calmed the market sentiment on Friday. While central bank officials have repeatedly said that they’ll keep raising rates this year, markets have often shrugged off these warnings. However, robust economic data has continued to keep investors on edge.
The benchmarks, the S&P 500 edged higher with a 0.59% daily gain on Friday, and all eleven sectors stayed in the positive territory. Especially for the Energy sector, surging with 3.16% daily for the day, performed the best among all groups. However, the S&P 500 and the tech-heavy Nasdaq 100 still suffered their third week of losses, the longest losing streak since late September, as investors this month grappled with a hawkish Fed and data pointing to a resilient economy that can handle more rate-hike pain.
Main Pairs Movement
The US Dollar index edged lower with 0.11% daily losses, as the US inflation figure declined further than expected. The Personal Consumption Expenditure (PCE) Price Index rose a modest 0.1% in November, missing expectations for a reading of 0.3%. Additional details showed that the Core PCE Price Index (the Fed’s preferred inflation gauge) climbed by 0.2% MoM in November and decelerated to a 4.7% YoY rate from 5.0% previous. The DXY index was wandering in a range from 104.1 to 104.5 level all day, except the moment when the data was released climbing above 104.5 level.
The GBPUSD has little changed on Friday, as trading volume dropped lower ahead of the Christmas holidays. The pair was hovering between the 1.2020 to 1.2090 levels on the last day of the week. In the meantime, the EURUSD mildly moved upward with large volatility, and the pair ended the day with 0.20% daily gains.
The Gold regained upside tractions and rose 0.32% for the day, as US consumer data has shown the inflation is cooling. The XAUUSD witnessed some fresh transactions during the early US trading hours and surged by 0.35% in an hour.
Technical Analysis
EURUSD (4-Hour Chart)
EURUSD traded 0.27% higher throughout Friday’s trading as of writing. It continues to trade in positive territory slightly above $1.0600. The data released by the US for hew home sales (Nov.) increased by 5.8%, core PCE inflation rate declined to 4.7% (Nov.) which all looks a favour in Euro. However, it failed to trigger a reaction. Core PCE’s impact should be straight forward with a weaker-than-forecast print weighing on the US dollar and helping the pair push higher. It probably could be affected by the thinning trading conditions into the Christmas holidays, which failed to gather enough momentum to make a decisive move in either direction.
On the technical side, the pair faces strong support at around the $1.0580 area, where the Fibonacci 23.6% retracement of the latest uptrend and the 100-period SMA on the four charts align. The next estimated level could be seen as $1.0500. RSI for the pair sits at 52.13, as of writing. On the four-hour chart, EURUSD currently trades above its 50 and 100-day SMA but below its 200-day SMA.
Resistance: 1.0650, 1.0695
Support: 1.0580, 1.0500, 1.0459, 1.0228
GBPUSD (4-Hour Chart)
The cable pair raised around 0.28% after two consecutive days of a downtrend, struggling to retain the $1.2000 price level. US PCE inflation eased as anticipated in November and core durable goods orders data is better than expected with 0.2% which is higher than the forecast 0.1%.
The pound edged higher on Friday against the backdrop of a modestly weaker dollar. The UK GDP (annual and quarterly) results released on Thursday were weaker than expected, with the UK economy posting negative growth in the third quarter of 2022 and will add to the focus on the fourth quarter data to be released next year – a technical recession that includes two consecutive quarters of negative growth. In addition, strike action in the U.K., which has reduced household incomes amid rising inflation, puts the Bank of England (BoE) in a difficult position but could end rate hikes sooner than the Federal Reserve, making the outlook for the pound against the dollar unfavourable in 2023.
On the daily chart of GBP/USD, the currency pair is trading near its 200-day SMA after yesterday’s daily close below the psychological barrier of 1.2000 and even a brief break below it. RSI for the pair sits at 53.54, as of writing. On the four-hour chart, GBPUSD currently trades above its 50-day SMA but below its 100 and 200-day SMA.
Resistance: 1.2320, 1.2600
Support: 1.20, 1.19, 1.176
XAUUSD (4-Hour Chart)
Gold price remains mildly bid as bears take a breather after a two-day downtrend. As of writing, the price has back to the $1,800 price level and up to the highest $1,802.75 as of today’s trading. Even so, mixed catalysts challenge the metal buyers in consolidation the biggest daily in over a week.
By the end of 2022, a brief annual review and prospect in 2023 of gold price. Gold prices started in 2022 in an indecisive way after fluctuating around $1,800 in the last quarter of 2021. In late February, gold rose sharply and reached its highest level since August 2020 at $2,070 in early March. However, in the second and third quarters, the gold price fell sharply and fell for seven months in a row, approaching $1,600 in September for the first time since April 2020. In November, gold prices recovered decisively, rising more than 8%, and continued higher in the first few weeks of December, returning to the midpoint of the annual range of around $1,800. Gold prices in 2023 will be driven by two important factors: the Fed’s monetary policy and China’s economic performance.
On the technical side, nothing seems to have changed as gold price still yearns for acceptance above trendline resistance at $1,825. RSI for the precious metal sits at around 55.45, as of writing. On the four-hour chart, XAUUSD currently trades below its 50, 100 day SMA but above the 200-day SMA.
US equities dropped on Thursday, as investors digested data validating the Federal Reserve’s assertion that the economy is robust enough to withstand more tightening.
Technology stocks were battered after a gloomy outlook from chipmaker Micron Technologies Inc. weighed on sentiment. Data released on Thursday painted a picture of a resilient economy, stoking concern that the Fed has a long way to go to subdue inflation. Initial jobless claims rose less than forecast in the week ended Dec. 17, underscoring the strength in the labour market. Third-quarter gross domestic product was revised to 3.2% – compared with a previously reported 2.9% advance – on firmer spending.
The benchmarks, the S&P500 dropped by 1.45% daily for the day, and the tech-heavy Nasdaq 100 declined as much as 4% but pared its drop to end Thursday down 2.5%. All eleven sectors in the S&P 500 stayed in the negative territory, and Consumer Discretion performed the worst among all groups, falling with 2.59% daily losses on Thursday. The Dow Jones Industrial Average fell 1%, but the MSCI world index rose 1.2% for the day.
Main Pairs Movement
The US Dollar edged higher by 0.23% daily on Thursday, as US third quarter Gross domestic product showed the resilience of the US economy, which mounting the bets of aggressive tightening policy. The DXY index witnessed some selling in the first half of Thursday, then managed to rebound to a daily high level around 104.6 during the middle of US trading hours.
The GBPUSD tumbled with 0.36% daily losses for the day, as strong-than-expected US economic data weighed on the British pounds pair. The pair had slid since the middle of the UK trading session and dropped as much as 1%, but mildly climbed back to the 1.2030 level. In the meantime, the EURUSD was moving lower with 0.08% daily losses for the day.
The gold fell dramatically by 1.21% daily on Thursday, as strong US GDP data triggered a plunge in the dollar-denominated gold. The XAUUSD has fallen below the $1800 critical level during the American trading session.
Technical Analysis
EURUSD (4-Hour Chart)
EURUSD traded 0.12% lower throughout Thursday’s trading. The recovering Dollar limited any upward momentum that the Euro exhibited during early Asia and European trading sessions on the 22nd. The better-than-expected U.S. GDP figure further eroded any upward mobility for the Euro. U.S. Q3 GDP came in at 3.2%, beating consensus estimates of 2.9%. The surprisingly higher U.S. GDP figure triggered interest rates and recessionary fears across markets. U.S. equities closed lower as short-term interest rate expectations once again climbed. The benchmark U.S. 10-year treasury yield rose above 3.68%, while the 2-year yield rose above 4.2%.
On the technical side, EURUSD has continued to trade below our previously estimated resistance level of 1.065. Short-term support for the pair remains at around the 1.0459 price region. EURUSD has been steadily consolidating around the 1.059 price region. RSI for the pair sits at 61.79, as of writing. On the four-hour chart, EURUSD currently trades below its 50-day SMA but above its 100 and 200-day SMA.
Resistance: 1.0650, 1.0695
Support: 1.0459, 1.0228
GBPUSD (4-Hour Chart)
The cable broke out of the coils and saw the next move towards 1.1900 and 1.1760. Greenback is being pursued as a higher prospect for Fed in 2023. GBPUSD is under pressure from a rally in the dollar, which is getting a boost from stronger-than-expected data, supporting the Fed’s hawkish outlook and higher interest rate expectations for 2023. DXY recovered to 104.5 from a low of 103.75 but remained well below 107.2, which is this month’s high. Ukrainian President Volodymyr Zelensky’s trip to the US and Russian President Putin’s readiness to increase the country’s military potential challenged risk appetite. On the other hand, China’s readiness for more stimulus measures and a second unscheduled bond purchase by the BoJ keep the Us stock still moderate buying the latest in the future.
On the technical side, GBP/USD extended its daily losses, falling below 1.2050. The pair struggled to stage a rally in the early US session after the dollar remained resilient against its rivals following better-than-expected Q3 GDP data, 1.9% compares to the forecast 2.4%. RSI for the pair sits at 34.12, as of writing. On the four-hour chart, GBPUSD currently trades below its 50 and 100-day SMA but above its 200-day SMA.
Resistance: 1.2320, 1.2600
Support: 1.19, 1.176
XAUUSD (4-Hour Chart)
The gold price hovers around at 1,812 to 1,820 area since the opening of the Q3 Final Gross Domestic Product and weekly Jobless Claims data released during the trading course yesterday. After the data was released the Q3 GDP was 3.2% which is 0.3% higher than the forecast 2.9%. This led the US dollar to rise nearly 0.5% to 104.50, as XAUUSD plunged immediately below 1,810 right away. As of writing, the current price fits at 1,787 and reaching a level under 1,800, the next estimated is 1,765. However, on the other hand, the pre-Christmas holiday mood is also set in, with liquidity thinning, which could also offer a helping hand to Gold buyers. Gold price’s technical setup on the daily chart also remains in favour of the optimists.
On the technical side, gold pressures intraday lows in the 1,795 price zone, further losing its bullish potential according to the daily chart but falling short of suggesting a steeper decline. For that, the pair would need to extend its current slump below 1,785, where 20 and 200-day SMAs coverage. In the near term, the risk is skewed to the downside. RSI for the precious metal sits at around 19.66, as of writing. On the four-hour chart, XAUUSD currently trades above its 5 to 200-day SMA.
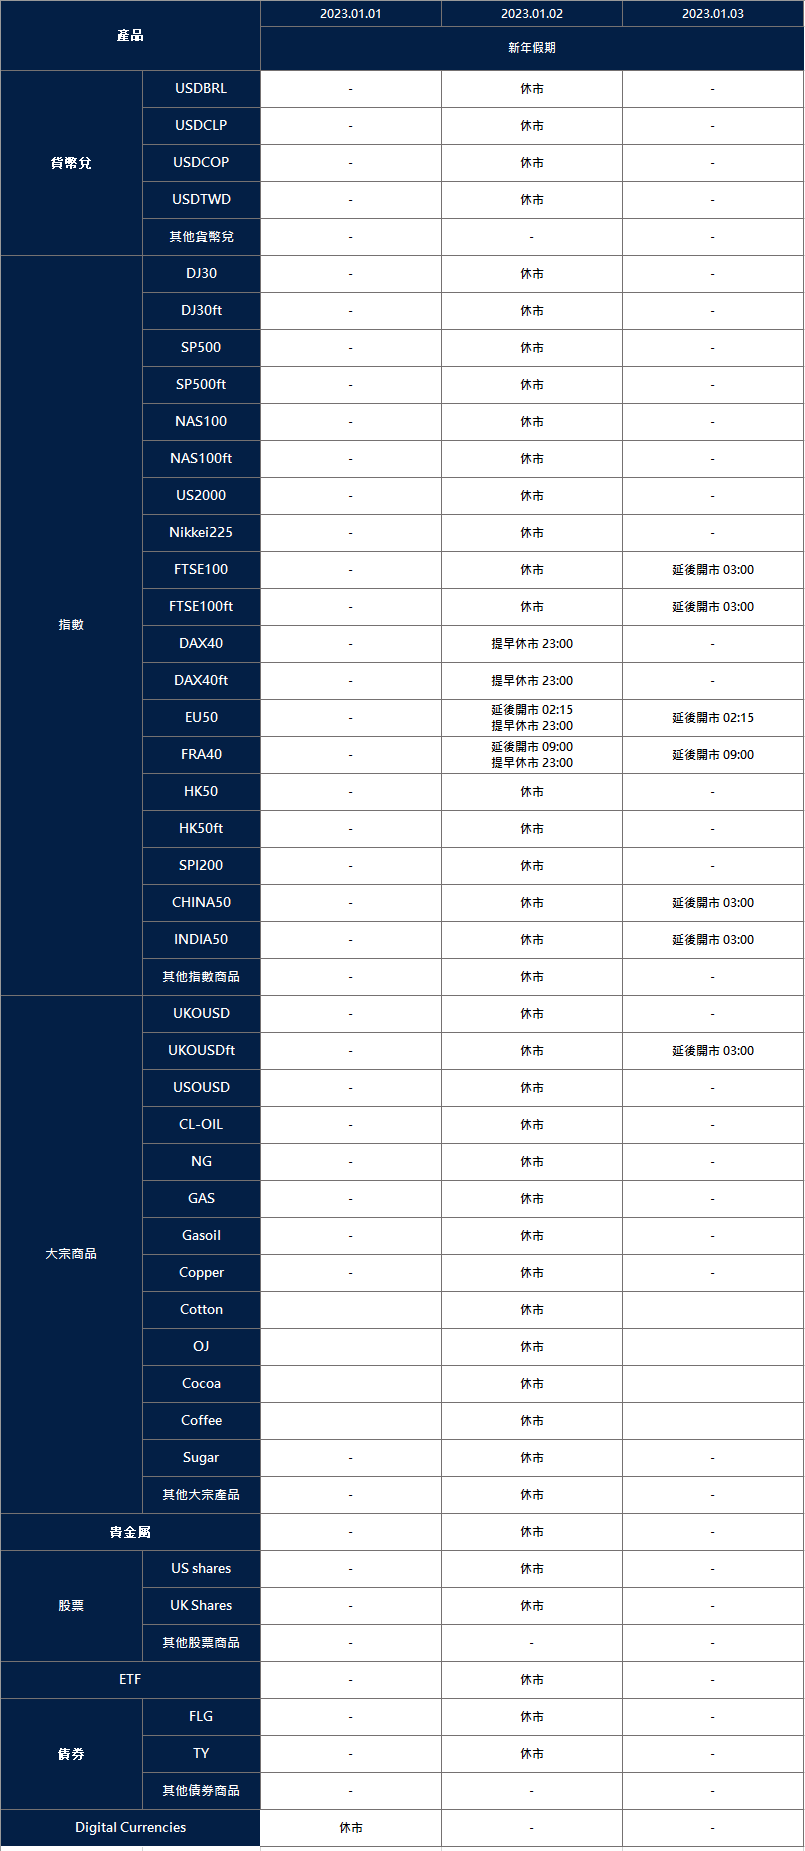
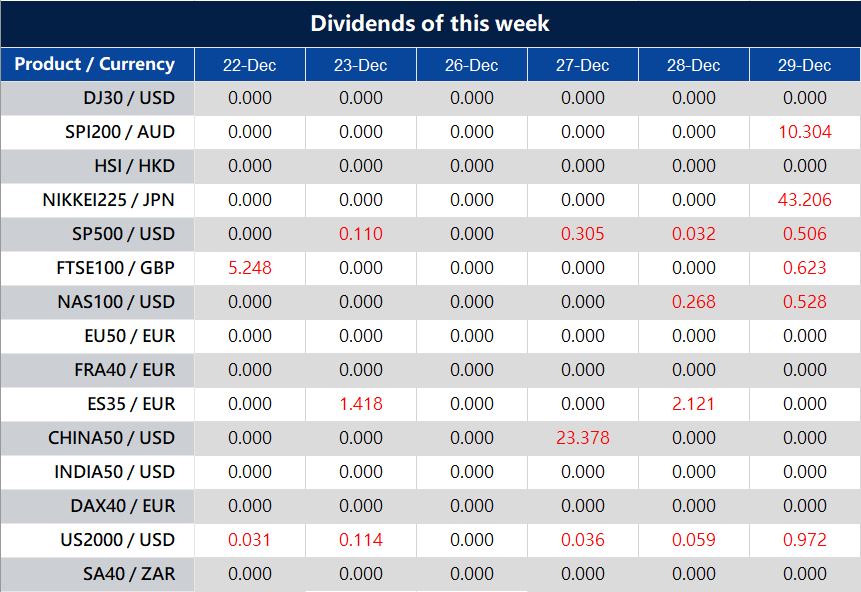
Please note that when constituent stocks of a market index generate dividends, VT Markets will make dividends and deductions for clients who hold the products after the close of the day before the ex-dividend date.
The dividends will not be paid/charged as an inclusion along with Swap. It will be executed separately in your account and the record will be annotated as “Div & Product Name & Net Volume”.
Please note the specific adjustments as follows:
The above data is for reference only, please refer to the MT4/MT5 software for specific data.
If you’d like more information, please don’t hesitate to contact [email protected].
US equities rallied for a second day, as an improvement in consumer confidence and better-than-expected earnings boosted sentiment. Treasuries were mixed after Tuesday’s selloff following the Bank of Japan’s unexpected increase in its yield trading band ebbed. Market participants did not hear from Fed speakers this week, which also helped fuel the so-called ‘Santa rally’ in stocks.
The central bank’s policymakers are expected to become incrementally more dovish in 2023 with a new roster of senior officials. Apart from this, fresh US data on Wednesday also indicated that the Fed’s persistent rate hikes are serving their purpose by slowing the economy, but a recession may still be at bay. It’s also worth noting that Micron Technology, the largest US maker of memory chips, reported earnings after the markets closed on Wednesday.
The benchmark, both the S&P500 and the Dow Jones Industrial Average rose and the Nasdaq 100 snapped a five-day drop on Wednesday. All eleven sectors in S&P 500 stayed in the positive territory, especially the Energy sector performed the best among all groups, rising 1.89% daily for the day. Besides, the MSCI world index edged higher by 0.2% on Wednesday.
Main Pairs Movement
The US Dollar index edged higher by 0.27% daily for the day, as investors reassessed the Bank of Japan’s surprising increase in yield limit. The DXY index mildly moved upward on Wednesday, erasing part of the losses caused by a sudden policy adjustment by the Bank of Japan.
The GBPUSD tumbled by 0.83% daily for the day. In absence of an economic calendar, the pessimistic economic outlook dominated the movement of the pounds pair. The cables dropped hugely during the early US trading session. In the meantime, the EURUSD also edged lower by 0.18% on Wednesday.
The gold slid by 0.20% for the day, as the pair entered into a consolidation phase following a surge on Tuesday. The yellow metal has not made any decisive move on Wednesday, as the investors are awaiting more economic data for more clues.
Technical Analysis
EURUSD (4-Hour Chart)
EURUSD traded lower throughout Wednesday’s trading. The Euro struggled against the Dollar as U.S. treasury yields recovered. The benchmark U.S. 10-year treasury yield recovered above 3.6% after BoJ unexpectedly loosened its yield cap on the 10-year Japanese government bonds to 0.5%. The surprising hawkish tone from the BoJ triggered a global bonds market sell-off that pushed yields higher. Ahead of the holidays, the U.S. will release its quarterly GDP figures and weekly initial jobless claims figures during today’s American trading session, while no major economic data releases are coming out of the E.U.
On the technical side, EURUSD continues to trade below our previously estimated resistance level of 1.065. The pair is consolidating around the 1.06 price region as volatility remains subdued before the holidays. The short-term support level for the pair remains at around the 1.058 price region. RSI for the pair sits at 62.02, as of writing. On the four-hour chart, EURUSD currently trades below its 50-day SMA but above its 100 and 200-day SMA.
Resistance: 1.0650, 1.0695, 1.0785
Support: 1.0580, 1.0538, 1.0480
GBPUSD (4-Hour Chart)
GBPUSD gave up all gains from Tuesday and headed lower throughout Wednesday’s trading. The British Pound fared worse against the Dollar, which was buoyed by rising treasury yields and better-than-expected consumer spending. Positive earnings results from Nike and FedEx temporarily relieved recessionary fears that have loomed across markets since last week. The Dollar index snapped its two-day losing streak and rose more than 0.3% as demand for the Greenback returned. Volatility for Cable has subsided as markets head into the holidays. On the economic docket, Britain and the U.S. are both scheduled to release GDP figures during the European trading session and the American trading session, respectively.
On the technical side, GBPUSD continues to face strong selling pressure at around the 1.26 price region. Cable has exhibited a downward trending path over the last two weeks as the pair closes in on our previously estimated support level of 1.19. Short-term support levels for Cable remain at around 1.19 and 1.176. RSI for the pair sits at 33.54, as of writing. On the four-hour chart, GBPUSD currently trades below its 50 and 100-day SMA but above its 200-day SMA.
Resistance: 1.2320, 1.2600
Support: 1.19, 1.176
XAUUSD (4-Hour Chart)
Gold, the haven asset, has continued to remain above $1800 per ounce after BoJ’s surprise yield move roiled markets. The yellow metal continues to find support at current price levels as market participants weigh recessionary fears and continued geopolitical tensions. As of writing, Ukrainian president Volodymyr Zelensky is on his way to meet with U.S. President Joe Biden. President Zelensky is also scheduled to address the U.S. Congress on his first known foreign trip since the Russian invasion began. The scheduled visit by President Zelensky comes ahead of the U.S. congress’ vote on a key spending bill which will exclude approximately $45 billion to aid Ukraine in military and economic spending for the coming years.
On the technical side, XAUUSD could not breach our previously estimated resistance level of $1824 per ounce. The short-term support level for the yellow metal remains at around the $1777 per ounce price region. RSI for the precious metal sits at around 66.54, as of writing. On the four-hour chart, XAUUSD currently trades above its 50, 100, and 200-day SMA.
The US Dollar index dropped 0.73% daily on Tuesday, tumbling following a sudden announcement from the Bank of Japan(BoJ). Despite the Bank of Japan keeping their policy rate unchanged, the increase in the upper band limit on the yield target caused the surge of Yen and weighed on the DXY index.
US stocks oscillated between gains and losses throughout a volatile session on Tuesday, with technology shares still under pressure after last week’s hawkish central bank turn. Treasuries slumped, with the global bond market digesting the Bank of Japan’s sudden increase in its yield trading band.
FedEx Corp. and Nike Inc. reported earnings after the markets closed. FedEx posted fiscal second-quarter earnings that beat analysts’ estimates, buoyed by price increases and cost cuts that helped make up for a decline in package volume. While Nike Inc. reported another quarter of inventory buildup, its quarterly sales and gross margin exceeded Wall Street’s estimates. Shares of both firms rose postmarket. Treasuries broadly held losses, with the 10-year rate climbing to around 3.69%. Yields rose after a hawkish move from the Bank of Japan sent the yen soaring more than 4% against the dollar at one point.
The benchmark, the S&P500 ended the session with a modest gain, snapping a four-day losing streak. Seven out of eleven sectors stayed in the positive territory, and the Energy sector got the best performance among all groups, rising 1.52% daily for the day. It’s also worth noting that Consumer Discretion performed the worst among all groups, falling 1.13% on Tuesday. The Dow Jones Industrial Average edged higher by 0.3%, the Nasdaq 100 little moved lowed 0.1%, and the MSCI World index dropped by 0.7% on Tuesday.
Main Pairs Movement
The DXY index dropped almost 0.6% during the BoJ Press Conference and further declined during the US trading hour to end below the 104 level.
The GBPUSD edged higher by 0.28% daily for the day, the positive traction mainly comes from the US Dollar pullback. The pair climbed to a daily high above the 1.2200 level when BoJ’s surprising policy adjustment, then rapidly retreated to the 1.2150 level. In the meantime, the EURUSD ended with mild growth on Tuesday, as the weak greenback provide some support.
The gold surged by 1.70% daily, benefiting from risk-aversion sentiment caused by BoJ’s surprising policy adjustment. The XAUUSD suddenly gained strong fresh transactions during UK trading sessions and stand firmly above the $1800 mark in the US trading hours.
Technical Analysis
EURUSD (4-Hour Chart)
EURUSD surged on Tuesday, trading higher to 1.0651, as the dollar sold off during the Asian trading course following the BoJ monetary policy decision. The Boj left its benchmark interest rate unchanged at -0.1% and kept the 10-year JGB yield at 0.00%, which fits the expectation. However, they allowed the 10-year JGB yield to fluctuate between -0.5% and 0.5%, compared to -0.25% and 0.25% previously and noted that they will review yield curve control operations. On Wednesday, Germany will release the GFK Consumer Confidence Survey, to be expected at -38 in January. US will publish December CB consumer Confidence, foreseen at 101 in December.
On the technical side, the 4-hour chart shows that the pair is neutral, swinging around a slightly bearish 20-day SMA, while the longer moving averages hold a bullish slope below the shorter ones. Meanwhile, technical indicators are stuck near the midline with no directional strength. However, it is worth adding that buyers continue to defend the downside as it slips below the 1.0600 thresholds.
RSI(14) for the pair sits at 50.79, as of writing. On the four-hour chart, EURUSD currently trades above its 50, 100 day SMA, but below 200 days SMA.
Resistance: 1.0650, 1.0695, 1.0785
Support: 1.0580, 1.0538, 1.0480
GBPUSD (4-Hour Chart)
The cable is recovering ground above 1.2150 in the European trading course. It extends recovery, as the US dollar loses further ground across the board. Markets remain unnerved after the surprise of the BoJ policy move, spiking up US treasury yields. On the monetary policy side, Fed remained relatively hawkish, while the BoE’s MPC was split on the extent of interest rate hikes, with two members voting to keep rates unchanged. This pushed GBPUSD sharply lower, down 1.99% on the day. The Fed’s firm hawkish stance is likely to continue to support the dollar trend, putting further downward pressure on the cable. In terms of economic data and event risks, UK’s final annualized GDP for the third quarter is due on Thursday. In addition, the release of the US core PCE data on Friday could be a catalyst for the cable’s post-market movement, as the Fed’s preferred measure indicator of inflation, the core PCE data will help confirm whether the US inflation has peaked.
Cable is holding in about the middle of the past week’s range between support at 1.2090/00 and resistance at 1.2240/50. Trend signals are mixed and weak across the shorter-term studies, suggesting more sideways-range trade in the near term. RSI(14) for the pair sits at 48.13, as of writing. On the four-hour chart, GBPUSD currently trades below its 50, 100, and 200-day SMA.
Resistance: 1.2320, 1.2600
Support: 1.2100, 1.2000, 1.1940
XAUUSD (4-Hour Chart)
Tuesday’s surprise move by the BoJ to widen the target range for the 10-year government bond yield from -0.5% to 0.5%, was seen as a sign of softening its easing stance, causing the dollar to plummet against the yen and dragging down the performance of the dollar index. The retreat in the dollar index supported a rebound in gold prices, which have now regained stability at the 1800 level.
However, the US Treasury bond yields are rallying 3.50% to 4% across the curve, with the benchmark 10-year US rates above 3.70%, at the moment. Surging US Treasury yields are acting as a big hurdle to Gold’s upswing. On the other hand, as the world’s biggest gold consumer, China. The country reported five new Covid deaths on Monday, this made markets remained unnerved.
On the technical side, the gold price surged over 1.5% from today’s opening to now, the price has broken through the last estimated resistance level of 1,820 and dropped at current today’s high of 1,821. RSI(14) for the yellow metal sits at 48.13, as of writing. On the four-hour chart, XAUUSD currently trades below its 100 and 200-day SMA but above its 50-day SMA.
As global investors worry about a recession, U.S. stocks fell on Monday. The Dow fell 162.92 points to 32757.54. S&P 500 dropped 34.7 points to 3817.66. Tech-heavy Nasdaq rose 159.38 points to 10546.03. The Fed, BoE, and ECB raised rates by 50 basis points last week to curb inflation.
The benchmark 10-year U.S. government yield rose to 3.596% yesterday. The S&P500 lost 0.9% and the DJIA 0.5%. Communication Service had the worst day, dropping 2.19%. Ten of eleven sectors were negative. On Monday, only the Energy sector rose 0.13%.
Main Pairs Movement
Investors were cautious on Monday, keeping the US Dollar index flat. In the first part of the day, the DXY index fell dramatically to a daily low of around 104.1 in the middle of UK trading. In the second part of Monday, the US dollar recovered most of its losses.
As market players await stories indicating more economic pain for the UK and the next move of the safe-haven greenback, the GBPUSD has not moved today. In the morning, the pair rose to 1.2240 before turning south. Late UK trading erased the cables’ daily gain. The EURUSD fell sharply in the late UK trading hour and gained 0.2% on Monday.
No catalyst changed sentiment, therefore Gold fell 0.3%. After reaching a daily high at $1799, the XAUUSD fell below $1787 in the American trading session.
Technical Analysis
EURUSD (4-Hour Chart)
EURUSD rose Monday. Euro bullishness peaked throughout the European trading session due to the better-than-expected German Ifo Business Climate index. Today, the U.S. Greenback struggled. The U.S. Dollar began the day trading lower and only found bidding towards the conclusion of the European trading session, but support for the Greenback faltered during the American trading session as U.S. equities suffered another selloff. On the 22nd and 23rd, the U.S. will report quarterly GDP and PCE.
Technically, EURUSD is below our 1.0785 resistance line. Short-term support for the pair is around 1.05, but longer-term support is around 1.035. RSI is 63.58 for the pair. EURUSD is above its 50, 100, and 200-day SMA on the four-hour chart.
Resistance: 1.0785
Support: 1.0538, 1.031
GBPUSD (4-Hour Chart)
After Thursday’s selloff erased all weekly gains, GBPUSD is below its opening price. The pound tumbled from highs to lows, breaking through three key support levels before stabilising above the 20 and 200-day averages. Price rose 0.33% today, slipping below 1.2200 at writing. This may prevent a short-term drop to 1.1940 and 1.1907. Christmas may boost the pound. Despite many unfavourable variables, the Cable price may fall further if the UK Q3 GDP report disappoints. As the Fed’s preferred inflation gauge, Friday’s US core PCE price index, forecast to rise to 4.6% from 5%, may potentially benefit sellers.
The pair may not test last week’s high of 1.2447, but the medium-term technical view is encouraging. Despite last week’s rising wedge break, the bullish 21-day moving average at 1.2146 supports GBP bulls.
RSI(14) is 48.67 for the pair. GBPUSD is below its 50, 100, and 200-day SMA on the four-hour chart.
Resistance: 1.2320, 1.2600
Support: 1.2100,1.1940, 1.1907
XAUUSD (4-Hour Chart)
Spot gold rose to $1,798.68 per troy ounce before falling to $1,786. The US currency fell today. As COVID-19 restrictions lifted, some multinational technology companies resumed operations in China, boosting market sentiment. Next year, local authorities will boost spending and help the private sector to boost the economy. Stocks fell and government bond yields rose before the US opened. Since the mood changed for no reason, the dollar’s gains were restricted. Gold price failed to achieve $1,804 again and again in the past three weeks, indicating that gold prices stabilised above $1,770, but if the market loses, it could fall to $1,740.
Technically, gold fell after touching $1,800, but the dollar weakening restrained losses. The daily chart shows that it is losing upward momentum, although the 20-day SMA is advancing below a mildly bearish 200-day SMA, offering intraday support around $1,776.40. The yellow metal’s RSI(14) is 45.24. On the four-hour chart, XAUUSD is below its 100 and 200-day SMA but above its 50-day SMA.
The financial markets will be monitoring the Bank of Japan policy statement this week. The central bank is expected to keep its short-term interest rate at -0.1%, the same as the previous month.
Meanwhile, Canada will also be under scrutiny, as its Consumer Price Index is expected to rise by 0.4% in November.
Here are the upcoming events for this week:
Bank of Japan Monetary Policy Statement (20 December)
In its October policy statement, the Bank of Japan kept its key short term interest rate at -0.1% and that for 10-year bond yields around 0%. However, it revised its inflation forecast to 2.9% from 2.3% in July, citing surging prices of energy, food, and durable goods.
Analysts expect the bank to keep its policy unchanged for this month.
Canada’s Consumer Price Index (21 December)
Canada’s Consumer Price Index (CPI) increased by 0.7% in October over the previous month. According to analysts, Canada’s CPI is expected to rise a further 0.4% in November.
Canada’s Gross Domestic Product (23 December)
The Canadian economy expanded by 0.1% in September, reversing an upwardly revised 0.3% increase in August.
Economists expect the country’s gross domestic product to be unchanged in October.
US Core PCE Price Index (23 December)
The US Core PCE Price Index, excluding food and energy, increased by 0.2% month-on-month in October compared with 0.5% in September.
Analysts expect the index to rise by another 0.2% in November.
US stocks confronted the longest weekly losing streak since September, as investors were concerned that the Federal Reserve’s resolve to keep raising rates could tip the economy into a recession. Market participants had cheered the softer-than-expected inflation data earlier this week.
However, that euphoria faded as Fed officials hammered home the message that rates will go higher for longer until they’re confident inflation has been subdued. While the Fed raised rates by an expected 50 basis points on Wednesday, risk assets have been on the back foot ever since policymakers signalled a peak rate that was above market expectations. A wave of rate hikes and hawkish outlooks from central banks across the globe, including the European Central Bank, further bruised sentiment this week.
The benchmarks, the S&P500 and the tech-heavy Nasdaq 100 closed the session lower for a third day. The S&P500 dropped lower with 1.11% on Friday and the Nasdaq 100 was down by 0.9% for the day. All eleven sectors of the S&P500 stayed in the negative territory, as the Real Estate sector performed the worst among all groups, falling by 2.96% on a daily basis. Meanwhile, the Dow Jones Industrial Average edged lower by 0.9% on a daily basis and the MSCI world index tumbled by 2.4% on Friday.
Main Pairs Movement
The US Dollar edged higher by 0.27% on a daily basis, as investors are consuming the Federal Reserve’s resolve to raise interest rates higher and longer. The DXY index extended its upside momentum since late UK trading and ended at a level above 104.8.
The GBPUSD slid by 0.25% for the day, as the Bank of England raised its policy rate by 50 basis points following the December policy meeting as expected. The pair dropped to a daily low level below 1.2120 during the UK trading session. Meanwhile, the EURUSD dropped nearly 0.55% during the US trading hour with investors consuming that European Central Bank announced that it raised key rates by 50 basis points. The pair fell 0.4% on Friday.
The XAUUSD surged by 0.91% for the day, managing to erase some losses from the biggest weekly loss in four. The gold price witnessed some positive traction during the UK trading hours, regaining the huge fall from last Thursday.
Technical Analysis
EURUSD (4-Hour Chart)
EURUSD traded lower on the last trading day of the week. Despite falling on the last two trading days of the week, EURUSD still posted a weekly gain of more than 0.5%. The Euro underperformed against the Dollar on the last two trading days as recessionary fears and risk-off sentiment prevailed across markets. Released during last Friday’s American trading session, the lower-than-expected U.S. PMI figure dragged on U.S. equities as market participants reassess the slowing down of purchasing and the U.S. economic outlook. Furthermore, the higher-than-anticipated European region CPI did little to boost sentiment surrounding the Euro. The ECB’s decision to hike rates on the 15th did not create the expected upward boost for the Euro, rather the decision is criticized as being a late reaction, which is proven by Friday’s CPI upside surprise. On the economic docket, U.S. GDP and weekly initial jobless claims will be released on the 22nd, while no major economic data releases are scheduled for the Euro.
On the technical side, EURUSD continues to retreat from our previously estimated resistance level of 1.0785. The 76.4% Fibonacci retracement level of 1.0538 now presents itself as a short-term support level for the pair. RSI for EURUSD sits at 42.44, as of writing. On the four-hour chart, EURUSD is currently trading below its 50, 100, and 200-day SMA.
Resistance: 1.0785
Support: 1.0538, 1.031
GBPUSD (4-Hour Chart)
The pound looks set to be under severe pressure against the dollar by the end of the week, with weak economic data on Friday stoking fears of a recession. BoE raised interest rates by 0.5%, bringing the benchmark rate to its highest level since 2008 (3.5%). However, it was not strong enough to prevent the Cable from suffering the biggest decline in past six weeks in one day. Although six of the nine Monetary Policy Committee members were in favour of the decision, and one wanted stricter action, the market still interpreted the move as a dovish rate hike. BoE Governor Andrew Bailey said we may see a glimmer of hope that inflation may be slowing. But even so, he said that further rate hikes may still be appropriate given the tightness of local labour conditions. Nevertheless, the market made its choice and the pound fell. Also, the December PMI data showed that the dominant service sector remained in expansionary territory, while manufacturing improved slightly this month. Companies reported that price pressures eased further from this year’s record highs. However, these figures do not dispel market fears of a recession in the UK and have put pressure on the pound during the European session.
On the technical side, GBPUSD failed to reach our previously estimated resistance level of near the 1.26 price region. The short-term support level for the pair remains at around the 1.19 and 1.176 price region. RSI(14) for the pair sits at 44.77, as of writing. On the four-hour chart, GBPUSD currently trades below its 50, 100, and 200-day SMA.
Resistance: 1.2666, 1.3000
Support: 1.1900, 1.176
XAUUSD (4-Hour Chart)
Gold raise more than 0.5% as of writing during Friday’s trading session. After the hawkish message from the US Federal Reserve on Wednesday, the ECB followed right behind the pace, making it clear that there would be more than 50 basis points of rate hikes in the following meetings. This took markets surprised and triggered a rally in EURUSD, but was reversed immediately as the Fed remains in the lead. In other gold-related news, India plans to invite tenders to extract gold from 50 million tons of processed ore from colonial-era mines in the southern state of Karnataka, Reuters reported, citing a senior government official with direct knowledge of the matter. The potential increase in gold supply has negatively impacted the outlook for gold prices.
In other gold-related news, India plans to invite tenders to extract gold from 50 million tons of processed ore from colonial-era mines in the southern state of Karnataka, Reuters reported, citing a senior government official with direct knowledge of the matter. The potential increase in gold supply has negatively impacted the outlook for gold prices.
On the technical side, if the price stabilizes above $1,790 and confirms that level as support, it could test $1,800 in the near term and then aim for $1,830 (50% Fibonacci retracement of the long-term downtrend). RSI(14) for the yellow metal sits at 57.66, as of writing. On the four-hour chart, XAUUSD currently trades below its 50, and 100-day SMA but above its 200-day SMA.