Singapore’s industrial production rose 4.7% m/m (seasonally adjusted) and 10.1% y/y in March, after -1.2% m/m and 3.3% y/y in February. Manufacturing growth in 1Q26 was 7.9% y/y, above the 5.0% y/y in the advance estimates.
If construction and services were unchanged from the advance estimates, 1Q26 GDP growth may be revised to about 5.2% y/y from 4.6%. The March rise was led by electronics and precision engineering output.
Electronics increased 5.7% m/m (seasonally adjusted) in March, after 5.1% in February. Precision engineering rose 21.8% m/m, after -13.3% in February.
Chemicals fell 18.5% m/m in March, after -1.8% in February. Within chemicals, petrol output declined 13.4% in March versus -12.5% in February, while petrochemicals dropped 23.9% versus -8.1%.
The Economic Development Board cited disruptions in feedstock supply, and reports noted refinery and petrochemical run cuts in Asia, with some force majeure declarations. Electronics and semiconductors linked to AI-related demand were cited as supporting overall output.
Given the strong March industrial production figures, we see a likely upward revision to Singapore’s first-quarter GDP growth for 2026. This strength is not surprising, as advance GDP estimates have historically been revised upwards in a majority of recent quarters. This provides a solid backdrop for bullish sentiment on the broader Singaporean market.
The electronics sector is the clear engine of this growth, propelled by sustained global demand for AI-related semiconductors. The latest data from the Semiconductor Industry Association confirms this, showing global sales jumped 22% year-over-year in March, with forecasts pointing to continued strength. This suggests that buying call options on specific semiconductor and precision engineering stocks could offer upside exposure in the coming weeks.
Conversely, a major slump is evident in the chemicals segment due to feedstock supply disruptions, with a sharp plunge seen in petroleum and petrochemical output. Recent industry reports confirm this trend, with Platts noting that Asian naphtha cracker operating rates fell to a two-year low last week as more producers cut runs. This growing headwind makes buying put options on exposed chemical companies a compelling strategy to hedge against or profit from further weakness.
The most effective strategy appears to be a divergence trade, focusing on the widening gap between the booming tech sector and the struggling chemical industry. We saw a similar dynamic back in 2022 when energy supply shocks caused significant underperformance in downstream producers for several quarters. A pair trade that is long tech-related equities and short exposed chemical stocks could capture this ongoing performance gap.
Written on April 28, 2026 at 5:30 am, by josephine
NZD/USD traded near 0.5910 on Tuesday as the US Dollar weakened. Lower US Treasury yields reduced support for the Dollar and helped the Kiwi recover.
Geopolitical news was mixed, with Middle East tensions still adding uncertainty. Reports said Iran’s Foreign Minister Abbas Araqchi stated the US had requested negotiations, while Iran was assessing the proposal, which eased safe-haven demand.
Fed Outlook And Dollar Pressure
Markets also reassessed the Federal Reserve outlook amid political pressure to cut rates and firmer forward guidance. This shift weighed on the US Dollar even as US economic data stayed resilient.
On the 4-hour chart, NZD/USD held above all moving averages, with the flat 20-period SMA near 0.5890. The 100 SMA is above the 200 SMA, and both sit below the 20 SMA.
Indicators stayed in positive territory but showed limited momentum. A move above 0.5930, the April monthly high, could open the way for further gains.
Looking back to this time in 2025, we saw the NZD/USD gain strength from a weakening US dollar and falling Treasury yields. The market was expecting the Federal Reserve to ease its policy, which gave a lift to riskier currencies like the Kiwi. This sentiment suggested a potential break above the 0.5930 level.
Options Approach And Risk Management
Today, the situation has evolved, as the US 10-year Treasury yield is holding firm near 4.6%, much higher than the environment last year. While New Zealand’s own inflation came in at 4.0% for the first quarter, keeping the RBNZ on alert, recent US inflation data has been sticky at around 3.5%. This has forced markets to push back expectations for any deep Fed rate cuts.
Given the bullish momentum noted last year and the pair currently trading above 0.5930, traders could consider buying call options. This strategy allows for betting on further upside toward the 0.6000 psychological level with a defined, limited risk. It capitalizes on the idea that the Kiwi can hold its ground, even with a strong dollar.
However, the strength in US yields presents a significant headwind that was not present in 2025. To hedge against a potential reversal, purchasing put options with a strike price below the key 0.5890 support level is a prudent move. This would protect against a scenario where the Fed’s higher-for-longer policy stance ultimately strengthens the dollar.
This divergence between US policy and the Kiwi’s resilience suggests that using option spreads may be effective in the coming weeks. A bull call spread could capture modest gains while minimizing premium costs if you believe the upside is limited. Such a strategy helps define your risk and potential profit in what is becoming a more complex trading environment.
The spot yuan traded 0.04% lower at 6.8305 against the dollar, after moving in a tight 6.8270 to 6.8313 range.
The PBOC set the midpoint at 6.8589 per dollar, versus 6.8579 in the previous session, and 307 pips weaker than a market estimate.
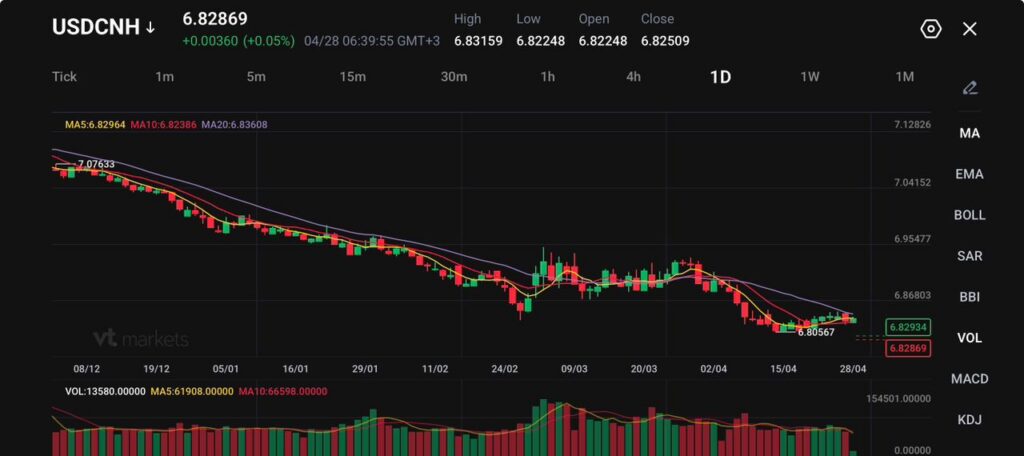
USD/CNH traded at 6.82869 on the chart, up 0.00360, or 0.05%, while the dollar index stood at 98.59.
China’s yuan stayed in a narrow range against the dollar on Tuesday as traders waited for the Federal Reserve’s policy signal. The spot yuan traded 0.04% lower at 6.8305 against the dollar by 0300 GMT, after moving between 6.8270 and 6.8313.
The offshore yuan also softened. USD/CNH traded at 6.8312 yuan per dollar, down about 0.08% in Asian trade. The dollar’s six-currency index stood at 98.59, showing that dollar demand remained firm, but not aggressive.
The move reflects a market that is pausing rather than turning. The yuan is still up 1.0% against the dollar this month and 2.4% firmer this year.
China’s biggest yuan bond sale in Hong Kong since 2023 drew record-low yields for both two- and 15-year debt, as Beijing speeds up its push to internationalize the currency and mop up pockets of excess liquidity offshore https://t.co/1hWTa5GbkY
That keeps it in a stronger position than many Asian peers, especially as oil-linked stress weighs more heavily on economies with weaker energy buffers.
PBOC Fixing Slows Yuan Appreciation
The People’s Bank of China set the midpoint rate at 6.8589 per dollar before the market opened. That compares with 6.8579 in the previous session and came 307 pips weaker than a market estimate. The spot yuan can trade 2% either side of the fixed midpoint each day.
This weaker midpoint curbed yuan appreciation. It also showed that policymakers still want control over the pace of currency strength. A stronger yuan can help reduce imported inflation, especially when energy prices stay high. But too much strength can hurt exporters at a time when China still needs trade resilience to support growth.
Chinese early stage funds are increasingly offering a fundraising structure that appeals to US investors wary of American compliance restrictions but keen to grow exposure to non-sensitive sectors in China https://t.co/IQ1AtANxhF
Uncertainty around US rate policy and geopolitical risk has temporarily supported the dollar. They added that China’s fixing guidance remained broadly on the strong side, helped by resilient exports.
That creates a managed balance. The PBOC appears willing to let the yuan stay firm, but not run too fast. Traders should watch whether future fixings stay weaker than market estimates, as that would suggest Beijing wants a slow grind rather than a sharp rally.
China’s Export Position Supports Yuan Resilience
The yuan has also gained support from China’s role in the energy shock. Some analysts see it as a relative winner from the crisis caused by the Iran war, as China’s export base benefits from demand for renewables, batteries, and solar systems.
Recent data showed China’s clean-tech export receipts rose 30% from February and 52% from the same month in 2025 as the Middle East shock drove demand for home-grown energy supplies worldwide.
That helps explain why the yuan may continue to outperform other Asian currencies. A stronger export position can support capital inflows, trade receipts, and currency confidence. At the same time, a stronger yuan can soften imported inflation pressure, which gives Beijing more room to manage domestic policy.
Still, the benefit has limits. If oil prices keep rising, Asia’s wider current-account stress can still spill into regional FX markets. A broad dollar rebound would also slow yuan gains, even if China’s export story stays firm.
U.S.-China Summit Becomes The Next Test
The next major event for the yuan is the U.S.-China presidential summit in May. The bank expects risks in U.S.-China ties to stay contained. Citi expects the yuan to reach 6.8 in three months and 6.7 in six to 12 months.
That forecast fits the current trend, but it still depends on two conditions. First, the Fed must avoid a fresh hawkish shift. Second, the May summit must keep trade and geopolitical risks under control.
If the summit delivers a calmer tone, yuan bulls may press USD/CNH lower. If the talks sour, traders may rebuild dollar hedges and slow the yuan’s advance.
Technical Analysis
USDCNH is trading near 6.8287, stabilising after a steady decline from the 7.07 highs, with price now moving sideways as selling pressure begins to ease. The broader trend remains downward, but recent price action suggests the pair is entering a short-term consolidation phase near the lows.
From a technical standpoint, the bias remains bearish but softening. Price is still trading below the 20-day moving average (6.8360), which continues to slope downward and caps upside attempts. However, the 5-day (6.8296) and 10-day (6.8239) are flattening around current levels, indicating that downside momentum is slowing and a base may be forming.
Key levels to watch:
Support: 6.8050 → 6.7800 → 6.7500
Resistance: 6.8300 → 6.8600 → 6.9000
The pair is currently consolidating just above the 6.8050 support zone, where recent declines have paused. A break below this level could resume the broader downtrend and open a move toward 6.7800.
On the upside, 6.8300 is acting as immediate resistance. A move above this level could trigger a corrective rebound toward 6.8600, though stronger resistance remains near the 20-day average, which would need to be reclaimed to signal a more meaningful shift in trend.
Overall, USDCNH remains in a controlled downtrend with signs of near-term stabilisation. The focus now is on whether price breaks below 6.8050 to continue lower, or builds a base and attempts a corrective bounce.
Cautious Forecast
The yuan’s near-term bias remains mildly firm while USD/CNH stays below 6.83608. A move below 6.82248 would support a retest of 6.80567, with 6.8 as the next key psychological target.
A hawkish Fed tone could slow that move and lift USD/CNH back toward 6.86803. A softer Fed message, steady PBOC guidance, and calmer U.S.-China signals before the May summit would support Citi’s view for 6.8 in three months and 6.7 in six to 12 months.
The yuan is trading in a narrow range because traders are waiting for the Federal Reserve’s policy decision on Wednesday.
The spot yuan was 0.04% lower at 6.8305 against the dollar by 0300 GMT, after trading between 6.8270 and 6.8313. That shows a market holding back before the Fed gives clearer guidance on rates.
What Did The PBOC Midpoint Fixing Show?
The People’s Bank of China set the midpoint rate at 6.8589 per dollar, compared with 6.8579 in the previous session.
The fixing was 307 pips weaker than a market estimate, which curbed yuan appreciation. The spot yuan can trade 2% either side of the daily fixed midpoint.
Why Does The Federal Reserve Matter For USD/CNH?
The Federal Reserve matters because US interest-rate expectations drive dollar demand.
If the Fed sounds cautious on inflation and keeps rates higher for longer, the dollar may stay supported. That could push USD/CNH higher. If the Fed signals a softer path ahead, the yuan may regain strength and USD/CNH could move lower.
What Is The Dollar Index Showing?
The dollar’s six-currency index stood at 98.59.
That suggests the dollar remains supported, helped by uncertainty around US rate policy and geopolitical risk. However, the move is not strong enough yet to fully reverse the yuan’s broader recovery this year.
How Has The Yuan Performed This Month?
The yuan is up 1.0% against the dollar this month.
It is also 2.4% firmer this year. That makes it one of the stronger Asian currencies, helped by China’s export resilience and its relative position during the energy crisis linked to the Iran war.
Start trading now – Click here to create your real VT Markets account
Written on April 28, 2026 at 5:17 am, by josephine
NZD/USD rose about 0.4% on Monday to near 0.5905, but it stayed below 0.5925, which capped last week’s rebound. The pair remains range-bound, with higher lows since the early-April 0.5680 trough, yet momentum is fading near 0.5900.
New Zealand’s Q1 CPI came in hotter than expected, lifting market odds of an RBNZ rate rise in May from under 30% to about 60%, while a July move is fully priced. Domestic events include an RBNZ Deputy Governor Karen Breman speech on Wednesday and ANZ Roy Morgan Consumer Confidence on Thursday, as the Strait of Hormuz blockade raises imported energy costs.
United States Data And Fed Outlook
In the US, the FOMC is expected to keep the federal funds rate at 3.50%–3.75% on Wednesday, in Jerome Powell’s final meeting before his term ends on 15 May. With March headline inflation at 3.3% and Q4 2025 GDP revised to 0.5%, attention turns to Thursday’s Q1 GDP (2.2% consensus) and Core PCE (3.2% YoY forecast), plus Friday’s ISM Manufacturing PMI.
NZD moves with New Zealand growth and RBNZ policy, and is also sensitive to China’s economy and dairy prices. It often gains in risk-on conditions and weakens when markets seek safe havens.
We recall this time last year, in April 2025, when the NZD/USD pair was struggling to break above the 0.5925 level. The rebound from the lows was showing clear signs of exhaustion, trapping us in a tight range. Today, with the pair trading around 0.6150, the landscape has changed, but new challenges are emerging for the Kiwi’s momentum.
As we anticipated, the Reserve Bank of New Zealand followed through on market expectations, hiking its policy rate in both May and July of 2025 to a peak of 6.0% to fight that inflation surge. However, with New Zealand’s latest Q1 2026 CPI data cooling to a 3.8% annual rate, we believe the RBNZ is now firmly on hold. This removes a key pillar of support that drove the currency higher over the past year.
Shifting Rate Differentials And Market Tailwinds
On the other side of the pair, the US Federal Reserve held rates for much of 2025 before delivering a final quarter-point hike late in the year, bringing the Fed Funds Rate to its current 4.0% level. The rate differential that favored the Kiwi throughout the second half of 2025 has therefore peaked and is no longer providing a strong tailwind. US core PCE for March 2026 came in at 2.8%, suggesting the Fed has little reason to consider cutting rates soon.
The Kiwi’s fundamental drivers are also flashing warning signs for us. Recent Global Dairy Trade auctions have shown average prices falling by 3.5% over the past month, directly impacting a crucial export sector. Furthermore, China’s latest manufacturing PMI registered a modest 50.3, indicating that demand from our most important trading partner is expanding at a very slow pace.
Geopolitical risks have also shifted since we were watching the Strait of Hormuz blockade in 2025. While that situation stabilized and allowed risk-sensitive currencies like the Kiwi to rally, our attention is now turning toward the building volatility of the US election cycle. This environment typically increases demand for the safe-haven US Dollar, presenting a significant headwind for NZD/USD.
Given these factors, the strong upward trend we saw from the 2025 lows appears to be losing its drive. The fading support from rate differentials and weakening commodity prices suggests a more range-bound or downward-drifting market ahead. We should consider strategies that benefit from this, such as selling call options on rallies towards the 0.6200 resistance level or using put options to protect against a slide back towards 0.6000.
USD/JPY ended Monday near 159.40, little changed from Friday. It moved in a 75-pip range between 159.10 and 159.85, staying below 160.00 for a third week.
The Bank of Japan is expected to keep its policy rate at 0.75% on Tuesday. Pricing for an April hike fell from 18 basis points at the start of the month to near zero, while markets price 1.00% for June.
Bank Of Japan And Inflation Watch
The Outlook Report is expected to raise core inflation forecasts above the 2.0% target. Thursday’s Tokyo CPI is due, with ex-fresh food inflation forecast at 1.8% year on year.
Japan’s finance minister said authorities have a “free hand” to intervene to stabilise the yen. The 160.00 level is described as a soft intervention threshold.
The Federal Open Market Committee is expected to hold rates at 3.50% to 3.75% on Wednesday. It is Chair Jerome Powell’s final meeting before his term ends on 15 May, and there is no Summary of Economic Projections.
US data in focus include March headline inflation at 3.3%, and Q4 2025 GDP revised to 0.5%. Thursday brings Q1 GDP (2.2% forecast) and core PCE (3.2% YoY forecast), with ISM manufacturing PMI on Friday.
Political And Geopolitical Backdrop
The Senate Banking Committee is due to vote on Kevin Warsh’s nomination on Wednesday. Iran ceasefire uncertainty remains in the background.
Looking back to this time in April 2025, we saw USD/JPY consolidating just below the 160.00 handle, a level that triggered constant verbal warnings from Japanese officials. The market was paralyzed with indecision, waiting for central bank moves from both the Bank of Japan and the US Federal Reserve. This tension created a tight trading range, with everyone watching that key 160 level.
The Bank of Japan did follow through on the tightening path that was being priced in back then, hiking its policy rate in June 2025 and twice more since. With the policy rate now at 1.25%, the environment has changed significantly. Japan’s latest national Core CPI for March 2026 came in at 2.6%, reinforcing the BoJ’s stance that further tightening may be necessary to ensure inflation sustainably meets its target.
In the US, the Federal Reserve has held rates steady under new Chair Kevin Warsh, just as it did in Jerome Powell’s final meeting last year. The stagflationary concerns from 2025 persist, with the most recent Core PCE data for March 2026 at a stubborn 2.8% while Q1 2026 GDP growth was a sluggish 1.1%. This has kept the Fed on hold, unable to cut rates due to inflation but hesitant to hike into a slowing economy.
This policy convergence has fundamentally shifted the USD/JPY landscape, with the pair now trading comfortably in the 148s, far from the intervention fears at 160. The significant interest rate differential that favored the dollar has narrowed, lending strength to the yen over the past year. We see the market now focusing more on economic data rather than central bank jawboning.
Given this, traders should consider selling USD/JPY call options with strikes above 152.00, as a return to the highs of 2025 seems unlikely without a major policy reversal from either the Fed or the BoJ. Buying put spreads could offer a cost-effective way to position for further yen strength if upcoming Japanese wage data suggests more inflationary pressure. Implied volatility is much lower now than during the intervention scares of last year, making option strategies more affordable.
AUD/USD rose towards 0.7200, with the Australian Dollar up about 0.53% on Monday. The pair traded at 0.7185 after rebounding from a daily low of 0.7125, while the US Dollar stayed firm amid uncertainty over the US-Iran conflict.
Wall Street ended Monday modestly higher, supporting risk sentiment ahead of the Federal Reserve meeting. The Fed meeting runs from Tuesday to April 29, and includes a policy statement and Jerome Powell’s final press conference as Fed chief.
Iran Proposal And Market Focus
Iran sent the US a three-step proposal to end the war: an immediate end with guarantees, reopening the Strait of Hormuz, and later talks on nuclear issues. Reuters said President Donald Trump discussed the proposal with senior national security aides after negotiations stalled last week when Iran did not attend talks.
Trump also cancelled his envoy’s trip to Pakistan. Attention now turns to Australian inflation data from the ABS on Wednesday, after no major Australian releases on Tuesday.
In the US, upcoming data include the ADP Employment Change 4-week average, housing data, and the Conference Board Consumer Confidence survey for April.
We are seeing a familiar pattern in the Australian dollar, which reminds us of the situation in late April of 2025. Back then, easing fears of a conflict between the US and Iran helped push the AUD/USD toward the 0.7200 level. Positive sentiment on Wall Street provided an additional tailwind for the risk-sensitive Aussie.
Why The Aussie Is Lagging
Today, the situation is different, as the AUD/USD is struggling around 0.6550 despite some recent positive risk sentiment. While we are seeing a modest de-escalation of tensions in the South China Sea, the Aussie is not responding with the same strength. The S&P 500 has also posted gains, recently climbing over 2% in the last month, but this has failed to spark a significant rally for the currency.
A key factor is Australia’s own stubborn inflation, which came in at 3.8% for the first quarter of 2026. This is keeping the Reserve Bank of Australia from considering any rate cuts and maintains the cash rate at 4.35%. This high inflation should be supportive, but it’s being overshadowed by other global factors.
The main headwind is the wide gap in interest rates between the US and Australia. With the Federal Reserve holding its key rate in the 5.25% to 5.50% range, the US dollar holds a significant yield advantage. This makes it more profitable to hold dollars than Australian dollars, putting downward pressure on the AUD/USD pair.
Given these conflicting signals, we should consider that volatility may be underpriced. Options strategies that profit from a large move in either direction, such as long straddles, could be useful around upcoming central bank announcements. The market seems poised for a breakout, but the direction remains uncertain.
The powerful interest rate differential also means that shorting AUD/USD continues to be a popular carry trade. This suggests that any rallies in the currency pair are likely to be met with selling pressure from traders looking to capitalize on the yield advantage. We saw this in March 2026, when a brief rally above 0.6650 was quickly sold off.
Looking ahead, traders should be focused on the next US inflation reports and Australian employment data. These figures will be critical in shaping the interest rate expectations that are currently dominating the pair’s direction. Any surprise in these numbers could provide the catalyst for the next significant move.
South Korea’s Bank of Korea (BOK) manufacturing Business Survey Index (BSI) rose to 72 in May. It was 71 in the previous reading.
We see the manufacturing business outlook has improved slightly to 72 for May, marking a small but positive step from April’s 71. While this figure remains well below the neutral 100-point mark, indicating pessimism still outweighs optimism, the upward trend is what matters. This aligns with recent data showing South Korea’s exports rose for the sixth straight month in March 2026, driven by a 35% year-on-year surge in semiconductor shipments.
For those trading the Korean won, this small improvement in sentiment provides a weak but supportive floor for the currency. We could consider positioning for a stable or slightly stronger won against the US dollar in the coming weeks. Derivative plays might involve selling out-of-the-money USD/KRW call options to collect premium, betting that the won will not weaken significantly from current levels.
This news reinforces a cautiously optimistic view on the KOSPI 200 index, which is heavily weighted towards manufacturers like Samsung Electronics and SK Hynix. Looking back at the semiconductor-led recovery that started in 2025, this data suggests the momentum may continue. We might see traders use this as a signal to buy short-dated call options on the index, anticipating a modest rally.
Given the incremental nature of this improvement, we don’t expect a major spike in market volatility; in fact, it suggests a steadying economic environment. This stability might reduce the pressure on the Bank of Korea to alter its interest rate policy in the near term. Therefore, strategies that benefit from sideways movement or a slow grind higher, rather than explosive breakouts, could be favorable.
Written on April 28, 2026 at 4:00 am, by josephine
The S&P 500 (SPX) has continued rising from the March low, with the move described as a mature five-wave Elliott impulse pattern. The current phase is presented as wave ‘v’, suggesting the pattern is close to completion.
Using Fibonacci extensions, a potential wave ‘v’ target is 7,231, based on wave ‘v’ reaching 61.8% of the length of wave ‘i’. Further extension levels are 7,344 at 100% equality and 7,525 at 161.8%.
Key Extension Targets To Watch
After the impulse completes, a pullback scenario is outlined using Fibonacci retracements of the full five-wave advance. A typical move is at least a 38% retracement, which would imply a decline towards 6,900–7,000, depending on where the peak forms.
The analysis also refers to a potential 2–5% decline as the pattern ends. The author is Zorrays Junaid of Alchemy Markets, with prior contributions to DailyFX and Elliott Wave Forecast.
The S&P 500’s rally from the March 30, 2026 low appears to be in its final stage. We are now watching for a potential top, which could lead to a 2-5% decline in the coming weeks. Traders should be preparing for a shift in market direction as the current upward impulse pattern matures.
Given the market’s strength, there is still a chance for a final push higher toward our first target of 7,231. With the VIX currently hovering near a two-year low of 13.5, call options can be used to participate in this potential last bit of upside with defined risk. However, this low volatility also signals significant market complacency, which often precedes a downturn.
Positioning For A Potential Reversal
The key levels to watch for a reversal are 7,231 and, if that breaks, 7,344. The recent March 2026 inflation report, which came in slightly hot at 3.6% year-over-year against a 3.4% expectation, could be the catalyst that stalls the rally. This is a similar setup to what we saw in the fall of 2025, when a surprise inflation print triggered a quick 4% correction.
As the index approaches these targets, traders should consider buying protective puts or establishing bear call spreads to position for a potential decline. These strategies can provide downside exposure while managing risk if the market continues to climb. The expected pullback target is the 6,900-7,000 zone, which represents a standard retracement of the entire move up from the March low.
This is not a signal to immediately short the market, but rather to prepare for a pending reversal. The latest jobs report showed a robust 275,000 jobs added, reinforcing the idea that the Fed has little reason to cut rates aggressively and adding weight to a potential near-term top. Therefore, layering into bearish positions as we test resistance may be a prudent strategy over the next few weeks.
TD Securities expects US output growth to slow towards potential by late 2026, as Iran-related stagflation risks keep the Federal Reserve cautious. It forecasts 1.9% Q4/Q4 GDP growth in 2026, unemployment near 4.3% by Q4 2026, and a 30% chance of recession over the next year.
The firm anticipates growth easing to potential by the end of this year, with larger tax refunds supporting consumers facing higher petrol prices. It expects 2026 growth to be front-loaded due to a rebound in government consumption after a shutdown.
Growth Inflation And Policy Outlook
Higher energy prices and tariffs are expected to lift consumer prices in the near term. Core CPI is projected to peak at about 3.0% year-on-year in Q2 2026, with similar figures expected for core PCE.
It expects most oil-price effects to show up in headline inflation. Disinflation is forecast to resume in the second half of 2026.
We are facing immediate stagflationary risks from the conflict in Iran, which should keep the Federal Reserve on hold for most of this year. WTI crude oil futures have remained elevated, trading above $90 per barrel through most of April 2026, directly impacting gasoline prices for consumers. This suggests volatility will remain a key theme in the energy and equity markets.
The expectation is for core inflation to peak right now, during this second quarter. The most recent Core CPI data for March 2026, which came in at 2.9% year-over-year, supports the view that we are at or near the cycle high for inflation. Therefore, traders should watch for opportunities in interest rate derivatives that price in a Fed pause through the summer, with disinflationary trends taking hold later in the year.
Positioning And Risk Management
Given the uncertain growth outlook, hedging equity exposure is prudent. The VIX has been hovering in the high teens, reflecting market anxiety but not outright panic, which could make buying protective put options on major indices relatively affordable. Looking back to the sharp market swings in 2025, we saw how quickly sentiment can shift based on geopolitical headlines, reinforcing the need for defensive positioning.
The forecast for disinflation to resume in the second half of 2026 presents a forward-looking opportunity. This suggests that the current pressure on growth and earnings may begin to ease by Q3 or Q4. As we move into summer, positioning for a decline in long-term bond yields could become a viable strategy if inflation data confirms a downward trend.
A gradual slowdown, rather than a collapse, is the base case, with unemployment expected to rise to just 4.3% by the end of 2026. The latest jobless claims data has shown a slight uptick for three consecutive weeks, aligning with this forecast of a gently cooling labor market. Still, we must consider the 30% probability of a recession over the next twelve months as a significant tail risk to this outlook.
USD/CHF rose about 0.15% on Monday, trading near 0.7854 as the US Dollar rebounded from daily lows during the North American session. The pair is compressing near resistance and is close to the 100-day SMA at 0.7860.
The daily chart is neutral to downward-biased, while the RSI remains bearish but is nearing the neutral line. A move above 0.7860 would bring the 20-day SMA at 0.7881 into view, then 0.7900 and the 200-day SMA at 0.7931.
Key Technical Levels
If the pair drops below the 50-day SMA at 0.7843, it may move towards 0.7800. Further downside levels include the 10 March daily low at 0.7747 and the 0.7700 area.
The Swiss Franc is Switzerland’s currency and is among the top ten most traded currencies globally, with volumes that exceed the size of the Swiss economy. From 2011 to 2015, CHF was pegged to the euro; after the peg ended, CHF rose by more than 20%.
The Swiss National Bank meets four times a year and targets inflation below 2%. CHF often tracks the euro closely, with some models placing EUR–CHF correlation at more than 90%.
Looking back to early 2025, we saw the USD/CHF pair compressing near the 0.7860 level, coiling around its 100-day moving average. The market was at a key inflection point, with momentum indicators suggesting a potential shift in favor of the US dollar. That setup was a precursor to a significant move that has since unfolded.
Options Strategy Outlook
Today, the situation has evolved considerably, with the interest rate differential between the US Federal Reserve and the Swiss National Bank becoming a dominant driver. With the pair now trading around 0.9150, the bullish break we watched for last year has clearly materialized and extended. This trend has been fueled by the SNB’s proactive rate cuts to combat a strengthening franc and low domestic inflation.
Recent data reinforces this divergence, making a compelling case for continued dollar strength. US core inflation is proving sticky at 2.8%, keeping the Federal Reserve cautious, while Swiss inflation sits at just 1.4%, giving the SNB room for further easing. This fundamental gap suggests the path of least resistance for USD/CHF remains upward in the coming weeks.
For derivative traders, this environment favors strategies that profit from a continued grind higher. We should consider buying call options with strike prices targeting the 0.9250 level to capture potential upside with defined risk. Alternatively, bull call spreads could be used to lower the upfront cost of entry while still capitalizing on a move toward that target.
However, we must remain aware of the Swiss Franc’s safe-haven status, which acts as a constant background risk. Any unexpected flare-up in geopolitical tensions or a sudden downturn in global risk appetite could trigger a rapid flight to safety, strengthening the CHF. Traders should hedge long positions with protective puts or maintain clear stop-loss levels to manage this possibility.
The high correlation between the Euro and the Swiss Franc also remains a key factor to monitor. With the European Central Bank signaling a potential rate cut at its next meeting, further weakness in the Euro could weigh on the Franc. This would provide an additional tailwind for our long USD/CHF positions, reinforcing the current bullish outlook.