Silver fell about 1.5% to around $74.40 per troy ounce in Asian trading on Tuesday, slipping below $74.50. The drop came as the US–Iran conflict raised energy costs and added to inflation pressure.
The inflation shock increased expectations that central banks may keep policy tighter for longer. Markets also assessed the chance of a ceasefire after a new Iranian message to the United States.
Ceasefire Signals And Market Impact
Iran reportedly sent details via Pakistan, saying fighting could stop if the US lifts its naval blockade, changes transit rules through Hormuz, and gives assurances against future military action. A US official said on Monday that President Donald Trump rejected the proposal, while Iranian sources said Tehran would not discuss its nuclear programme until hostilities and Gulf shipping disputes are settled.
Attention is also on central bank meetings this week. The Federal Reserve is expected to keep its target range at 3.50% to 3.75% on Wednesday, which would be the third hold in a row.
The Bank of Japan is expected to keep rates at 0.75% on Tuesday. The European Central Bank is expected to keep its deposit rate at 2.0% on Thursday.
With silver slipping below $74.50, we are seeing the market react to war-driven inflation rather than geopolitical risk. The ongoing US-Iran conflict is strengthening expectations that central banks, particularly the Fed, will keep interest rates high to fight rising prices. This directly pressures non-yielding assets like silver.
Strategy And Positioning Considerations
The Federal Reserve is expected to hold its rate at the 3.50-3.75% range this Wednesday, a decision reinforced by the latest US Consumer Price Index report, which showed inflation accelerating to 4.1% year-over-year. For us, this hawkish stance solidifies the high opportunity cost of holding silver compared to interest-bearing assets. This environment is reminiscent of past periods where high nominal rates weighed heavily on precious metals.
In the coming weeks, we should consider positioning for further weakness in XAG/USD. Buying put options with May and June expiration dates offers a clear way to capitalize on potential declines while managing risk. Short-selling silver futures is a more direct approach for those anticipating a break below key technical support levels.
Market data already reflects this bearish sentiment, as implied volatility for silver put options has increased noticeably over the past week. This indicates a growing demand for downside protection among traders. This is a signal that many are preparing for the price to fall further before it finds a stable floor.
Furthermore, we should note silver’s underperformance relative to gold. The gold/silver ratio has recently expanded to 90:1, up from an average of 85:1 we saw through most of 2025. This shows that in the current environment, gold’s safe-haven appeal is outweighing silver’s, which is also being hurt by concerns over slowing industrial demand.
The prospect of a prolonged high-rate environment is a double-edged sword for silver, as it not only increases holding costs but also threatens to dampen industrial activity. Since over half of silver’s demand comes from industrial applications, a potential economic slowdown triggered by tight monetary policy puts a firm ceiling on any price rallies. This industrial headwind was a consistent theme that capped silver’s performance back in 2025.
WTI rose for a second day, trading near $95.20 per barrel during Asian hours on Tuesday. Prices were supported as the Strait of Hormuz remained largely shut, tightening Middle East supply.
Markets also assessed ceasefire prospects and whether the route could reopen after a new Iranian proposal to the US. Iran reportedly said via Pakistan that hostilities could end if the US lifts its naval blockade, changes Hormuz transit rules, and offers guarantees against future military action.
Ceasefire Proposal And Sticking Points
A US official said on Monday that President Donald Trump was dissatisfied with the proposal. Iranian sources said Tehran would not address its nuclear programme until fighting stops and Gulf shipping disputes are resolved.
The conflict is in its ninth week, lifting energy prices and disrupting supply chains. The International Energy Agency warned of a potential supply shock alongside slowing demand risks.
Iran restricted flows through Hormuz, which handles about 20% of global oil and gas, while the US kept a blockade of Iranian ports. Reuters ship-tracking data showed six Iranian tankers turned back, while an ADNOC LNG tanker crossed Hormuz and was nearing India.
With West Texas Intermediate holding near $95.50, we see the market is priced for this conflict but is extremely sensitive to daily headlines. The nine-week shutdown of the Strait of Hormuz creates a high-stakes environment where any news about the US naval blockade or Iranian proposals can cause sharp price swings. Traders must be prepared for this heightened volatility to continue in the coming weeks.
Market Pricing And Trading Implications
The situation presents a clear binary choice based on the outcome of ceasefire negotiations. A successful deal that reopens the strait would likely send prices tumbling back towards the low $80s, while a definitive collapse in talks could push crude oil well past the $100 mark. We are essentially trading geopolitical speculation, not just supply and demand fundamentals.
This uncertainty is reflected in the derivatives market, where the CBOE Crude Oil Volatility Index (OVX) has surged to over 50, a level we haven’t seen since the major supply disruptions of 2022. This high implied volatility makes buying options expensive, but holding unhedged positions is even riskier. We believe using options to define risk is the most sensible approach right now.
Even before this crisis, the market was tight, a fact we saw in the Energy Information Administration’s (EIA) data showing consistent inventory draws through March and early April 2026. The International Energy Agency’s last monthly report had already pointed to a global supply deficit for the second quarter. The Hormuz disruption, which affects nearly 21 million barrels of oil per day, is amplifying a pre-existing problem.
Given the sharp potential moves in either direction, strategies that profit from volatility, such as straddles or strangles, should be considered. These allow a trader to benefit from a large price move without having to correctly guess the direction of the breakout. Simple directional bets through futures contracts carry immense risk if diplomatic news suddenly shifts the narrative.
We must also watch for small signs that the blockade is not absolute, as these could cap price gains. The successful passage of an ADNOC LNG tanker to India suggests some energy flows are continuing, which might prevent a full-blown panic. Closely monitoring ship-tracking data for any increase in tanker traffic will be a critical leading indicator for us.
USD/CAD rebounded from a dip in Asia on Tuesday, after a modest bounce from sub-1.3600 levels that were the lowest since 12 March. It traded near 1.3630, with limited upside due to opposing drivers.
Mixed messages on US-Iran peace talks supported the US dollar through safe-haven demand. Iran reportedly sent the US a new proposal to reopen the Strait of Hormuz and end the war, while leaving nuclear talks for later.
Key Geopolitical Drivers
The Wall Street Journal reported that US President Donald Trump was sceptical about Iran acting in good faith or accepting his demand to end nuclear enrichment. At the same time, disruption to shipping through the Strait of Hormuz kept crude oil prices elevated.
Higher oil prices supported the Canadian dollar and capped gains in USD/CAD. Traders were also cautious ahead of central bank decisions.
The Bank of Canada announces policy on Wednesday, followed by the outcome of the two-day FOMC meeting. Markets are watching whether higher energy prices raise inflation pressures and affect the policy outlook, which could drive the next move in USD/CAD.
The USD/CAD is showing renewed strength, trading around 1.3750 as of April 28, 2026. This price action is reminiscent of the uncertainty we saw back in 2025 during the US-Iran geopolitical tensions. At that time, conflicting fundamentals created a tense, range-bound market, a pattern that may be re-emerging.
Policy Divergence Outlook
Crude oil remains a critical factor, with WTI currently holding strong above $85 a barrel, a level that typically supports the Canadian dollar. Unlike the sudden, conflict-driven price spikes of 2025, today’s elevated prices are due to persistent supply discipline and steady global demand. This provides a fundamental floor for the loonie but is not enough to drive it significantly higher against the dollar.
The main driver now is the clear policy divergence between the Bank of Canada (BoC) and the US Federal Reserve. With recent Canadian inflation cooling to 2.5%, the BoC is openly discussing potential rate cuts by summer. Conversely, the Fed is holding firm after the latest US inflation print came in hotter than expected at 3.4%, pushing back any rate cut expectations.
This tug-of-war suggests implied volatility in USD/CAD options is likely underpriced for the coming weeks. We believe derivative traders should consider strategies that benefit from a significant move in either direction, such as long straddles, rather than making simple directional bets. The market is pricing in a calm that the diverging economic data does not justify.
Therefore, establishing positions in three-month options could be a prudent way to capture the fallout from the next round of central bank meetings. Look for a sustained break of the 1.3800 level as a signal for further USD strength. A failure to break that resistance could see the pair fall back towards the 1.3650 support level on any dovish Fed commentary.
Spot gold fell 1.1% to $4,628.88 per ounce at 0553 GMT, its lowest level since April 7.
US gold futures for June delivery fell 1.1% to $4,643.70, while spot silver dropped 3% to $73.23.
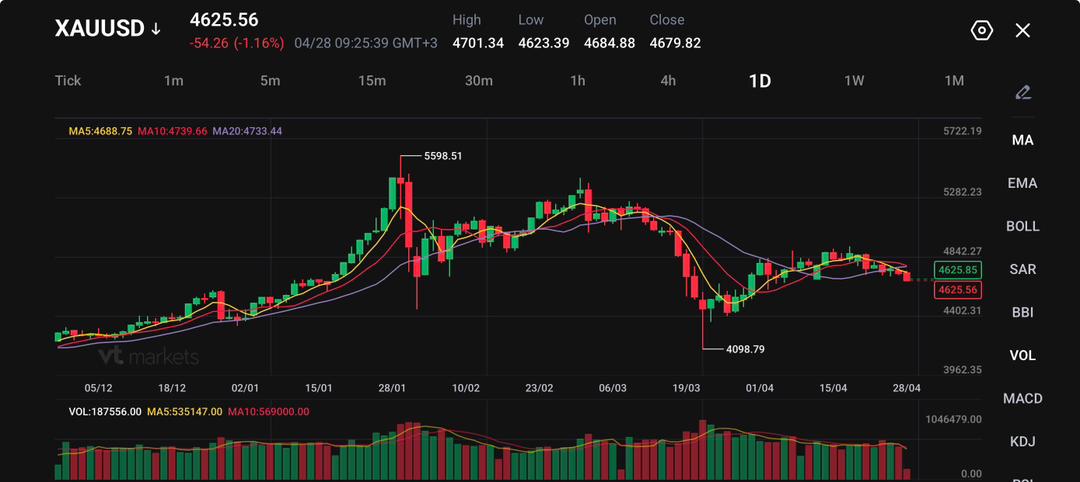
XAU/USD traded at 4,625.56 on the chart, down 54.26 points, or 1.16%, with price below its 5-day, 10-day, and 20-day moving averages.
Gold fell to a three-week low on Tuesday as traders focused less on war risk itself and more on what the war means for inflation and interest rates. Spot gold was down 1.1% at $4,628.88 per ounce as of 0553 GMT, its lowest level since April 7. US gold futures for June delivery also fell 1.1% to $4,643.70.
Azerbaijan’s State Oil Fund sold about 22 tons of gold in the first quarter of the year, after a record-breaking rally pushed the sovereign wealth fund’s allocation of the metal to its maximum threshold https://t.co/LHjteDWLqU
The drop may seem counterintuitive. Gold often draws demand during geopolitical stress. This time, the conflict has pushed oil higher, kept the Strait of Hormuz largely shut, and fed concern that inflation could stay sticky for longer. That has shifted the trade away from classic haven buying and back toward rate risk.
The dollar also edged higher, which added pressure. A firmer dollar makes gold more expensive for holders of other currencies. When that happens at the same time as yields stay supported, gold can lose momentum even while the geopolitical backdrop remains tense.
Oil Above $110 Changes The Gold Trade
Oil prices hovered above $110 a barrel as the Strait of Hormuz remained largely shut. That matters for gold because higher crude prices can lift transport and production costs, then feed through into headline inflation. If central banks fear that second-round inflation pressure is building, they have less room to cut rates.
Gold usually works well as an inflation hedge, but it does not pay income. When markets expect higher-for-longer interest rates, yield-bearing assets can look more attractive. That is why bullion can fall even when inflation fears rise.
China’s CMOC Group signed a $1.7 billion agreement with Ecuador to develop a major gold mine in the South American country https://t.co/76NMKGfCTr
The Middle East story remains the main driver. A US official said President Donald Trump was unhappy with the latest Iranian proposal to resolve the two-month war. That dampened hopes for a settlement after a conflict that has disrupted energy supplies, fuelled inflation, and killed thousands.
Fed Decision Keeps Traders On Hold
The Federal Reserve is widely expected to hold interest rates steady at the end of its two-day meeting on Wednesday. The key issue is not the rate decision itself. It is the tone around inflation, energy prices, and the future path for policy. Fed officials are weighing whether to signal possible rate hikes as the oil shock complicates the outlook.
Fed officials are expected to leave interest rates unchanged this week at a gathering that’s being overshadowed by a political drama surrounding the leadership handover at the US central bank https://t.co/N6xhoBpplN
Edward Meir of Marex argued that the Fed may not move rates for now and could cut later in the fourth quarter if the global economy slows. That gives gold a split signal. Near term, sticky inflation and a stronger dollar can pressure bullion. Later, if growth slows and rate-cut expectations return, gold may find support again.
Traders will also watch the European Central Bank, Bank of England, and Bank of Canada this week. A cautious tone from major central banks could keep pressure on gold. A softer tone, especially if paired with weaker data, could revive demand for bullion as a defensive asset.
Geopolitics Still Sets The Breakout Risk
The gold market is now trading a narrow balance between diplomacy and inflation risk. If the US and Iran reach a deal or an interim agreement, oil could ease, the dollar could weaken, and gold may regain upside momentum. A deal could help gold break higher if it weighs on the dollar.
If talks fail, the first reaction may still be complicated. Fresh conflict risk could lift haven demand, but another oil spike could also keep inflation fears high and support the dollar. That means gold may need a clear dollar decline, not just geopolitical fear, to rebuild a strong bullish trend.
For now, traders appear unwilling to chase bullion while oil remains elevated and the Fed remains in focus.
Technical Analysis
XAUUSD is trading near 4625, extending its recent pullback as price slips below short-term support and continues to drift lower from the mid-April consolidation zone. After failing to sustain momentum above the 4700–4750 area, gold is now showing renewed downside pressure.
From a technical standpoint, the bias is bearish in the near term. Price has moved below the 5-day (4688) and 10-day (4739) moving averages, both of which are now turning lower and acting as immediate resistance. The 20-day (4733) also sits above current price and is beginning to flatten, reinforcing the loss of bullish momentum and shift toward a corrective phase.
Key levels to watch:
Support: 4600 → 4500 → 4400
Resistance: 4685 → 4740 → 4850
The market is currently testing the 4600 support zone, which is a key near-term level. A clean break below this area could open the door for a move toward 4500, with further downside potential if selling accelerates.
On the upside, 4685 is acting as immediate resistance. Any rebound into this zone may face selling pressure unless price can reclaim the 4740 region, which would be needed to stabilise the structure and signal a pause in the decline.
Overall, gold is losing support and shifting into a corrective downtrend, with momentum favouring sellers in the near term. The focus now is on whether 4600 holds, or if the market extends lower toward deeper support levels.
Precious Metals Weaken Across The Board
Gold was not the only metal under pressure. Spot silver fell 3% to $73.23 per ounce, platinum lost 1.5% to $1,953.50, and palladium dropped 2.1% to $1,445.50.
That broader weakness suggests the move is not only about gold-specific positioning. Traders are reducing exposure across precious metals as the dollar firms and central bank risk returns to the centre of the market.
Silver’s 3% fall shows that growth-sensitive metals are also under strain. Platinum and palladium may stay exposed if higher energy prices raise cost pressure while demand expectations weaken.
Cautious Forecast
Gold may stay under pressure while XAU/USD trades below 4,688.75 and the 4,733.44 to 4,739.66 moving-average zone. A break below 4,623.39 would raise the risk of a deeper pullback toward 4,402.31.
A recovery above 4,701.34 would ease immediate selling pressure, but gold needs a close above 4,739.66 to rebuild upside momentum. A softer Fed tone, a weaker dollar, or a real US-Iran breakthrough could support a rebound toward 4,842.27. A hawkish Fed tone, oil above $110, and stalled diplomacy would keep sellers active on rallies.
Gold fell because traders focused on oil-driven inflation risk and upcoming central bank decisions.
Spot gold dropped 1.1% to $4,628.88 per ounce at 0553 GMT, its lowest level since April 7. US gold futures for June delivery also fell 1.1% to $4,643.70.
Why Are High Oil Prices Hurting Gold?
High oil prices can raise transport and production costs, which can keep inflation pressure high.
Oil hovered above $110 a barrel as the Strait of Hormuz remained largely shut. If higher oil keeps inflation sticky, central banks may delay rate cuts or keep policy tighter for longer. That can weigh on gold because bullion does not pay interest.
Is Gold Still A Safe-Haven Asset?
Gold is still a safe-haven asset, but it can struggle when the dollar rises and rate expectations stay firm.
In this case, geopolitical risk remains high, but traders are also watching inflation, the Federal Reserve, and the dollar. That mix has made gold more sensitive to rate risk than usual.
What Is The Federal Reserve Expected To Do?
The Federal Reserve is widely expected to hold interest rates steady at the end of its two-day meeting on Wednesday.
The rate decision may not surprise markets. Traders will focus on the Fed’s tone, especially whether policymakers sound more worried about oil-driven inflation or a global slowdown.
Could The Fed Support Gold Later This Year?
Gold could regain support later this year if the Fed signals that rate cuts remain possible.
Edward Meir of Marex said the Fed may not move rates for now, but could cut later in the fourth quarter if the global economy slows. A softer rate outlook would reduce the appeal of yield-bearing assets and may support gold.
Start trading now – Click here to create your real VT Markets account
Written on April 28, 2026 at 7:17 am, by josephine
Japan’s finance minister, Satsuki Katayama, said the economy is rebounding moderately and wage growth momentum is continuing, but the outlook needs caution. Economy minister Minoru Kiuchi said he wants the Bank of Japan to align communication and policy coordination with the government to reach a 2% inflation goal.
Japan plans to review currency swap deals with Asian countries ahead of Asian Development Bank and ASEAN Plus meetings. Officials said swings in crude oil futures are affecting foreign exchange, and Japan is ready to act decisively if needed.
Japan Signals Heightened Market Vigilance
Japan said it will cooperate closely with the US and take action if required. Authorities said they are monitoring markets 24/7.
At the time of writing, USD/JPY was down 0.01% at 159.40. The yen’s value is linked to Japan’s economic performance, Bank of Japan policy, the gap between Japanese and US bond yields, and market risk sentiment.
The Bank of Japan has sometimes intervened in currency markets, usually to weaken the yen. Ultra-loose policy from 2013 to 2024 contributed to yen depreciation, while a gradual unwind in 2024 has offered some support.
The 10-year US–Japan yield gap widened over the past decade, supporting the US dollar versus the yen. The gap has been narrowing as Japan moved away from ultra-loose policy and other central banks cut rates.
Intervention Risk And Volatility Outlook
As we see USD/JPY pushing 162.50, the warnings from Japanese officials we heard back in 2025 when the rate was near 159.40 are now much more urgent. The government’s repeated promises to “act decisively” mean the risk of direct currency intervention is extremely high at these levels. Traders should be cautious of long USD/JPY positions and consider options that protect against a sudden, sharp drop in the pair.
The core issue remains the vast difference in interest rates, which has only slowly narrowed since the Bank of Japan started its policy shift in 2024. With the US Fed funds rate holding at 4.50% and the BoJ’s policy rate at a mere 0.25%, the carry trade favouring the dollar is still very powerful. This fundamental pressure continues to weaken the Yen and will likely persist until the BoJ signals a more aggressive hiking path.
However, we are seeing signs that the BoJ may be forced to move sooner than the market expects. The recent spring “shunto” wage negotiations secured an average pay increase of 4.5%, marking the third strong year in a row. With Japan’s core inflation now consistently holding above the 2% target for the last six months, pressure is building on the central bank to normalize policy more quickly.
These conflicting forces—intervention risk versus a wide interest rate gap—create significant uncertainty and suggest a period of high volatility. The market is caught between a slow grind higher on carry trades and the risk of a rapid 3-5 yen drop from an intervention event. This environment is ideal for volatility-based derivative strategies, such as buying straddles or strangles on USD/JPY, which profit from a large price move in either direction.
EUR/USD rose slightly to about 1.1725 in early Asian trade on Tuesday. Gains may be capped as markets remain cautious amid stalled US-Iran talks.
Iran said it would reopen the Strait of Hormuz if the US lifts its blockade and the war ends, according to Bloomberg. The proposal would delay talks on Iran’s nuclear programme.
Geopolitical Tensions And Safe Haven Demand
US President Donald Trump appeared unlikely to accept the offer, and US Secretary of State Marco Rubio indicated any deal would need to include the nuclear issue. Continued tension and the Strait’s closure may support demand for the US dollar as a safe-haven, which can weigh on EUR/USD.
Markets are focused on central bank decisions this week, with the Federal Reserve due on Wednesday and the European Central Bank on Thursday. Traders are positioning ahead of both announcements.
The Fed is widely expected to keep rates unchanged at 3.50% to 3.75% at its April meeting, the third straight hold. Attention will be on Jerome Powell’s press conference for guidance on the policy outlook.
The ECB is expected to leave its deposit rate at 2.0%, where it has been since June last year. Policymakers may remain cautious due to uncertainty linked to the Middle East conflict.
Market Context In Late April 2025
Looking back to this period in late April 2025, we recall the market was tense, with EUR/USD hovering around 1.1725. The key drivers were the impending central bank meetings and the standoff over the Strait of Hormuz. This uncertainty created significant potential for volatility, which traders needed to prepare for.
The geopolitical risk surrounding Iran did indeed cause a spike in market fear, as we saw the VIX jump over 20% in the weeks that followed. However, the situation eventually de-escalated without a full-blown conflict, causing volatility to collapse by mid-2025. Traders who sold options or volatility futures after the initial panic were well-rewarded as tensions eased.
As anticipated, the Federal Reserve maintained its hawkish “higher-for-longer” stance throughout 2025, supported by core inflation that refused to drop below 3.5% that year. This policy kept the US dollar strong against most currencies, including the Euro. The consistent message from the Fed created a clear trend for traders to follow.
Conversely, the European Central Bank buckled under the pressure of slowing growth exacerbated by the Middle East energy fears. After holding rates through the summer of 2025, they signaled a pivot and began cutting rates in the fourth quarter as Eurozone GDP growth fell to just 0.2%. This policy divergence from the Fed was the single most important driver for the currency markets last year.
This divergence in central bank policy is the primary reason EUR/USD has fallen from the 1.1700s to its current level near 1.0850. For the coming weeks, selling rallies in EUR/USD remains the dominant strategy, perhaps by using call spreads to limit risk while capitalizing on the pair’s inability to sustain gains. The wide interest rate differential, with US rates currently at 3.75% and ECB rates now at 1.50%, continues to favor the dollar.
We must now watch this week’s US inflation data closely, as any surprise could shift the Fed’s calculus. A higher-than-expected inflation print would reinforce the current dollar-positive environment. Traders should consider using simple put options to hedge against any unexpected dovish turn from the Fed, though this remains a low-probability event.
The UK BRC Shop Price Index rose 1% year on year in April. The forecast was 1.5%, so the result was 0.5 percentage points lower.
The recent UK shop price data for April shows inflation is cooling much faster than we anticipated, coming in at 1% instead of the expected 1.5%. This signals that consumer price pressures are easing significantly, giving the Bank of England a strong reason to lean towards cutting interest rates. For us, this makes dovish monetary policy a more immediate possibility than it was just yesterday.
Policy Implications For Rate Markets
We should adjust our positions on interest rate futures, as the market will quickly price in a higher probability of a BoE rate cut this summer. Overnight index swaps already reflect a shift, now suggesting a greater than 50% chance of a cut by the August meeting, a notable jump from last week. We anticipate the SONIA forward curve will continue to flatten as traders bet on lower rates for longer.
This outlook is likely to put downward pressure on the British pound. We should consider buying put options on GBP/USD, as lower UK interest rate expectations make the currency less attractive to hold. Looking back, we saw a similar dynamic in the third quarter of 2025 when weak inflation data preceded a sustained drop in sterling’s value against the dollar.
Conversely, the prospect of cheaper borrowing costs could provide a tailwind for UK equities. Call options on the FTSE 100 index now look more appealing, as lower rates tend to boost corporate earnings and stock market valuations. With the UK’s volatility index, the VFTSE, currently trading near yearly lows, the cost of securing this upside exposure remains relatively inexpensive.
However, we must remember this is just one data point, even if it is an important one. We are still waiting for the official CPI figures and, more crucially, the UK wage growth data due next month. Hot wage inflation could easily reverse this sentiment, so any new positions should be sized to account for that upcoming event risk.
US Treasury Secretary Scott Bessent said the United States will sanction anyone doing business with Iranian airlines that are under sanctions, as commercial flights resume from Tehran. The Wall Street Journal reported the warning on Monday.
He said the Treasury will apply “maximum pressure” on Iran. He also said working with sanctioned Iranian airlines may lead to sanctions.
Maximum Pressure Signals
Bessent said he discussed risks linked to overcapacity production with the EU. No further details were provided in the report.
Market pricing moved higher after the comments. West Texas Intermediate (WTI) was up 1.35% on the day at $94.65 at the time of writing.
With West Texas Intermediate crude already pushing $94.65, the immediate signal is to prepare for further upside. This warning of “maximum pressure” on Iran introduces a significant geopolitical risk premium into the market. We should anticipate that any escalation could quickly drive prices toward the psychological $100 per barrel mark.
This isn’t just about airlines; it’s a clear signal that the US is willing to tighten its stance on Iran’s economic activity. We know from tanker tracking data that Iranian crude exports were surprisingly resilient through late 2025, averaging close to 1.5 million barrels per day. The threat of secondary sanctions puts this supply at risk, tightening an already fragile global balance.
Supply Side Constraints
This development comes at a time when the supply side is already constrained. Earlier this month, OPEC+ agreed to maintain its voluntary production cuts of 2.2 million barrels per day through the end of the second quarter. With major producers holding back supply, the market has very little buffer to absorb a potential disruption from Iran.
We saw a similar, though smaller, jump last year when diplomatic talks in Vienna first showed signs of breaking down. That price action in mid-2025 demonstrated how sensitive oil markets are to news flow out of the region. This history suggests the current rally has strong fundamental support based on past market behavior.
For derivative traders, this points toward buying call options for the coming weeks, specifically looking at June and July 2026 contracts with strike prices at or above $100. The rise in tensions will increase implied volatility, making options more expensive but also reflecting the real possibility of a sharp price spike. Considering vertical call spreads could be a prudent way to define risk while positioning for a continued move higher.
US President Donald Trump and his national security team discussed Iran’s proposal to reopen the Strait of Hormuz and end the war, Reuters reported on Monday. The war has lasted two months.
White House press secretary Karoline Leavitt said it is unclear whether Trump will accept the offer, and said his bottom-line demands have not changed. She said the topic was discussed and that Trump would speak about it.
Oil Market Volatility Outlook
West Texas Intermediate (WTI) was up 1.35% on the day at $94.65 at the time of writing.
The current discussion between the US and Iran introduces significant uncertainty into the oil market. With WTI crude already at $94.65 after a two-month conflict, any news, positive or negative, will cause sharp price swings. This environment suggests we should prepare for heightened volatility in the weeks ahead.
We’ve seen the market price in a substantial war premium over the last eight weeks. If a credible peace agreement is reached to reopen the strait, oil prices could fall sharply as this risk premium evaporates. This is a classic “sell the news” scenario traders must be prepared for.
Trading Approaches For A Binary Outcome
Looking back, we saw a similar pattern during the initial phase of the Ukraine conflict in 2022. Prices surged on the initial shock but then retreated significantly over the following months, even as the conflict continued. This historical parallel warns against assuming that prices will only go up from here.
The Strait of Hormuz is not a minor chokepoint; it handles about 21 million barrels per day. This represents roughly 20% of global daily oil consumption, according to recent data from the U.S. Energy Information Administration. The sheer volume of oil at risk explains why the market is reacting so strongly to diplomatic whispers.
Given the binary nature of this situation—either peace or continued war—we should consider strategies that profit from large price movements. Buying options, such as straddles, on crude oil futures could be a prudent way to trade the expected spike in volatility without betting on a specific direction.
For those anticipating a peace deal, buying put options would offer a leveraged bet on a price collapse toward the low $80s. Conversely, if we believe the talks will fail, call options would be the tool to use for a potential move back towards $100 per barrel.
In the coming weeks, we need to watch more than just headlines from the White House. We should monitor satellite data on tanker movements in the Gulf and closely track shifts in the oil volatility index (OVX), which is currently elevated. These indicators will provide an early warning of market direction.
Gold (XAU/USD) fell to about $4,685 in early Asian trading on Tuesday. Markets were cautious ahead of the US Federal Reserve interest rate decision and changing Middle East developments.
The FOMC is expected to keep the overnight rate at 3.50%–3.75%, unchanged since December. Traders will watch Jerome Powell’s press conference for indications on possible rate rises later this year.
Fed Leadership In Focus
There is also attention on whether Powell would remain on the Fed Board of Governors if Warsh is confirmed in time to lead the next policy meeting in June. Comments seen as hawkish could support the US Dollar and pressure dollar-priced commodities such as gold.
US-Iran tensions and the closure of the Strait of Hormuz raised crude oil prices, adding to inflation concerns and reducing the scope for rate cuts. Gold does not pay interest, which can reduce demand when rates are high.
CNBC reported that US President Donald Trump and his security team discussed an Iranian proposal to reopen the Strait if the US lifts its blockade and the war ends. The report said it would delay talks on Tehran’s nuclear ambitions, and it remains unclear if the offer will be accepted.
Central banks are the largest holders; they added 1,136 tonnes, worth about $70 billion, in 2022, the highest annual buying on record. Gold often moves opposite to the US Dollar, US Treasuries, and risk assets, and is influenced by geopolitics, recession fears, interest rates, and the Dollar.
Market Outlook And Scenarios
We are seeing gold prices pull back slightly to around $2,450 as traders adopt a cautious stance ahead of the Federal Reserve meeting. We expect the Fed to hold its benchmark interest rate steady in the 4.00%-4.25% range. The market’s focus will be entirely on any clues about future policy direction, especially concerning inflation.
With the latest CPI data from March showing inflation stubbornly at 2.8%, well above the Fed’s target, we anticipate a hawkish tone from officials. Any indication that rates will stay higher for longer would likely strengthen the US Dollar. As a non-yielding asset, this makes gold less attractive and could trigger a further price drop.
However, gold continues to find support from ongoing geopolitical tensions, particularly with the recent naval escalations in the South China Sea. We saw a similar dynamic during the regional flare-ups of 2025, where uncertainty boosted demand for safe-haven assets. This underlying bid could limit the downside for gold, even if the Fed’s message is firm.
We must also consider the persistent demand from central banks, which provides a strong fundamental floor for prices. According to the latest World Gold Council figures for the first quarter of 2026, central banks added another 250 tonnes to their reserves. This continues the powerful accumulation trend we have observed since 2022.
For derivative traders, this environment suggests that buying volatility could be a prudent strategy. The opposing forces of a potentially hawkish Fed and persistent safe-haven demand create a wide range of possible outcomes. Using options, such as straddles or strangles, allows for profiting from a large price move in either direction following the Fed announcement.