Mixed Stock Market Results as Investors Await Inflation Data; Currency Market Sees Nuanced Movements

On Tuesday, the stock market displayed mixed outcomes with the S&P 500 and Nasdaq Composite experiencing slight gains, while the Dow Jones Industrial Average faced a minor decline amidst anticipation for upcoming inflation data. Corporate earnings, particularly from Macy’s and Lowe’s, alongside economic indicators, played significant roles in market dynamics. Meanwhile, the currency market witnessed subtle shifts, with the Japanese yen strengthening against the dollar following Japan’s higher-than-expected core CPI report. Investor focus remains on key economic releases, including the personal consumption expenditure price index, with global monetary policy expectations influencing market sentiment.

Stock Market Updates

On Tuesday, the stock market saw mixed results as investors awaited crucial inflation data expected later in the week. The S&P 500 edged up by 0.17% to 5,078.18, while the Nasdaq Composite saw a modest increase of 0.37%, closing at 16,035.30. Contrarily, the Dow Jones Industrial Average experienced a slight downturn, dropping by 96.82 points, or 0.25%, to end at 38,972.41. Notable movements included Macy’s, which surged 3.4% after announcing plans to close approximately 150 underperforming stores due to a previous revenue shortfall. Additionally, Lowe’s shares increased by 1.7% following an earnings beat, with Zoom Video and Hims & Hers Health also making significant gains after surpassing Wall Street’s earnings expectations.

A mix of corporate earnings reports and economic indicators influenced the market’s dynamics. The utilities sector led the market with a 1.9% increase, while the communications services and technology sectors also saw gains. This activity followed a decline from record highs the previous week, spurred by Nvidia’s impressive earnings. Moreover, investor sentiment was affected by a drop in consumer confidence amid concerns over a potential labor market slowdown and a divisive political climate, as reported by the Conference Board. Additionally, a decrease in orders for long-lasting goods in January, particularly in transportation, underscored these economic uncertainties. As investors look ahead, the forthcoming release of the personal consumption expenditure price index and personal income data will be closely scrutinized for insights into economic health and monetary policy direction.

Data by Bloomberg

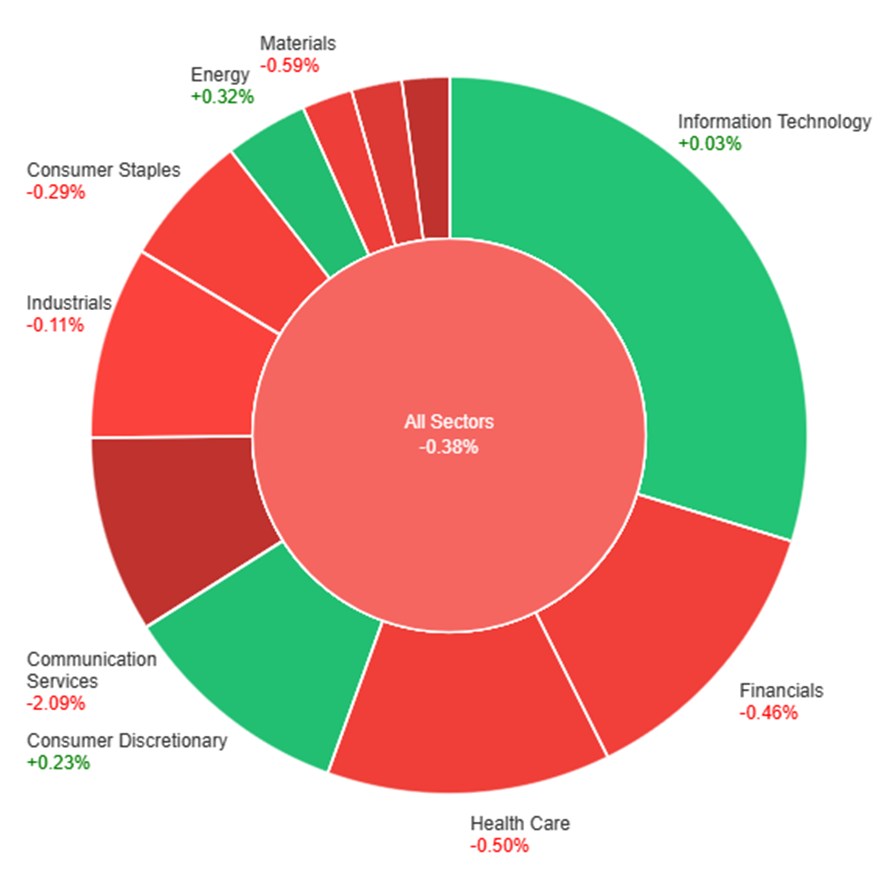
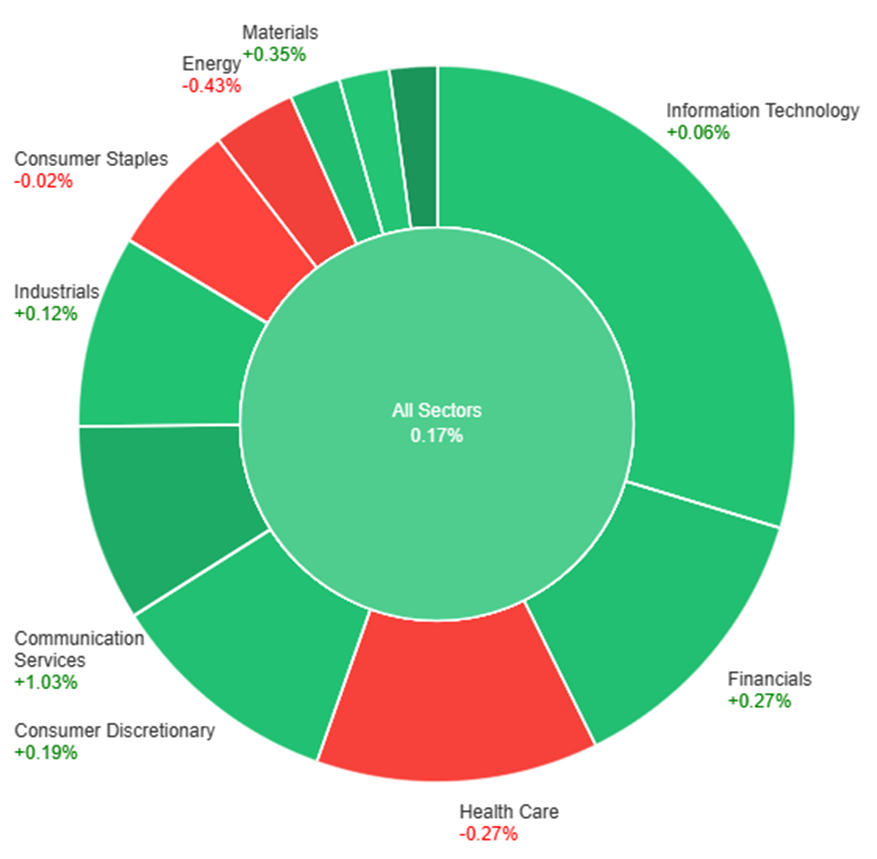
On Tuesdayday, the overall market saw modest gains, with all sectors collectively up by 0.17%. Utilities led the performance with a significant increase of 1.89%, followed by Communication Services and Materials, which rose by 1.03% and 0.35%, respectively. Financials, Consumer Discretionary, and Industrials also experienced gains, though more modest, ranging from 0.12% to 0.27%. Information Technology and Real Estate sectors saw minimal increases, whereas Consumer Staples, Health Care, and Energy sectors faced declines, with Energy recording the largest drop at -0.43%.

Currency Market Updates

The currency market saw nuanced movements with the dollar index slightly declining by 0.09%, influenced by a mix of supportive corporate month-end flows and weaker-than-expected U.S. economic data concerning durable goods and consumer confidence. The Japanese yen emerged as a notable performer, appreciating following a report that showed Japan’s core CPI rising above forecasts. This development came amidst static policy pricing from major central banks such as the Federal Reserve, European Central Bank, and the Bank of Japan, with the market participants keenly awaiting further key data releases scheduled for later in the week and the next.

The FX landscape was further characterized by the lingering weakness of the USD against the JPY, spurred by Japan’s inflation data, while the EUR/USD, GBP/USD, and other major currency pairs saw marginal gains. Despite some reasons to overlook the disappointing U.S. durable goods data, attributed partly to Boeing’s challenges, the misses in economic reports have heightened the anticipation for upcoming releases on core PCE, income, spending, and employment data. Market speculation regarding the Federal Reserve’s interest rate path remains a focal point, especially after Kansas City Fed President Jeffrey Schmid’s hawkish remarks, contrasting with the market’s reduced expectations for Fed rate cuts. The evolving monetary policy expectations for the ECB, BoE, and BoJ also play a critical role in shaping the currency market dynamics, with all eyes on the upcoming eurozone CPI and U.S. core PCE data to gauge potential shifts in monetary policy and currency valuations.

Picks of the Day Analysis
EUR/USD (4 Hours)

EUR/USD Stabilizes Amid Anticipation of Key Economic Data

The EUR/USD pair has been hovering around the 1.0850 mark, showing little movement as traders await impactful economic releases. Following a more significant than expected decline in US Durable Goods Orders for January, market focus now shifts to upcoming US GDP figures, German Retail Sales, CPI data, and the US PCE inflation report. These forthcoming data points are crucial for gauging the economic health of both regions and could potentially influence the currency pair’s direction.

Chart EUR/USD by TradingView

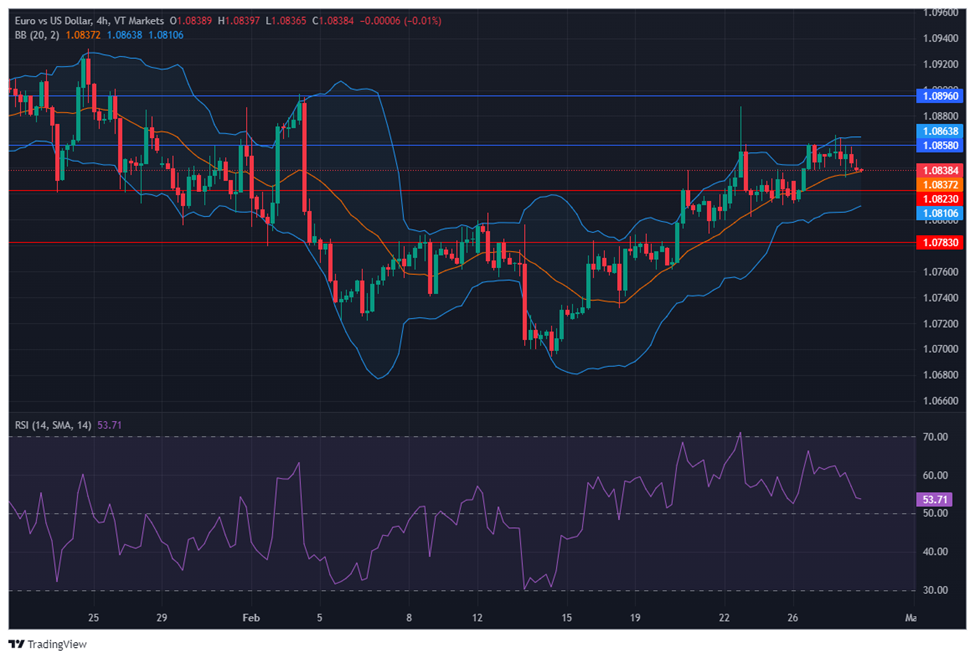
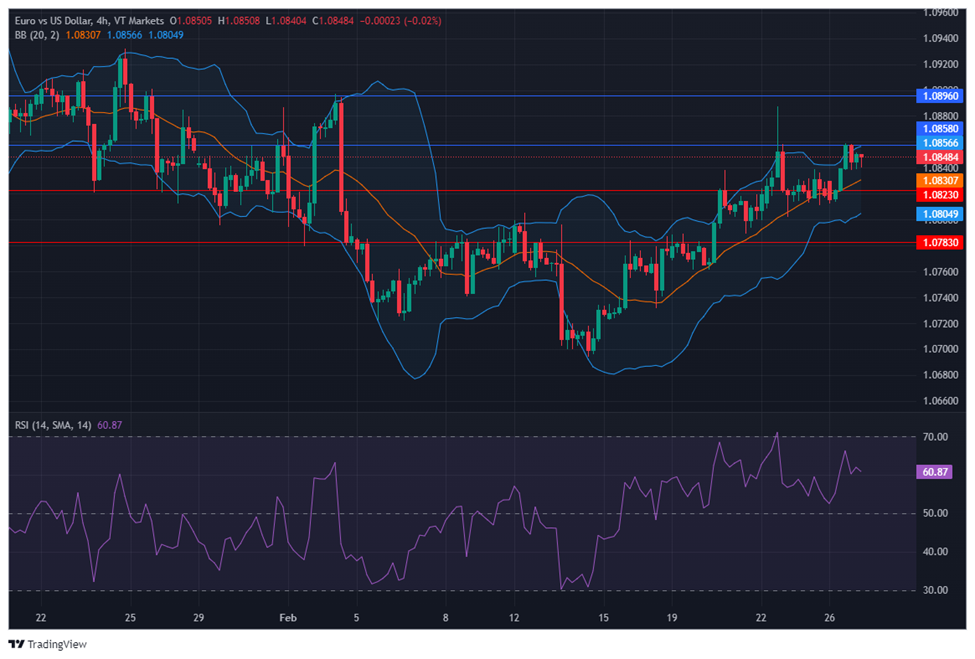
On Tuesday, the EUR/USD moved slightly lower and was able to reach the middle band of the Bollinger Bands. Currently, the price is moving around the middle band, suggesting a potential downward movement to reach below the middle band. Notably, the Relative Strength Index (RSI) maintains its position at 53, signaling a neutral outlook for this currency pair.

Resistance: 1.0858, 1.0896

Support: 1.0823, 1.0783

XAU/USD (4 Hours)

XAU/USD See Modest Gains Amid Weakening Dollar and Anticipation for Key Economic Reports

Gold (XAU/USD) experienced a slight increase in its price during Tuesday’s mid-North American session, trading at $2,034.88, a 0.18% gain, amid a backdrop of falling US Treasury bond yields and a weakening US Dollar, as indicated by a 0.05% drop in the US Dollar Index (DXY). This modest uptick occurs as the precious metal hovers around the 50-day Simple Moving Average, with investors keenly awaiting the Personal Consumption Expenditures (PCE) report and latest Gross Domestic Product (GDP) data, which are anticipated to be significant factors that could drive Gold out of its current $2,020-$2,050 trading range. The outlook is further clouded by the recent report on Durable Goods Orders for January, which fell more sharply than expected, and mixed Home Prices data, suggesting a potentially volatile period ahead for Gold prices.

Chart XAU/USD by TradingView

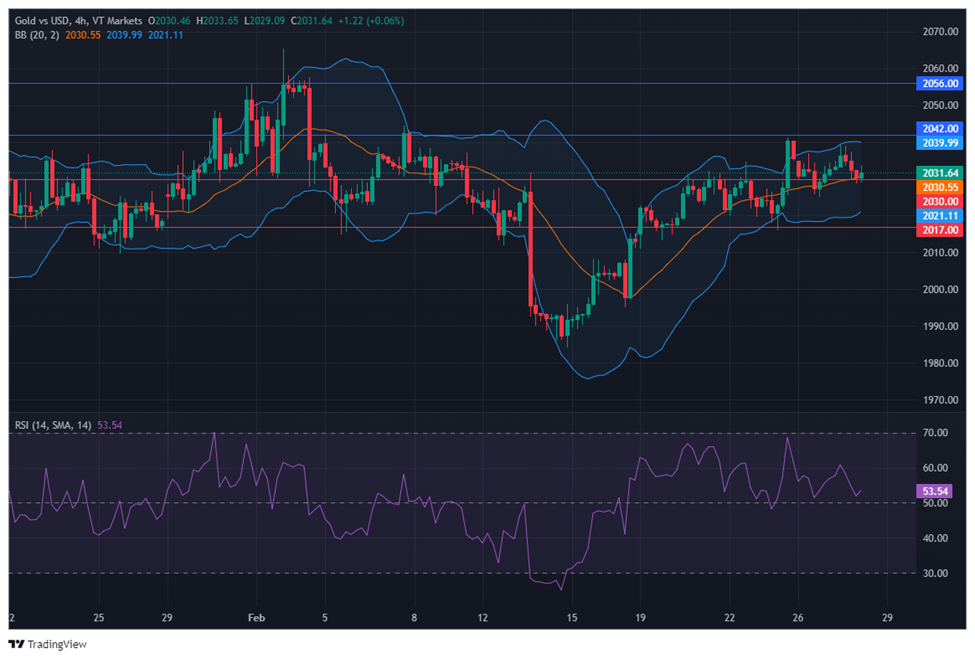
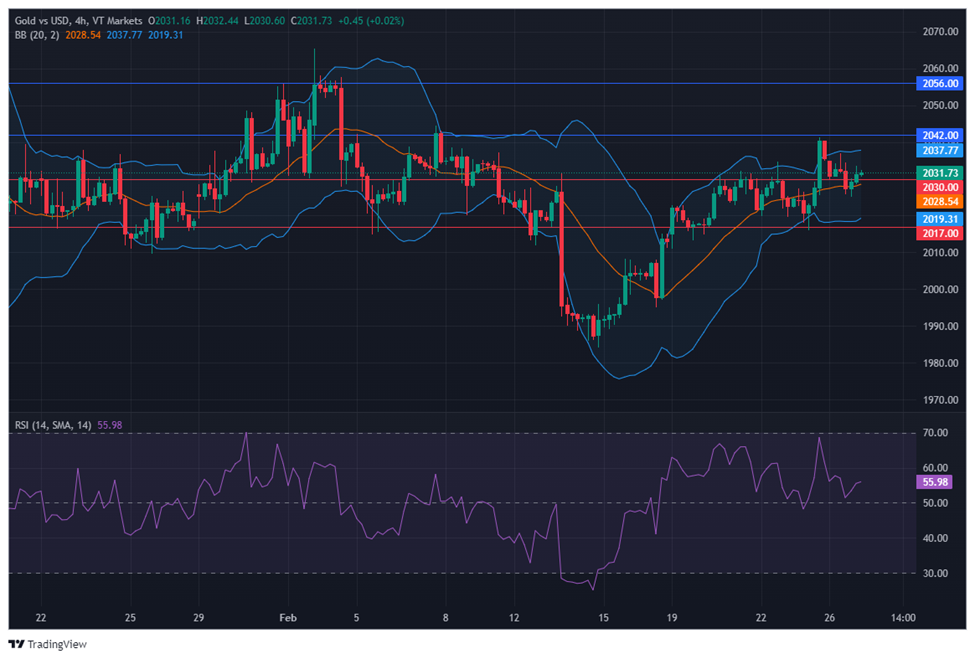
On Tuesday, XAU/USD moved lower to reach the middle band of the Bollinger Bands. Currently, the price is moving just above the middle band, suggesting a potential consolidation movement. The Relative Strength Index (RSI) stands at 53, signaling a neutral outlook for this pair.

Resistance: $2,042, $2,056

Support: $2,030, $2,017

Economic Data
CurrencyDataTime (GMT + 8)Forecast
AUDCPI y/y08:303.4% (Actual)
NZDOfficial Cash Rate09:005.50% (Actual)
NZDRBNZ Monetary Policy Statement09:00 
NZDRBNZ Rate Statement09:00 
USDPrelim GDP q/q21:303.3%

Dividend Adjustment Notice – February 27, 2024

Dear Client,

Please note that the dividends of the following products will be adjusted accordingly. Index dividends will be executed separately through a balance statement directly to your trading account, and the comment will be in the following format “Div & Product Name & Net Volume ”.

Please refer to the table below for more details:

The above data is for reference only, please refer to the MT4/MT5 software for specific data.

If you’d like more information, please don’t hesitate to contact [email protected].

Forex Market Analysis: USD Resilience Amid PCE Data Anticipation and Stock Market Volatility

CURRENCIES:
  • The DXY index, which measures the US dollar’s performance, showed limited movement on Monday despite a slight increase in US Treasury yields.
  • Investors are adopting a cautious approach in anticipation of Thursday’s core personal consumption expenditures (PCE) deflator release, a critical inflation measure favored by the Federal Reserve.
  • January’s core PCE is anticipated to rise by 0.4% from December, potentially reducing the annual rate from 2.9% to 2.8%, indicating a modest yet positive development.
  • There’s a possibility that the actual figures could exceed expectations, mirroring recent trends seen in CPI and PPI reports, which could impact traders’ outlooks.

Upcoming US PCE Report Analysis:

  • An unexpected increase in the PCE data might lead to higher interest rate expectations, suggesting a delayed start or smaller reductions in the easing cycle by policymakers.
  • Such a scenario would likely result in higher US Treasury yields, benefiting the US dollar.

Technical Analysis of USD Currency Pairs:

  • The latter part of the article shifts focus to the technical analysis of EUR/USD, USD/CAD, and USD/JPY currency pairs.
  • It will explore market sentiment and pinpoint crucial support and resistance levels that may influence the pairs’ movements in the near future.

STOCK MARKET:

Market Performance:

  • The Dow Jones Industrial Average (^DJI) decreased by 0.2%.
  • The S&P 500 (^GSPC) dropped by 0.4% after reaching new highs last week.
  • The Nasdaq Composite (^IXIC) experienced a 0.1% decline, following a strong performance in tech stocks.

Inflation Data Anticipation:

  • Investors are on edge as they await new inflation figures that could challenge the recent stock market rally, particularly after Nvidia’s (NVDA) impressive results.
  • Concerns are mounting over a potential surprise in the upcoming Thursday PCE index report, the Federal Reserve’s favored inflation measure, especially after a higher-than-expected CPI report earlier in February led to market volatility.

Economic Indicators and Corporate Results:

  • This week’s inflation report is a key focus, alongside updates on consumer and manufacturing sectors, which will provide insights into the US economy’s condition.
  • Berkshire Hathaway (BRK-B) is nearing a $1 trillion market valuation following a record annual profit, with Warren Buffett highlighting the company’s durability and acknowledging Charlie Munger’s contributions.
  • Domino’s Pizza (DPZ) shares surged 6% after announcing a dividend increase and surpassing fourth-quarter sales forecasts.
  • Coinbase (COIN) shares rose 16% as Bitcoin (BTC-USD) remained above $54,000, reflecting positive sentiment in the cryptocurrency market.

Start your CFD Shares Trading journey with VT Markets now!

Unlocking the power of correlations in forex trading

In forex trading, correlations show how different currency pairs or financial instruments move together. For example, when the EUR/USD pair goes up, the USD/CHF pair often goes down, and vice versa. 

source: investopedia

Understanding these relationships is crucial. It helps traders predict market movements, manage risks, and make smarter decisions. In this guide, we will explore correlations in forex trading and how you can use them to improve your strategies. Let’s get started! 

Understanding correlations 

Correlation in forex refers to the statistical relationship between different currency pairs or financial instruments and how they move in relation to each other. 

It is measured on a scale from -1 to +1, where -1 indicates a perfect negative correlation (inverse movement), +1 indicates a perfect positive correlation (same direction movement), and 0 indicates no correlation (movements are independent of each other). 

Correlation types
source: Simply Psychology

Understanding correlation helps traders anticipate how one asset’s movement may affect another. 

  • Positive correlation: This occurs when two currency pairs or assets tend to move in the same direction. For example, if the EUR/USD pair goes up, the GBP/USD pair also tends to rise. Traders can use positive correlations to diversify their portfolios by trading multiple currency pairs that move in tandem, potentially reducing overall risk exposure. 
  • Negative correlation: In contrast, negative correlation occurs when two currency pairs or assets move in opposite directions. For instance, when the USD/JPY pair increases, the price of Gold may decrease. Traders can use negative correlations as a hedging strategy to offset potential losses in one position with gains in another, helping to mitigate risk during market fluctuations. 
  • Neutral correlation: Neutral correlation indicates a weak or non-existent relationship between currency pairs or assets. For example, the EUR/USD and USD/CHF pairs may show little correlation, meaning their movements do not significantly influence each other. While neutral correlations may not offer direct trading opportunities, they can still provide valuable information about market dynamics and help traders avoid making decisions based on false assumptions of correlation. 
The correlation coefficient formula may seem complex, but you can use a specialised online calculator.
source: BYJU’S 

How to identify correlations 

If you’ve decided to count the correlation between two currency pairs, here’s a guide to help you get started: 

1. Select currency pairs: Choose the currency pairs you want to analyse for correlation. For example, you might want to examine the correlation between EUR/USD and GBP/USD. 

2. Collect historical data: Gather historical price data for the selected currency pairs. You can obtain this data from various sources such as trading platforms, financial websites, or specialised data providers. 

3. Calculate correlation coefficient: Use online correlation calculators, Excel spreadsheets with built-in functions like CORREL, or trading platforms such as MetaTrader 4 (MT4) and MetaTrader 5 (MT5) to compute correlation coefficients between the currency pairs. 

4. Interpret results: Analyse the correlation coefficient to understand the relationship between the currency pairs. A coefficient close to +1 indicates a strong positive correlation, while a coefficient close to -1 indicates a strong negative correlation. A coefficient close to 0 suggests a weak or no correlation. 

5. Repeat for different timeframes: Consider calculating correlations over different timeframes (e.g., daily, weekly, monthly) to identify any changes in correlation patterns over time. This can provide valuable insights into the stability of the correlation relationship. 

By following these steps, you can effectively count and interpret the correlation between currency pairs, helping you make more informed trading decisions in the forex market. 

Currency pairs correlations table
source: Pinterest

Factors affecting correlations 

Various factors influence the correlations between currency pairs in forex trading. Understanding these nuances is crucial for traders seeking to anticipate market movements and make informed trading decisions.  

  • Economic indicators:  Gross Domestic Product (GDP), growth rates, and inflation significantly shape currency correlations. Positive GDP figures in both the Eurozone and the US can strengthen the correlation between EUR/USD and USD/CHF pairs. Divergent inflation rates can weaken correlations as traders adjust their strategies based on economic forecasts. 
  • Market sentiment: Reflecting traders’ attitudes towards currencies, market sentiment impacts correlations. During periods of increased risk appetite, currencies like the Australian dollar (AUD) and New Zealand dollar (NZD) tend to exhibit positive correlations. Safe-haven currencies such as the US dollar (USD) and Japanese yen (JPY) may strengthen during times of uncertainty, thereby weakening correlations with riskier currencies. 
  • Geopolitical events: Events such as elections or trade negotiations can disrupt currency correlations. Major agreements may strengthen correlations between currencies, while heightened tensions can weaken them as traders seek refuge in safer assets. Increased geopolitical risks might diminish the correlation between USD/JPY and gold. 
  • The relationship between currencies and commodities: The interplay between currencies and commodities also influences currency correlations. For example, the Canadian dollar (CAD) often correlates positively with oil prices due to Canada’s significant oil exports. Consequently, a rise in oil prices could strengthen the correlation between USD/CAD and oil. Conversely, if gold prices surge, the correlation between USD/JPY and gold may weaken, given the status of the Japanese yen as a safe-haven currency. 
USD/CAD and oil prices positive correlation
source: Reuters

Using correlations in trading 

Leveraging correlations in forex trading provides traders with a strategic advantage, offering insights into market dynamics and aiding in risk management. By incorporating correlations into trading strategies, traders refine their approach, optimise trade timing, and enhance overall performance in the forex market. 

  • Strategy development: Design strategies to capitalise on currency correlations, identifying trends, and optimising trade timing. 
  • Risk management: Utilise correlated pairs for hedging to mitigate losses and minimise risk exposure. Additionally, diversify risk across multiple currency pairs or asset classes to reduce volatility and enhance stability. 
  • Portfolio diversification: Spread investments across various currency pairs or asset classes with low or negative correlations to minimise overall portfolio risk and enhance long-term stability. 
  • Identifying opportunities: Utilise correlations to identify diversification opportunities by selecting currency pairs with low or negative correlations. 
  • Asset class monitoring: Monitor correlations between different asset classes to optimise portfolio allocation and achieve risk-adjusted returns. 

In conclusion, knowing how currency pairs interact is vital for smart decision-making and managing risks in forex trading. Using correlation analysis is strongly recommended as it helps traders choose the best times to trade, manage risks effectively, and get the most out of their investments. 

Stocks Dip Amid Inflation Data Anticipation, Amazon Joins Dow

On Monday, the stock market experienced a downturn, with the S&P 500, Nasdaq Composite, and Dow Jones Industrial Average all closing lower, moving away from recent record highs. This shift comes as investors brace for a slew of economic data, including a crucial inflation measure and updates on consumer spending, which could impact Federal Reserve policy decisions. The market’s focus is particularly on the upcoming personal consumption expenditures price index, a preferred inflation indicator by the Fed. Additionally, Amazon’s inclusion in the Dow signifies a shift toward tech and consumer retail sectors, despite a slight dip in its shares. With Treasury yields rising and various economic indicators on the horizon, investors remain cautious amid an uncertain longer-term outlook, even as currency markets react to potential monetary policy adjustments in the U.S. and Europe.

Stock Market Updates

On Monday, the S&P 500 saw a decline, moving away from the record high it reached the previous Friday, as the market anticipated upcoming inflation data. The index fell by 0.38% to 5,069.53, while the Nasdaq Composite dropped by 0.13%, ending the day at 15,976.25. The Dow Jones Industrial Average also experienced a downturn, losing 62.30 points, or 0.16%, to close at 39,069.23. Notably, Amazon was added to the Dow, replacing Walgreens Boots Alliance, which is expected to heighten the index’s focus on the tech and consumer retail sectors, even as Amazon’s shares dipped slightly by 0.15%. Additionally, Treasury yields rose, exerting further pressure on the stock market.

The market’s recent performance has been bolstered by strong earnings from companies like Nvidia, propelling the S&P 500 and the Dow to record highs at the end of the previous week. However, investors remain cautious, looking ahead to several economic indicators due to be released, including the personal consumption expenditures price index, a key measure of inflation favored by the Federal Reserve. Meanwhile, new home sales for January fell short of expectations amid high mortgage rates, underscoring the ongoing economic challenges. This week will also see the release of data on durable orders, wholesale inventories, consumer spending, and PCE numbers, all of which could significantly influence market sentiment.

Data by Bloomberg

On Monday, the market showed a mixed performance across various sectors. While the overall sectors declined by 0.38%, Energy (+0.32%), Consumer Discretionary (+0.23%), and Information Technology (+0.03%) sectors experienced gains, indicating some areas of strength in the market. However, most sectors saw declines, with Utilities (-2.10%) and Communication Services (-2.09%) facing the steepest drops, followed by significant downturns in Real Estate (-1.14%), Materials (-0.59%), Health Care (-0.50%), and Financials (-0.46%). Industrials and Consumer Staples also saw modest declines, underscoring a generally bearish sentiment across the broader market.

Currency Market Updates

In recent currency market updates, the dollar index experienced a slight decline of 0.1%, influenced primarily by gains in the EUR/USD pair, as investors awaited crucial inflation data from both the U.S. and the eurozone. This upcoming data is expected to provide insights into the future of the narrowing gap between bund and Treasury yields observed since mid-February. The anticipation around this data release stems from its potential to either confirm or alter the current expectations regarding monetary policy adjustments by the Federal Reserve and the European Central Bank (ECB), especially in light of recent economic indicators. The dollar, meanwhile, saw an uptick against traditionally lower-yielding currencies like the yen, as well as risk-sensitive currencies such as the Australian dollar and the yuan, amidst speculations on the Federal Reserve’s interest rate decisions following a strong U.S. jobs report and inflation figures that surpassed forecasts.

Investor focus is particularly honed in on the upcoming core PCE reading, February ISMs, and the March 8 employment report, with the outcomes likely to influence Federal Reserve policy discussions significantly. Despite the current market pricing, which reflects a cautious stance on the pace and extent of Fed rate cuts, the longer-term economic outlook remains uncertain. This uncertainty is exacerbated by persistent high-interest rates and a stock market buoyed by a limited number of companies, raising concerns over potential underperformance in U.S. economic data relative to expectations. Meanwhile, in Europe, inflation data releases are poised to further clarify the ECB’s stance on interest rates, amidst statements from President Christine Lagarde indicating sustained wage growth. Additionally, Japan’s inflation figures and the potential implications for the Bank of Japan’s policy direction add another layer to the global currency market dynamics, with significant attention also being paid to the British pound’s movements against the backdrop of the Bank of England’s anticipated policy decisions.

Picks of the Day Analysis
EUR/USD (4 Hours)

EUR/USD Gains Amid Speculation of US Interest Rate Cuts and ECB’s Prudent Stance

The EUR/USD pair experienced a rebound, touching the 1.0860 mark as the new trading week began, fueled by a weakening US dollar and speculation about potential Federal Reserve interest rate cuts, possibly starting in June. This speculation has been supported by recent US inflation data and a tight labor market, increasing the odds of monetary easing. Meanwhile, European Central Bank (ECB) official Yannis Stournaras emphasized the need for cautious monetary policy adjustments, aiming for a gradual approach to rate cuts to ensure inflation targets are met. The interplay between anticipated US monetary policy adjustments and the ECB’s prudent stance is likely to continue driving EUR/USD price actions in the near term.

Chart EUR/USD by TradingView

On Monday, the EUR/USD moved higher and was able to reach the upper band of the Bollinger Bands. Currently, the price is moving just below the upper band, suggesting a potential downward movement to reach the middle band. Notably, the Relative Strength Index (RSI) maintains its position at 60, signaling a slightly bullish outlook for this currency pair.

Resistance: 1.0858, 1.0896

Support: 1.0823, 1.0783

XAU/USD (4 Hours)

XAU/USD Retreats Below $2,030 Amid Rising US Treasury Yields and Technical Pressure

Gold experienced a slight downturn, falling below the $2,030 mark during the American trading session on Monday, as it faced technical and fundamental pressures. The recovery of the 10-year US Treasury bond yields toward 4.3% contributed to the decline in the XAU/USD pair, reflecting a dampened appeal for the non-yielding asset. Technical analysis reveals a decrease in buying interest, with a potential for a bearish extension highlighted by the metal’s performance around critical simple moving averages (SMAs) and technical indicators. Meanwhile, the broader market’s cautious stance ahead of significant US economic data releases, including the closely watched US Core Personal Consumption Expenditures (PCE) Price Index, adds to the bearish sentiment surrounding gold.

Chart XAU/USD by TradingView

On Monday, XAU/USD moved lower to reach the middle band of the Bollinger Bands. Currently, the price is moving just above the middle band, suggesting a potential consolidation movement. The Relative Strength Index (RSI) stands at 55, signaling a neutral outlook for this pair.

Resistance: $2,042, $2,056

Support: $2,030, $2,017

Economic Data
CurrencyDataTime (GMT + 8)Forecast
USDDurable Goods Orders m/m21:30-4.9%
USDCB Consumer Confidence23:00114.8

Forex Market Analysis: Nvidia’s Strength Drives Record Highs; Eyes on PCE Data Amidst USD Equilibrium

CURRENCIES:
  • Market confidence surged, led by Nvidia’s strong Q1 2024 forecast.
  • Nvidia’s success propelled the S&P 500 to record highs; Japanese index topped after 34 years.
  • Gold prices climbed, and the USD sought equilibrium amidst positive market sentiments.
  • Anticipated January PCE inflation results could prompt continued USD decline and boost gold.
  • Sterling remained strong with minimal impactful data expected to affect its position.
  • The Euro’s rally against major G7 currencies may be losing momentum as the week ended.

STOCK MARKET:

Economic data: Dallas Fed Manufacturing Activity, February (-27.4 previously); New home sales, January (684,000 annualized rate expected, 664,000 previously); New home sales, month-over-month, January (+3% expected, +8% previously)

Earnings: Domino’s Pizza (DPZ), Freshpet (FRPT), Hims & Hers (HIMS), iRobot (IRBT), Workday (WDAY), Zoom (ZM)

  • Focus on new inflation data this week, particularly the PCE index reading on Thursday.
  • S&P 500 and Dow Jones both closed at record highs, with about 1% weekly gains.
  • Nasdaq Composite also up, with a 0.6% increase.
  • Upcoming inflation data could challenge recent stock market highs.
  • Consumer confidence, manufacturing updates, and earnings from Salesforce, Lowe’s, Macy’s, Okta, and Best Buy are anticipated.
  • A previous CPI report caused a market sell-off; a similar reaction might occur with the PCE inflation report.
  • Economists expect January’s “core” PCE at 2.4% annually and 0.4% monthly, signaling potential inflation concerns.
  • Market now anticipates three interest rate cuts in 2024, adjusting from previous expectations.
  • Retail sector earnings in focus, with consumer spending trends under examination.
  • Federal Reserve’s latest decision keeps interest rates unchanged.
  • Citi’s analysis suggests the market hasn’t reached “euphoria” levels yet, indicating potential for further growth.

Start your CFD Shares Trading journey with VT Markets now!

Dividend Adjustment Notice – February 26, 2024

Dear Client,

Please note that the dividends of the following products will be adjusted accordingly. Index dividends will be executed separately through a balance statement directly to your trading account, and the comment will be in the following format “Div & Product Name & Net Volume ”.

Please refer to the table below for more details:

The above data is for reference only, please refer to the MT4/MT5 software for specific data.

If you’d like more information, please don’t hesitate to contact [email protected].

Week ahead: RBNZ rate, US economic indicators eyed

As we approach the end of February 2024, the financial world turns its focus towards a series of crucial economic updates slated for release. These reports, spanning from Japan’s inflation rates to the ISM Manufacturing PMI in the United States, are poised to provide fresh insights into the global economic landscape. Among these, the Reserve Bank of New Zealand’s rate statement stands out as a particularly significant event. Here’s what to expect in the week ahead:

February 27, 2024: Japan’s inflation rate 

The annual inflation rate in Japan has seen a decrease, landing at 2.6% in December 2023, down from 2.8% the previous month. This marks the lowest inflation rate since July 2022. Analysts are now eyeing a further drop to 2.1% for January 2024, with the data expected to be unveiled on 27 February. This anticipated decrease could signal easing inflationary pressures within the Japanese economy, offering a glimpse into the country’s current economic health.

February 27, 2024: US durable goods orders

In the United States, new orders for manufactured durable goods showed no significant change in December 2023, a stark contrast to the 5.5% rise observed in November. The forecast for January 2024 is less optimistic, with analysts predicting a 4.5% decline. Set to be released on 27 February, this data could reflect the changing dynamics in U.S. manufacturing and consumer confidence.

February 28, 2024: Australia’s CPI 

Australia’s Consumer Price Index (CPI), a key indicator of inflation, increased by 3.4% in the year to December 2023, a slowdown from the 4.3% climb seen in November. Projections suggest a slight easing to 3.2% for January 2024, with the figures due on 28 February. A moderation in CPI growth may indicate that inflationary pressures are beginning to stabilise in Australia.

February 28, 2024: Reserve Bank of New Zealand’s rate decision

The Reserve Bank of New Zealand (RBNZ) previously held its official cash rate (OCR) steady at 5.5% during its November meeting. This pause, consistent for the fourth consecutive time, met market expectations. Analysts widely anticipate that the RBNZ will maintain the OCR at 5.5% in its upcoming 28 February meeting. The decision is keenly awaited, as it could signal the central bank’s outlook on New Zealand’s economic conditions and inflationary trends.

February 29, 2024: Canada’s GDP 

Canada’s GDP growth for November exceeded expectations, registering a 0.2% increase. This improvement followed three months of stagnant growth. The forecast for December 2023 points to a further rise of 0.3%, with the announcement scheduled for 29 February. A consecutive growth increment would signify a strengthening in the Canadian economy’s recovery momentum.

February 29, 2024: US core PCE price index

The core PCE price index in the US, an important measure of inflation that excludes food and energy costs, experienced a slight uptick of 0.2% in December 2023. Analysts are now expecting a more pronounced increase of 0.4% for January 2024, with data due on 29 February. This anticipated growth could reflect persisting inflationary pressures within the core sectors of the U.S. economy.

March 1, 2024: US ISM manufacturing PMI

The ISM Manufacturing PMI in the United States showed signs of improvement in January 2024, reaching 49.1 from 47.1 in December, marking the highest level since October 2022. The forecast for February remains optimistic, with analysts predicting the index to hold at 49.1. The upcoming release on 1 March will be closely watched as an indicator of the health and direction of the U.S. manufacturing sector.

Forex Market Analysis: USD Strength Precedes Core PCE Data Amid Nvidia’s Record Highs

CURRENCIES:

U.S. Dollar Maintains Strong Position: The USD continues to show a strong upward trend; focus is on EUR/USD, GBP/USD, and gold prices.

Date and Analyst: Article written by Diego Colman, Contributing Strategist, on February 23, 2024.

Anticipation for Core PCE Data: Markets are on alert for the upcoming U.S. core PCE data release, a key inflation indicator favored by the Fed.

Potential Market Volatility: The upcoming economic event may cause significant fluctuations in the FX market, requiring traders to stay alert.

Core PCE Projections: Expectations suggest a 0.4% rise in core PCE for January, potentially lowering the annual rate to 2.7% from 2.9%.

Inflation and Economy Dynamics: Recent CPI and PPI reports indicate potential for higher than expected inflation rates.

Fed’s Response to Inflation: Persistent inflation and strong labor market data might postpone the Fed’s easing cycle, possibly tilting rate expectations higher.

Interest Rates and U.S. Dollar: Prolonged higher interest rates could increase U.S. Treasury yields, potentially boosting the dollar’s upward momentum.

Impact on Currency Pairs and Gold: A strong dollar could hinder gains in EUR/USD and GBP/USD pairs, as well as pressure gold prices.

Technical Analysis Ahead: The article will next delve into the technical analysis for EUR/USD, GBP/USD, and gold prices, highlighting important price levels for traders.

STOCK MARKET:

Nvidia’s Earnings Drive Markets: Nvidia’s significant earnings report spurred markets to all-time highs across the US, Europe, and Japan.

Record Market Capitalization: Nvidia’s market cap surged by $277 billion in a single session, marking the largest increase ever.

Sustainability of the Tech Rally: Questions arise about the tech rally’s longevity and its potential spread to other sectors.

AI’s Role in Growth: UBS Global Wealth Management highlights generative AI as a key growth theme, driving Nvidia’s success and potential market broadening.

European Market Movements: The Stoxx Europe 600 index hits a record, driven by gains in the mining sector and positive corporate earnings.

Megacap Influence in Europe: A few large companies significantly contribute to the Stoxx 600’s performance, mirroring US market concentration risks.

Global Equity Outlook: Citigroup strategists predict a broadening of global equity returns beyond a narrow first quarter.

Asian Market Trends: Continued gains in China’s CSI 300 and steady performance in other Asian markets, despite Japan’s holiday closure.

Fed’s Interest Rate Strategy: Hawkish comments from Fed officials suggest rate cuts are on the horizon, but not imminent.

Commodity Market Updates: Mixed movements in oil, gold, and metals, with iron ore experiencing a notable weekly drop.

Start your CFD Shares Trading journey with VT Markets now!

Dividend Adjustment Notice – February 23, 2024

Dear Client,

Please note that the dividends of the following products will be adjusted accordingly. Index dividends will be executed separately through a balance statement directly to your trading account, and the comment will be in the following format “Div & Product Name & Net Volume ”.

Please refer to the table below for more details:

The above data is for reference only, please refer to the MT4/MT5 software for specific data.

If you’d like more information, please don’t hesitate to contact [email protected].

Back To Top
server

Hello there 👋

How can I help you?

Chat with our team instantly

Live Chat

Start a live conversation through...

  • Telegram
    hold On hold
  • Coming Soon...

Hello there 👋

How can I help you?

telegram

Scan the QR code with your smartphone to start a chat with us, or click here.

Don’t have the Telegram App or Desktop installed? Use Web Telegram instead.

QR code