US officials said President Donald Trump told aides to plan for a prolonged blockade of Iran, according to a Wall Street Journal report on Wednesday.
The report said the plan aimed to put pressure on Iran’s economy and oil exports by stopping shipping to and from Iranian ports.
Blockade Strategy And Market Implications
It also said Trump viewed other options, including resuming bombing or leaving the conflict, as riskier than continuing the blockade.
In market moves, West Texas Intermediate (WTI) was up 1.08% at $96.50 at the time of writing.
With news of a potential extended blockade on Iran, we should anticipate sustained upward pressure on crude oil prices. The market’s immediate jump to $96.50 for WTI signals that a supply disruption is being priced in. Traders should therefore be positioning for higher prices and increased volatility in the coming weeks.
This geopolitical tension significantly tightens an already delicate supply balance, as Iran’s seaborne exports were averaging around 1.4 million barrels per day this quarter. Recent data from the U.S. Energy Information Administration (EIA) already showed global inventories drawing down, making the loss of Iranian barrels particularly impactful. This fundamental tightness supports a bullish outlook on energy derivatives.
Options Positioning And Cross Sector Hedges
In this environment, buying call options on WTI and Brent crude futures is the most direct strategy. We are already seeing implied volatility on near-term options surge, with the CBOE Crude Oil Volatility Index (OVX) jumping over 12% to 44. This indicates that the market expects large price swings, making long options positions attractive.
Looking back from our 2025 perspective, we saw a similar dynamic unfold during the initial phase of the Ukraine conflict in 2022. Brent crude rapidly spiked above $120 a barrel on supply fears, creating immense opportunities for those holding long call positions. While the scale may differ, the underlying market psychology of a major supply shock is the same.
Beyond crude itself, we should consider the ripple effects across other sectors. Bullish positions can be taken on energy company ETFs through call options, as these firms benefit directly from higher oil prices. Conversely, rising fuel costs will hurt the transport sector, making put options on airline and shipping indices a viable hedge or speculative play.
RBNZ Governor Anna Breman said first-quarter core inflation measures were stable within the 1–3% target band.
She said the Monetary Policy Committee is monitoring developments in the Middle East and new economic data.
Rbnz Signals Rates Have Peaked
At the time of writing, NZD/USD was down 0.27% on the day at 0.5870.
We see the Reserve Bank of New Zealand’s latest comments as confirming that interest rates have peaked. With Q1 core inflation now reported at 2.8%, sitting comfortably within the target band, the case for any further rate hikes is gone. This solidifies our view that the Official Cash Rate, which has been held at 5.50% for over a year, is not going higher.
For derivative traders, this signals a period of lower implied volatility for the New Zealand dollar in the coming weeks. A central bank that is firmly on hold suggests the NZD/USD will trade in a more defined range, making strategies like selling strangles on the currency pair attractive. We will be watching for the next major data release, like the upcoming jobs report, as the most likely catalyst to break this expected calm.
Nzdusd Strategy And Outlook
The path of least resistance for the Kiwi dollar appears to be downwards against the US dollar. This dovish RBNZ stance contrasts with the US Federal Reserve, which is still struggling with slightly more persistent inflation, creating a policy divergence that favours holding US dollars. We would therefore use any rallies in NZD/USD towards the 0.6000 psychological level as an opportunity to establish short positions.
Looking back at the economic environment of 2025, the current stability marks a significant change for our trading approach. We recall the persistent inflation above 3.5% that year, which kept the market constantly pricing in the risk of another rate hike. That aggressive hiking cycle now seems firmly over, meaning our focus must shift from hedging against hikes to positioning for eventual cuts later in the year.
GBP/USD edged up to about 1.3520 in Asian trading on Wednesday after small losses the day before. The daily chart shows the pair near the lower edge of an ascending channel, which can point to a bearish reversal risk.
The pair remains slightly biased higher while it stays above the nine-day EMA and the 50-day EMA. The 14-day RSI is near 56, suggesting upward momentum that is not stretched.
Key Technical Levels
If it moves higher, resistance sits at 1.3599, the two-month high set on 17 April. Beyond that, the upper channel area is near 1.3869, with that level last seen in September 2021 and reached on 27 January.
On the downside, price is testing support near 1.3510, close to the nine-day EMA at 1.3509. Further support is at the 50-day EMA at 1.3440.
A break below this support area could open 1.3159, the five-month low from 31 March, and then 1.3010. The 1.3010 level is the lowest since April 2025 and was recorded in November 2025.
The technical analysis was produced with the help of an AI tool.
Strategy Considerations
We see the GBP/USD pair is at a critical decision point around 1.3520, testing the lower boundary of its ascending channel. While the moving averages suggest underlying strength, a break below this 1.3510 level would signal a significant bearish reversal. This setup presents a clear conflict between medium-term bullish momentum and a potential short-term breakdown.
This technical tension is amplified by recent economic data, which offers conflicting signals for both currencies. The latest UK Consumer Price Index reading for March 2026 came in slightly above expectations at 2.3%, suggesting the Bank of England may have to delay any potential rate cuts. However, UK retail sales for the same month unexpectedly fell by 0.5%, raising concerns about the health of the consumer.
On the other side of the pair, recent US Non-Farm Payrolls showed job growth slowing more than anticipated, which would typically weaken the dollar. Yet, Federal Reserve officials continue to stress that inflation remains their primary focus, pushing back against market hopes for imminent easing. This divergence between slowing growth and hawkish policy talk creates uncertainty for the dollar’s direction.
Given this uncertainty, a good strategy for the coming weeks could be to buy volatility. We could consider a long strangle, purchasing an out-of-the-money put option with a strike below 1.3500 and an out-of-the-money call option with a strike above 1.3600. This position would profit from a significant price move in either direction, which seems likely given the coiled-up technical and fundamental picture.
For those with a more bullish conviction, a bull call spread would be a capital-efficient way to play for a bounce from the channel support. One could buy a call option with a 1.3550 strike and simultaneously sell a call with a 1.3750 strike to finance the position. This strategy would capitalize on a move back toward the top of the channel near 1.3869 while defining risk.
Conversely, if we expect the channel support to break, a bear put spread is warranted. We could buy a put at the 1.3500 strike and sell a put with a 1.3300 strike. This would position us for a move toward the 50-day EMA at 1.3440 or even the March low of 1.3159, a level not seen since we looked back to the lows of late 2025.
AUD/JPY fell to about 114.50 in early Asian trade on Wednesday, with the Australian Dollar weakening against the Japanese Yen after Australia’s inflation release. Markets are also watching Japan’s Tokyo CPI data due on Friday.
Australia’s CPI rose to 4.6% year on year in March, up from 3.7% in February, and was linked to higher fuel costs tied to the Middle East conflict. The result was below the 4.7% forecast, while monthly CPI increased 1.1% in March after 0% previously.
Australian Inflation Weighs On The Aud
The lower-than-expected CPI added near-term pressure on the AUD. Expectations for a Reserve Bank of Australia rate rise in May remain in place, supported by a tight labour market and firmer growth in late 2025.
In Japan, the Bank of Japan kept its short-term interest rate unchanged at 0.75% after its two-day meeting on Tuesday. The BoJ said it will raise rates based on developments in the economy, prices, and financial markets, and noted that wages and prices may rise more than the output gap implies.
The central bank said it will assess the timing and pace of policy changes while monitoring the economic and price effects of Middle East war developments.
Looking back to this time in 2025, we saw Australian inflation at 4.6% and the Bank of Japan’s rate at 0.75%, with AUD/JPY near 114.50. This setup created expectations for a rate hike from the Reserve Bank of Australia, which it delivered in mid-2025. The economic landscape has shifted significantly over the past year.
Monetary Policy Divergence Drives The Cross
The RBA’s hikes through 2025 have successfully cooled the economy, with the latest Q1 2026 CPI data released last week showing inflation has fallen to 3.1%. As a result, market pricing now implies a greater than 70% chance of an RBA rate cut by the third quarter of this year. This policy pivot is putting sustained downward pressure on the Australian dollar.
Conversely, Japan’s situation has evolved as the Bank of Japan had signaled. Following the strongest “Shunto” spring wage negotiations in 30 years, which secured an average 4.5% pay increase, the BoJ has hiked its policy rate twice to its current 1.25%. This monetary policy divergence between a dovish RBA and a hawkish BoJ has pushed the AUD/JPY cross down to the 108.20 level we see today.
For derivatives traders, this clear divergence suggests positioning for further downside in AUD/JPY. Buying put options with a three-month expiry and a strike price around 107.00 could be an effective strategy to capitalize on this trend while capping potential losses. We have seen one-month implied volatility on the pair rise from 9% to 12.5% recently, indicating the market is bracing for bigger moves.
In the coming weeks, we must watch for any forward guidance from the RBA that suggests a faster cutting cycle. Additionally, the Bank of Japan’s upcoming Tankan survey will be critical for gauging business sentiment in the face of higher rates. Any surprisingly weak data from Australia or strong data from Japan would serve as a catalyst to add to bearish positions.
Australia’s quarterly Consumer Price Index rose 1.4% quarter-on-quarter in the first quarter. This matched forecasts.
The result indicates consumer prices increased at the expected pace over the quarter. No additional CPI figures or breakdowns were provided in the update.
Inflation Still Not Easing
The first quarter inflation number came in at 1.4%, right where we thought it would be. While this wasn’t a shock, it confirms that price pressures are not fading quickly enough. This result solidifies the view that inflation remains stubbornly high, with the annual rate now tracking near 5.5%, far above the Reserve Bank of Australia’s target.
This puts the Reserve Bank of Australia in a difficult position, making any talk of interest rate cuts in the near future highly unlikely. We saw them pause their hiking cycle last year in 2025 when the cash rate hit 4.35%, but this persistent inflation will keep them on high alert. Therefore, the market is now pricing in a ‘higher for longer’ scenario for the rest of the year.
For traders in interest rate markets, this means the probability of rate cuts in the next six months has been significantly reduced. Selling ASX 30 Day Interbank Cash Rate Futures contracts for the second half of the year could be a viable strategy, betting that the central bank will not ease policy. Alternatively, call options on three-year bond futures could also gain, as yields are likely to remain elevated.
The Australian dollar is likely to find support from this data, as higher interest rates attract foreign investment. With Australia’s terms of trade remaining strong, as they were for much of 2025, a firm interest rate outlook provides a solid floor for the currency. Derivative plays could involve buying AUD/USD call options to profit from potential upside, or selling out-of-the-money puts.
Equities Volatility Outlook
This environment creates headwinds for the stock market, as high borrowing costs can squeeze company profits. We saw how sensitive the ASX 200 was to rate hike news throughout 2025, with growth and tech sectors suffering the most. Traders may consider buying put options on the XJO index as a hedge against a potential market downturn in the coming weeks.
Because the inflation figure was not a surprise, immediate market volatility has likely peaked. However, the underlying tension remains, meaning any upcoming data on employment or retail sales will be scrutinized intensely. This suggests that using options strategies to bet on a future spike in volatility, perhaps ahead of the next RBA meeting, could be advantageous.
Australia’s quarterly Consumer Price Index rose 4.1% year on year in the first quarter. This matched market forecasts of 4.1%.
The release confirms that annual inflation held at 4.1% in 1Q. No other CPI details were provided in the update.
Market Reaction And Volatility
With the quarterly inflation number landing exactly on forecast at 4.1%, the element of surprise has been removed from the market for now. This means we should expect a drop in implied volatility on Australian assets. Traders who were holding long volatility positions into the announcement should consider taking profits.
This reading, while not an upside shock, confirms that inflation remains stubbornly above the Reserve Bank of Australia’s 2-3% target band. We believe this kills any lingering hope for an interest rate cut in the first half of 2026. The market should continue to price in a “higher for longer” interest rate environment from the RBA.
Looking at the swaps market, we see traders have already responded by pushing the odds of a rate cut before September 2026 down to less than 15%, a sharp drop from the 40% chance priced in just last month. This policy outlook should provide a solid floor for the Australian dollar. We see value in buying AUD/USD call options with expirations in the third quarter.
This situation reminds us of the inflation reports from early 2025, where consistently high readings delayed the RBA’s expected pivot and led to weakness in the stock market. The ASX 200 fell by over 4% in the month following a similar inflation print back in February 2025. Consequently, buying put options on the ASX 200 could serve as a useful hedge against a similar reaction this time.
Rates Strategy And Range Trading
Given the clarity provided by the in-line data, the path for the RBA is now more predictable until their next meeting. This suggests a period of range-bound trading may be ahead for interest rate-sensitive instruments. Selling options premium through strategies like iron condors on Australian 10-year bond futures could be effective in the coming weeks.
Australia’s CPI rose 4.6% year-on-year in March, up from 3.7% previously, according to the Australian Bureau of Statistics. Forecasts had pointed to 4.7%.
The RBA trimmed mean CPI increased 0.3% on the month and 3.3% on the year. The monthly CPI rose 1.1% in March, after 0% in the prior reading.
Australian Dollar Reaction
After the release, AUD/USD was down 0.15% on the day at 0.7170. Earlier, the pair had been trading lower ahead of the data.
Before publication, markets expected CPI to rise 4.7% year-on-year in March, following 3.7% in February. The CPI tracks price changes in a broad basket of household goods and services, with monthly readings used following a methodology change starting from April 2024 data.
Technical levels cited included resistance at 0.7200, 0.7222, and 0.7283. Support levels referenced were 0.7131, 0.7100, and 0.6980.
The Reserve Bank of Australia sets interest rates and monetary policy, with a 2–3% inflation target, through 11 scheduled meetings each year and emergency meetings when needed. It can also use quantitative easing and quantitative tightening, which tend to weaken and strengthen the Australian Dollar, respectively.
Market Volatility Outlook
Looking back to March 2025, we saw the Consumer Price Index accelerate to 4.6%, a significant jump from the month prior. While this figure came in just shy of the 4.7% market consensus, it was a clear signal that inflation was re-igniting. This unexpected pressure forced the Reserve Bank of Australia into a more aggressive, hawkish stance throughout the remainder of that year.
Now, in late April 2026, the landscape has changed due to those subsequent rate hikes, which pushed the cash rate to a restrictive 4.75% by late 2025. The most recent data from earlier this month showed annual inflation has successfully cooled to 3.1%, much closer to the RBA’s target range. However, this has come at the cost of economic momentum, with unemployment ticking up to 4.2% and the last quarter’s GDP growth reported at a sluggish 0.2%.
This situation creates significant uncertainty around the timing of the RBA’s first potential rate cut, creating a prime environment for volatility plays. We see implied volatility on Australian dollar options as being relatively inexpensive, especially around key data releases and upcoming RBA meetings. Traders should consider long volatility strategies, such as buying straddles or strangles on AUD/USD futures, to capitalize on potential price swings regardless of the direction.
We are also observing a potential policy divergence with the US Federal Reserve, which appears positioned to hold its rates steady for longer due to more resilient economic data stateside. This sets up opportunities in the interest rate futures market, specifically by positioning for a narrowing of the yield spread between Australian and US government bonds. This suggests that while the AUD may see short-term volatility, its upside could be capped against the dollar until the RBA’s easing path becomes clearer.
WTI rose for a third day, trading near $96.90 per barrel during Asian hours on Wednesday. Prices increased as supply worries grew after US–Iran talks stalled and the Strait of Hormuz stayed effectively closed.
US President Donald Trump said Iran had asked the US to lift its naval blockade of the Strait while negotiations continue. The closure has stopped about 20% of global oil shipments.
Supply Risks Intensify
The US added further pressure on Iran, including possible sanctions on Chinese refiners linked to Tehran. It also considered measures against countries paying transit fees to pass through Hormuz.
The UAE is due to leave OPEC on 1 May, Reuters reported on Tuesday. The report linked the move to the Iran conflict and growing divisions among Gulf states.
US Treasury Secretary Scott Bessent said storage at Kharg Island was close to full, costing Iran about $170mn per day in lost revenue. He said the Treasury had sanctioned much of Iran’s shadow tanker fleet and warned that buyers of Iranian oil could be shut out of the US banking system.
With West Texas Intermediate crude pushing towards $97, we see the immediate path for oil prices as sharply upward. The effective closure of the Strait of Hormuz has taken roughly 21 million barrels per day, or 20% of global supply, off the market for the time being. This major disruption means traders should anticipate continued price gains and position accordingly.
Volatility And Positioning
The immense uncertainty surrounding the US-Iran conflict and the UAE’s upcoming OPEC exit points to extreme market volatility. We expect the CBOE Crude Oil Volatility Index (OVX) to trade at multi-year highs, similar to the spikes seen during the 2022 supply shock. Buying call options on WTI and Brent futures for June and July 2026 expiration is a primary strategy to capture this expected upward momentum.
Historically, geopolitical supply shocks cause rapid price escalations, as we witnessed back in 2022 when Brent crude jumped from $90 to over $120 in less than a month. The current Hormuz situation is a more direct and significant disruption to physical supply. Therefore, it is not unreasonable to see prices test the $120 level again before the end of the second quarter.
We also anticipate a significant widening of the price spread between Brent and WTI crude. The supply crisis is centered on Middle Eastern oil, which is benchmarked to Brent, making it more sensitive to the immediate shortages. The UAE’s official departure from OPEC on May 1st is a key date to watch, as it will likely inject further instability and bullish sentiment into the market.
Unlike in past crises, government intervention options appear limited, strengthening the case for higher prices. The US Strategic Petroleum Reserve currently holds around 365 million barrels, near a 40-year low, leaving little capacity to soften the blow of a prolonged outage. This limited buffer, combined with sanctions constricting Iran’s shadow fleet, suggests the supply squeeze will not be resolved quickly.
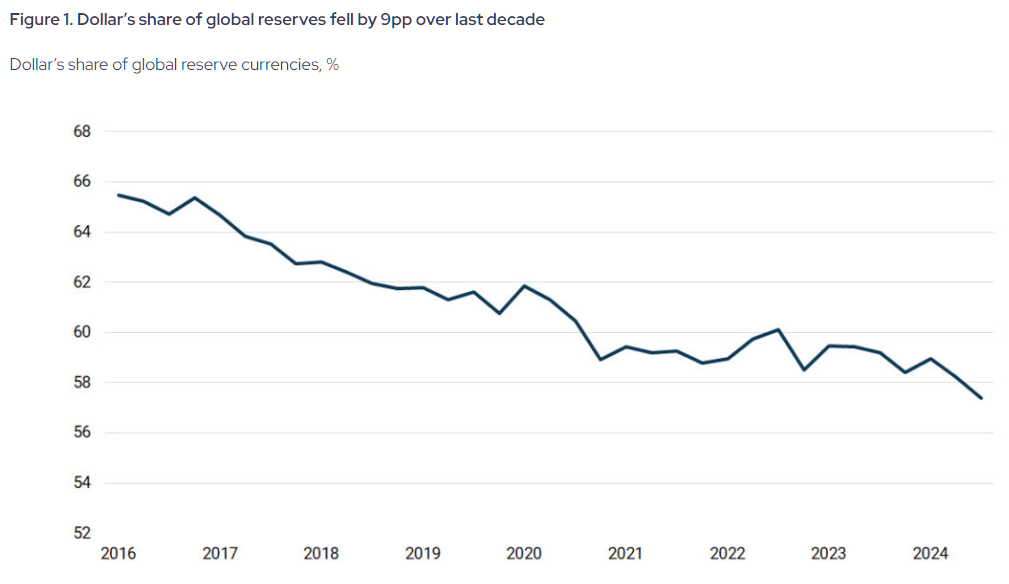
The U.S. dollar’s share of global foreign exchange reserves has declined from a 2001 peak of 72% to 57.8% by the end of 2024.
Dedollarisation is currently rated a 4 out of 10 in terms of severity, signifying a structural trend that is accelerating but not yet a crisis.
Central banks have significantly increased gold holdings, purchasing over 1,000 tonnes annually between 2022 and 2024.
The Exorbitant Privilege Is Shrinking But is America Done?
For the better part of eighty years, the United States has enjoyed something no other country in modern history has possessed. It could print money the world was forced to accept. It could borrow at rates no other sovereign could match. It could run deficits that would bankrupt any other nation and wake up the next morning with the global financial system still running on its terms. The French called it an exorbitant privilege. The rest of the world simply lived with it.
The privilege is not ending. It is eroding, slowly but structurally, and that distinction is what markets are beginning to price.
Understanding Dedollarisation: The 3-Part Monopoly
Dedollarisation is not a single event. It is a process, the slow unwinding of the dollar’s three-part monopoly over global finance. The dollar is simultaneously the world’s primary reserve currency held by central banks, the dominant currency for settling international trade, especially in oil and commodities, and the default unit of account for sovereign debt markets. Dedollarisation means chipping away at all three, not necessarily replacing the dollar with one alternative, but diluting its exclusivity across dozens of smaller shifts happening simultaneously.
It is important to be clear about what dedollarisation is not. It is not a conspiracy. It is not a clean break. It is not imminent. It is a long structural shift that has been building for two decades and is now accelerating due to decisions made in Washington itself.
Why It Is Happening
The single most consequential accelerant was the freezing of Russia’s foreign exchange reserves in February 2022 following the invasion of Ukraine. In one decision, the United States demonstrated to every government on earth that dollar assets held abroad could be immobilised by Washington at will. Russia’s own dollar holdings collapsed from 41.5% of reserves before the sanctions to just 13 to 18% by late 2024. The message was received far beyond Moscow.
Asset Class
Jan 2022 (Pre-Sanctions)
Jan 2025 (Adjustment)
Jan 2026 (Current)
Total Reserves
~$630 Billion
~$609 Billion
$769.1 Billion (Record High)
Gold Share
21.50%
~26%
~43.0%
US Dollar
20.90%
< 5% (Active)
~0% (Active)
Euro
32.10%
~10% (Active)
~0% (Active)
Chinese Yuan
17.10%
~30%
~32-35%
What followed was a layered response. By January 2025, Russia and Iran had effectively completed their own bilateral exit from the dollar, with over 95% of trade between the two countries settled in rubles and rials. China’s Cross-Border Interbank Payment System, known as CIPS, processed roughly 180 trillion yuan in transactions in 2025, equivalent to about USD25–26 trillion, providing a growing settlement alternative alongside the dollar-dominated SWIFT network.
Central banks globally purchased over 1,000 tonnes of gold annually from 2022 through 2024, more than double the average of the previous decade. In 2025, they added another 863 tonnes, reinforcing the shift toward reserve diversification. The IMF’s own data shows the dollar’s share of global foreign exchange reserves fell from a peak of 72% in 2001 to 57.8% by the end of 2024.
While most of these shifts are gradual and institutional, recent geopolitical developments have begun to operationalise these alternatives in real-world trade flows.
The Petrodollar Under Threat: The Strait of Hormuz Tolls
During the war, Iran’s Islamic Revolutionary Guard Corps began charging oil tankers and LNG carriers up to two million dollars per vessel to transit the strait, demanding payment not in dollars, but in Bitcoin, USDT, or Chinese yuan routed through Kunlun Bank via CIPS. Iran’s parliament was reported to have codified this under the Strait of Hormuz Management Plan on March 30, 2026. At current traffic volumes of roughly 21 million barrels of oil passing through the strait daily, estimates place the toll revenue at USD600 to USD800 million per month. The dollar was not just bypassed. It was explicitly excluded.
This is not an isolated provocation. It is the most visible deployment yet of infrastructure that has been quietly scaling for years, a state using crypto and yuan payment rails as a sovereign revenue mechanism at the world’s most critical oil chokepoint. The Houthis in Yemen set an earlier template by charging vessels in the Red Sea. Iran has taken it further, and in doing so has demonstrated that the petrodollar system, the 1973 arrangement that made dollar settlement the price of admission to global energy markets, is no longer the only game in town.
President Trump said the US Navy would blockade the Strait of Hormuz and interdict every vessel in international waters that paid a toll to Iran after peace talks failed https://t.co/tpzNOS3iWfpic.twitter.com/fHJJOt6KUT
What Happens to the US if Dedollarisation Continues
The dollar’s reserve status is not just a theory. It is a key part of U.S. power. Since global trade relies on dollars, there is steady demand for U.S. currency and assets even when the domestic economy is weak. This demand lets the government borrow at lower costs, run deficits without immediate pressure, and fund spending beyond what taxes alone could cover.
If that foundation weakens, the effects build up quickly. Without steady foreign demand for U.S. Treasuries, interest rates rise across the economy, increasing the cost of mortgages, business loans, and government borrowing at the same time. A weaker reserve role also puts pressure on the dollar, making imports more expensive and adding to inflation. Most importantly, the U.S. loses some of its financial influence, since sanctions are effective mainly because the dollar is widely used. If real alternatives to the dollar emerge, that influence becomes less powerful.
Businesses working with Iranian airlines risk US sanctions, Treasury Secretary Scott Bessent said, calling the warning a part of a campaign to put economic pressure on Tehran amid the US-Israeli war on Iran https://t.co/8kFQ0EqRr2
Despite these developments, the scale of the dollar’s dominance remains overwhelming. On a scale of one to ten where ten is bad, dedollarisation today sits at roughly four. Real, structural, and accelerating, but nowhere near a crisis.
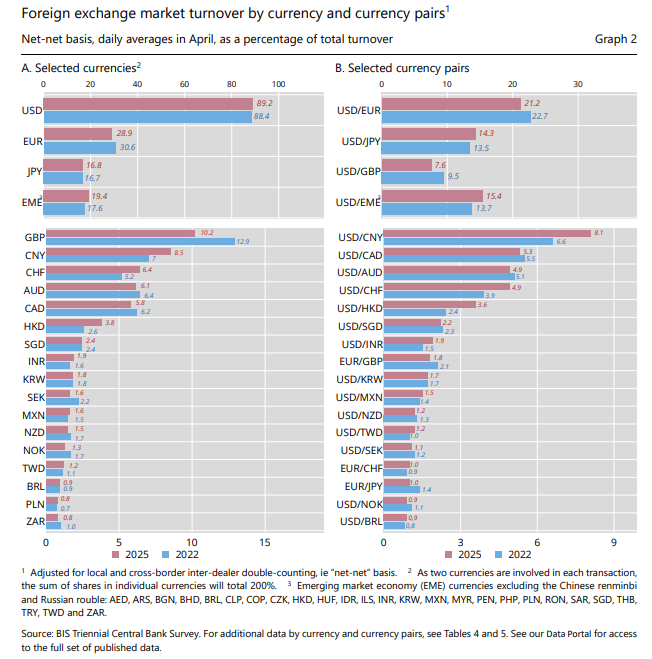
Data shows the dollar is still firmly dominant. The BIS 2025 Triennial Survey found it was involved in about 89% of all global foreign exchange trades, slightly higher than in 2022. At the BRICS summit in Rio, leaders did not even mention dedollarisation, and India stated clearly that it has no plan to replace the dollar, calling it a source of global stability. Meanwhile, China’s yuan is still limited by capital controls. In reality, no other currency or system is ready to take over the dollar’s global role anytime soon.
The score is a four and not a two because the trend is real and the infrastructure being built, CIPS, mBridge, BRICS Pay, digital yuan, local currency swap agreements, is not going away. It is a four and not a six because the dollar’s institutional moat remains enormous and no rival is close to bridging it. Yet this is where the story becomes counterintuitive.
The Investment Paradox: Why the World is Buying America While Fleeing the Dollar
Here is the number that stops every dedollarisation argument in its tracks. In 2025, foreign investors purchased a record $1.55 trillion in US financial assets according to the Treasury Department. They now hold $21 trillion in US equities, an all-time high. The number of days in 2026 where US stocks, the dollar, and bonds all declined simultaneously has fallen to just nine, on track for the lowest annual reading in eleven years. By comparison, the 1990s saw 30 to 60 such days per year.
The world is not fleeing America. It is buying America.
The explanation is that dedollarisation and investing in US markets are not contradictions. They are parallel rational strategies. Governments diversify away from holding dollar reserves issued and controlled by Washington while simultaneously wanting ownership of the most innovative, profitable companies on earth. US equities are not a dollar bet. They are a bet on American corporate earnings, American innovation, and American institutional depth. Until a rival market offers comparable liquidity, legal protection, and returns, capital will keep flowing in even as reserve managers quietly rebalance elsewhere.
The S&P 500 and Nasdaq hit record closing highs, bolstered by optimism for possible negotiations between the US and Iran to end the war and a surge in Intel shares that extended the rally in semiconductor stocks https://t.co/rZ2obcfCs6pic.twitter.com/Reh06DEhai
The world is hedging the dollar institutionally while still trusting America commercially. That distinction matters enormously.
The Choice Facing America
The United States has two paths available to it. The first is pressure. It can threaten high tariffs on countries trying to move away from the dollar. This shows strength, but it can also backfire. If countries are already worried about the U.S. using the dollar as a weapon, more pressure will not stop them. It will push them to find alternatives faster.
The second choice is harder, but more effective in the long run. The U.S. needs to make the dollar trustworthy again. That means managing its finances responsibly, using sanctions carefully, keeping markets open, and staying involved in building the future of global payment systems instead of leaving it to China.
In the end, the dollar’s strength does not come from force. It comes from trust. Investors, governments, and institutions around the world hold dollars because they believe the U.S. will keep its word, act fairly, and remain a strong economy.
That trust is now being tested. The advantage the U.S. has enjoyed is slowly shrinking. Whether it continues or fades depends on whether the U.S. remembers that the dollar is not just money.
It is a promise, and that promise needs to be protected.
The Big Questions
1) Is the U.S. dollar losing its status as the world’s primary reserve currency?
The dollar is undergoing structural erosion rather than an imminent collapse. While its share of global foreign exchange reserves has fallen from 72% in 2001 to 56.77% by the end of 2025, it remains the world’s most utilised currency, involved in nearly 9 out of every 10 foreign exchange trades.
2) What are the primary drivers of dedollarisation in 2026?
The shift is largely fueled by the 2022 freezing of Russian foreign exchange reserves, which demonstrated that Washington can immobilise dollar assets at will. This has led nations to seek alternative payment rails like China’s CIPS and increase annual gold purchases to over 1,000 tonnes.
3) What is the investment paradox mentioned in recent market data?
The paradox describes a trend where global governments diversify away from dollar reserves while simultaneously increasing their ownership of U.S. commercial assets. In 2025, foreign investors held a record $21 trillion in the U.S. equities, signalling that they trust American innovation even as they hedge against the currency’s political risks.
4) How does the Strait of Hormuz impact the petrodollar system?
The petrodollar arrangement is no longer the exclusive system for energy trade since Iran began charging tankers up to $2 million in Bitcoin, USDT, or yuan for transit through the strait. This represents a visible deployment of non-dollar infrastructure at a critical global oil chokepoint.
5) How dominant is the U.S. dollar in global foreign exchange today?
Despite the rise of alternatives, the dollar remains overwhelmingly dominant and was involved in approximately 89% of all global foreign exchange trades according to 2025 data.
6) What are the economic risks to the United States if dedollarisation continues?
A significant weakening of the dollar’s reserve role would lead to higher domestic interest rates, increased costs for government borrowing, and higher inflation as imports become more expensive. Furthermore, the effectiveness of U.S. Financial sanctions would diminish as global trade moves to alternative systems.
7) Are other nations ready to replace the dollar?
Currently, no other currency or system is prepared to fully assume the dollar’s global role. Major economies like India continue to view the dollar as a source of global stability and have stated they have no plans to replace it.
Start trading now – Click here to create your real VT Markets account
Written on April 29, 2026 at 6:17 am, by josephine
US President Donald Trump said Iran asked the US to lift a naval blockade of the Strait of Hormuz during talks aimed at ending a two-month conflict, Bloomberg reported on Tuesday.
In a Truth Social post on Tuesday, Trump said Iran wants the oil and gas shipping route open “as soon as possible”, while it works on its leadership situation.
Strait Of Hormuz Talks
CNN reported on Tuesday that mediators in Pakistan expect Iran to submit a revised proposal to end the war in the next few days, citing sources close to the mediation process.
At the time of writing, West Texas Intermediate (WTI) was up 2.15% on the day at $97.00.
We are seeing oil hold at $97 a barrel despite talk of de-escalation, which suggests the market remains highly skeptical of a swift resolution. This tension is keeping implied volatility elevated, with the Cboe Crude Oil Volatility Index (OVX) hovering near 55, a level indicating significant uncertainty. This environment makes selling options premium attractive, but carries substantial risk if talks collapse.
For traders who believe a diplomatic failure is more likely, holding exposure through call options remains a viable strategy. The physical market is still severely constrained by the blockade of the Strait of Hormuz, which disrupts the flow of nearly 21 million barrels per day. Any negative development from the mediation in Pakistan could easily send prices back above the $100 mark.
Options Strategies For Traders
Conversely, if we see a credible peace proposal emerge, the significant war premium currently priced into crude will evaporate quickly. This could trigger a sharp price correction down towards the low $80s, which was the prevailing range before this conflict began two months ago. Traders positioned for this outcome might consider buying put options to profit from such a decline.
This situation feels reminiscent of the volatility we experienced during the Red Sea disruptions back in 2025, where headline risk dictated price action. Given the binary nature of the outcome, using options spreads can help define risk. A bear put spread, for instance, would allow a trader to bet on a price drop while capping potential losses if the conflict unexpectedly escalates further.