Italy’s consumer confidence index fell to 90.8 in April, down from 92.6 in the previous month. The latest reading shows a drop of 1.8 points month on month.
The index tracks how households view the economy and their own finances. The April result indicates weaker sentiment than in March.
Implications For The Domestic Economy
The drop in Italian consumer confidence to 90.8 is a clear bearish indicator for the domestic economy. We should anticipate a slowdown in consumer spending, which will directly impact company revenues in the coming quarter. This shift in sentiment warrants positioning for a downturn in Italian equities.
Given this outlook, we are considering short positions on the FTSE MIB index through futures contracts. Another effective strategy would be to buy put options on ETFs tracking the Italian market, which provides a defined-risk way to profit from a potential decline. The market has been vulnerable for weeks, and this data could trigger a move lower.
This consumer pessimism is not an isolated event, as it follows recent Eurostat data showing Italy’s industrial production unexpectedly fell by 0.7% in March 2026. This, combined with a persistently high national debt-to-GDP ratio, which stood at 140.5% at the end of 2025, paints a picture of underlying economic fragility. The European Central Bank’s reluctance to lower interest rates further compounds the pressure on the economy.
We see particular vulnerability in the consumer discretionary and luxury goods sectors, which are highly exposed to domestic sentiment. Buying put options on key names in this space appears prudent. Italian banks may also face headwinds from slowing loan growth and rising credit risks.
Historical Parallel And Market Positioning
Looking back, we saw a similar, though less pronounced, drop in confidence during the second quarter of 2025. That event preceded a 6% pullback in the FTSE MIB over the following two months. The current reading is significantly weaker, suggesting the potential for a sharper market reaction this time.
This heightened uncertainty is likely to increase market volatility. We can position for this by purchasing straddles on the index, which would profit from a large price swing in either direction. Current implied volatility is relatively low, making this an attractive strategy to hedge against or speculate on a significant market event.
Bavaria’s consumer price index (CPI) rose by 0.5% month-on-month in April. This was down from 1.2% in the previous month.
The April figure shows a slowdown of 0.7 percentage points compared with the prior reading. The release compares April’s monthly change with the previous month’s monthly change.
Implications For German And Eurozone Inflation
We see this sharp slowdown in Bavarian inflation as a significant leading indicator for the upcoming German and Eurozone-wide inflation figures. This data point materially increases the probability that the European Central Bank (ECB) will cut interest rates at its June meeting. The market will now begin to price in a more dovish path for the ECB through the rest of the year.
This reinforces our bearish outlook on the Euro, especially against the US dollar. With the latest US core PCE inflation data from March showing stubbornness at 2.8%, the policy divergence between a cutting ECB and a holding Federal Reserve is widening. We should therefore consider strategies that profit from a decline in the EUR/USD exchange rate.
The signal of cooling inflation is a strong catalyst for European government bonds. We anticipate that yields on German 10-year Bunds will fall, pushing bond prices higher in the coming weeks. Looking back, we saw a similar dynamic in late 2023 when weaker inflation prints triggered a powerful rally in Bund futures.
For equity traders, the prospect of lower interest rates is a clear positive for the German DAX index. Lower financing costs provide direct support for corporate earnings and make equities more attractive on a valuation basis. We expect rate-sensitive sectors like technology and real estate to lead any potential rally.
Options Strategies To Express The View
To directly act on this, we can look at options strategies to manage risk and express our view. Buying call options on the DAX provides upside exposure with a defined downside. For the currency view, purchasing put options on the Euro via the futures market is a straightforward way to position for a weaker currency.
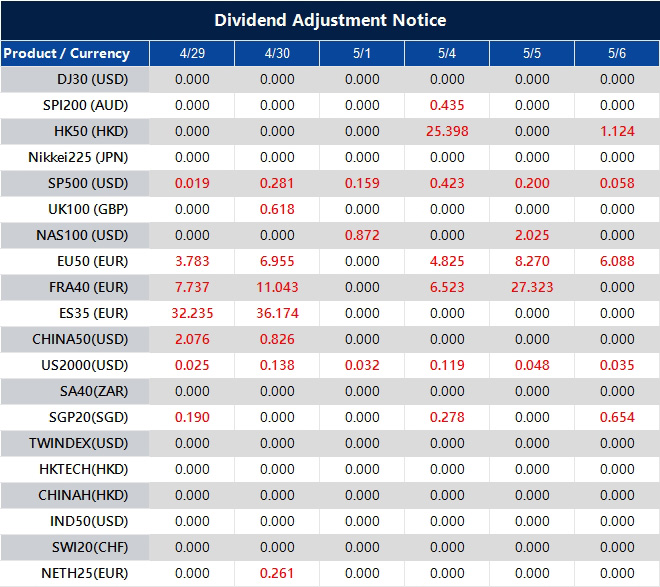
Please note that the dividends of the following products will be adjusted accordingly. Index dividends will be executed separately through a balance statement directly to your trading account, and the comment will be in the following format “Div & Product Name & Net Volume”.
Please refer to the table below for more details:
The above data is for reference only, please refer to the MT4/MT5 software for specific data.
If you’d like more information, please don’t hesitate to contact [email protected].
Bavaria’s consumer price index (CPI) rose by 2.9% year on year in April. This was up from 2.8% in the previous reading.
This uptick in Bavarian inflation to 2.9% is a warning sign for anyone positioned for further European Central Bank rate cuts. As a key early indicator for Germany and the wider Eurozone, this suggests inflation is proving stickier than anticipated. This challenges the market consensus that the ECB has a clear path for monetary easing through the rest of 2026.
Implications For ECB Policy Expectations
We should reconsider our exposure to interest rate sensitive instruments. Market pricing for a July rate cut now looks vulnerable, and short positions on December 2026 Euribor futures could prove profitable as expectations are adjusted. We saw a similar situation in late 2025 when a stubborn services inflation report caused a sharp bond market sell-off, and this current data could trigger a repeat.
For equity traders, this implies a more defensive stance, especially with the DAX trading near its all-time highs. Persistently higher rates could weigh on corporate earnings and investor sentiment, making protective put options on the DAX or Euro Stoxx 50 for June expiry an attractive hedge. With the VSTOXX volatility index sitting below 14 for most of the last quarter, options pricing remains relatively cheap for portfolio insurance.
In the currency markets, this data could provide renewed strength for the Euro. If the ECB is forced to sound more hawkish while the U.S. Federal Reserve continues to signal a potential easing, the EUR/USD exchange rate may finally break higher. A look at call options on the EUR/USD pair is warranted, especially as positioning data shows many traders are still underweight the Euro.
Switzerland’s ZEW survey showed that expectations rose to -30.3 in April, from -35 in the previous reading.
The latest Swiss ZEW survey shows economic expectations improved to -30.3 for April, which is a notable step up from the previous reading of -35. While the figure remains deeply pessimistic, the positive direction suggests the worst of the negative sentiment might be passing. We see this as a sign that a potential bottoming process could be starting for Swiss assets.
For the Swiss franc, this data could reduce pressure on the Swiss National Bank to pursue further aggressive rate cuts. We’ve seen the franc weaken against the euro throughout late 2025 and early 2026, with the EUR/CHF cross recently trading around 0.9850 as the SNB adopted a more dovish stance. Traders might consider selling out-of-the-money call options on EUR/CHF, betting that this lessening economic pessimism will put a cap on further franc weakness.
This slightly improved outlook may offer some support for the Swiss Market Index (SMI), which has underperformed its European peers this year. We note that implied volatility on SMI options has recently declined to a 3-month low of 14%, suggesting some complacency despite the underlying negative sentiment. A cautious strategy could be to buy long-dated call spreads on the SMI, which limits risk while positioning for a gradual recovery.
We must remember the difficult economic environment that led to this point, particularly the sharp downturn we saw in manufacturing orders during the second half of 2025. That period saw the ZEW indicator fall below -40, a level historically associated with recessionary conditions. Therefore, while today’s reading is an improvement, it confirms we are still operating in a fragile economic climate.
Written on April 29, 2026 at 9:25 am, by josephine
GBP/USD edged up in Asian trading on Wednesday, near 1.3520, after small losses the day before. On the daily chart it is near the lower edge of an ascending channel, which can point to a bearish reversal risk.
The pair is still trading above the nine-day Exponential Moving Average and the 50-day EMA. The 14-day Relative Strength Index is near 56, suggesting upward momentum that is not stretched.
Technical Picture And Near Term Bias
On Tuesday, GBP/USD fell 0.12% and closed near 1.3520, staying in a consolidation zone around 1.3500. It moved about 115 pips between 1.3465 and 1.3580, with early gains fading before a late rebound from the lows.
Markets are focused on the Bank of England decision on Thursday at 11:00 UTC. The Bank Rate is expected to stay at 3.75%, with an MPC vote forecast at 8-1-0 versus the previous 9-0-0 hold.
The Monetary Policy Report and Governor Bailey’s press conference are due at 11:30 UTC. A speech from MPC member Pill is scheduled for Friday at 11:15 UTC.
Looking back to 2025, we recall when the GBP/USD pair was consolidating around the 1.3500 level, with the market anticipating a Bank of England rate hold at 3.75%. Today, that environment has changed significantly, as we see the pair trading much lower, around 1.2850. The technical supports that held last year have since given way to a different market reality.
Policy Divergence And Trading Implications
The key driver for this shift has been the divergence in central bank policy throughout late 2025 and early 2026. While the Bank of England did raise rates further, it has recently begun an easing cycle, cutting the Bank Rate to 5.25% to support a sluggish economy. In contrast, the US Federal Reserve has maintained its rate at 5.00%, showing less urgency to cut amidst more resilient economic data.
Recent data from the Office for National Statistics shows UK inflation is now at 2.8%, down from its peaks but still stubbornly above the 2% target. This has created uncertainty, as the market is now pricing in at least two more rate cuts from the BoE by the end of this year. This expectation is weighing on the pound and suggests the path of least resistance is downwards.
For the coming weeks, traders should consider positioning for further potential weakness in the pound against the dollar. Buying GBP/USD put options offers a direct way to profit from a decline, especially ahead of the next BoE meeting in May. Using strategies like bear put spreads can also be effective, as they lower the upfront cost of the trade while defining the risk in this volatile environment.
S&P 500 E-Mini Futures (ES) fell from the April 2025 low at 6367 in a move classed as wave (2). The market then moved higher in wave (3) and rose above the wave (1) high at 7036.25.
From the end of wave (2), wave ((i)) finished at 6653.75. Wave ((ii)) then pulled back to 6503.75.
Wave Structure And Key Levels
Wave ((iii)) advanced to 7185.75. Wave ((iv)) later eased to 7079.25.
The next move is described as wave ((v)), which is expected to complete wave 1 at a higher degree. After wave 1 ends, a wave 2 pullback is expected to correct the cycle from the March 31, 2026 low before the uptrend continues.
In the near term, the view remains positive while 6367 holds. Pullbacks are described as likely to take the form of three or seven swings.
We see the market is in the final stages of an upward push that started from the March 31, 2026 low. This rally is supported by recent economic reports, with first-quarter GDP showing a healthy 2.4% expansion and the latest CPI figures indicating inflation is cooling slightly to 3.1%. In the immediate short-term, traders could look to benefit from this last leg up by holding long futures positions or using short-dated call options.
Risk Management And Trade Planning
However, we expect this upward move, wave 1, to complete soon and give way to a corrective pullback in wave 2. The CBOE Volatility Index (VIX) has recently dropped to a low of 15, signaling a high degree of market confidence that could quickly reverse during a correction. This suggests that traders should plan to take profits on bullish trades and consider buying put options to hedge or profit from the anticipated dip in the coming weeks.
This expected correction should be viewed as a significant buying opportunity, not a reason to turn bearish on the broader trend. Looking back, the recovery from the April 2025 low at 6367 demonstrated the market’s underlying strength, similar to the powerful rallies that followed the significant dips in 2022. Therefore, we will be waiting for this pullback to unfold before establishing new, longer-term bullish positions.
The critical level for us to watch remains the 6367 pivot point. As long as any pullback stays above this threshold, the overall bullish structure remains intact. All trading strategies should incorporate this level as a definitive line for risk management, ensuring that any break below it would trigger an exit from long positions.
AUD/USD failed to break 0.7200 and fell during the Asian session on Wednesday after Australian consumer inflation data missed forecasts. This weighed on the Australian dollar and pushed the pair towards 0.7160, with some support ahead of the FOMC update.
Uncertainty around US-Iran peace talks supported demand for the US dollar. The Federal Reserve is expected to keep interest rates unchanged after its two-day meeting later today, with attention on the press conference for policy guidance from Jerome Powell.
Range Break Needed For Clarity
The pair has traded within the same range for about two weeks, following a strong rise from the March swing low. Momentum signals are mixed, so a clear break from the range may be needed before a new move becomes clearer.
The RSI is just below 50 and the MACD histogram is flattening after a positive phase. Support sits near 0.7160/0.7150, while the 200-period SMA near 0.7043 is another level to watch on deeper declines.
The technical analysis section was produced with help from an AI tool.
We are seeing a familiar pattern as the AUD/USD struggles to hold its ground. Australia’s recent Q1 2026 inflation data, coming in at 3.4%, missed the 3.5% forecast and is weighing on the Aussie, much like similar disappointments have in the past. With the pair currently hovering around the 0.6680 mark, the inability to break higher feels like a ceiling is forming.
Range Strategies And Event Risk
The US dollar remains strong, underpinned by persistent inflation figures, with the latest core PCE data for March 2026 holding stubbornly at 2.8%. This keeps the Federal Reserve in a hawkish stance ahead of their meeting next week, drawing capital towards the dollar as a safe haven amid ongoing trade tensions in the South China Sea. This dynamic is pinning the AUD/USD down, creating a tense, compressed trading range.
For traders, this tight range ahead of a major event suggests selling volatility could be a viable strategy in the immediate term. We could look at selling an iron condor, perhaps selling the 0.6750 call options and the 0.6600 put options to collect premium. This position profits as long as the pair remains between these levels through the beginning of next week.
Conversely, the Fed’s upcoming announcement is a significant catalyst that could shatter this calm. For those expecting a breakout, buying a strangle with a two-week expiry is a logical play. Purchasing both an out-of-the-money call and put allows us to profit from a significant price swing in either direction following the Fed’s statement.
Looking back to a similar period of consolidation we saw in early 2025, the AUD/USD was stuck in a tight 150-pip range for nearly a month. Range-bound strategies paid off for weeks until a surprise jobs report finally caused a violent breakout. This historical precedent reminds us that while collecting premium is attractive now, the risk of a sharp move is building each day.
Given the mixed technical signals, buying put options can serve as a cheap and effective hedge for any existing long positions. This provides a safety net against a hawkish Fed surprise that could send the pair sharply lower. It’s a prudent way to manage risk without abandoning a potentially bullish medium-term outlook.
Gold prices in Saudi Arabia rose on Wednesday, based on FXStreet data. Gold was priced at SAR 555.19 per gram, up from SAR 554.22 on Tuesday.
The price per tola increased to SAR 6,474.71 from SAR 6,464.28 a day earlier. FXStreet also listed SAR 5,551.11 for 10 grams and SAR 17,268.04 per troy ounce.
How FXStreet Calculates Local Gold Prices
FXStreet converts international gold prices into Saudi riyals using the USD/SAR rate and local measurement units. The figures are updated daily at the time of publication, and local prices may vary slightly.
Central banks are the largest gold holders and added 1,136 tonnes worth about $70 billion to reserves in 2022, according to the World Gold Council. This was the highest annual total since records began, and central banks in China, India and Turkey have increased reserves.
Gold often moves opposite to the US Dollar and US Treasuries, and it can also move against risk assets such as shares. Prices can change due to geopolitics, recession fears, interest rates, and shifts in the US Dollar because gold is priced in dollars (XAU/USD).
With geopolitical tensions rising again in the South China Sea, gold’s role as a safe-haven asset is coming into focus. The inverse correlation with risk assets suggests that any further escalation could trigger a flight to safety, benefiting precious metals. We are therefore watching for signs of increased market volatility, which could propel gold higher in the coming weeks.
Rate Expectations And Options Positioning
Given the recent US inflation data for March coming in at 2.8%, talk of the Federal Reserve pausing its rate-hiking cycle is growing louder, which tends to weaken the dollar. This creates a favorable environment for gold, making long positions attractive. We believe that buying call options with June and July 2026 expiries could be a prudent way to capture potential upside.
Implied volatility has already started to creep up, so outright call buying might be expensive. A bull call spread could be a more cost-effective strategy to express a moderately bullish view while capping both risk and premium outlay. This approach allows participation in a rally but protects against a sudden reversal or a period of sideways consolidation.
We must also consider the immense, ongoing demand from central banks, which provides a strong floor for the price. The People’s Bank of China just reported adding another 60 tonnes to its reserves in the first quarter of 2026, continuing a multi-year trend of de-dollarization. This structural buying from official institutions is a powerful tailwind that is unlikely to diminish.
Looking back at the market action in 2025, we saw a similar setup where a combination of a dovish Fed pivot and persistent central bank demand pushed gold decisively past the $2,500 per ounce level. The current market structure is showing echoes of that period, suggesting that pullbacks should be viewed as buying opportunities. This historical precedent gives us confidence that the fundamental drivers remain firmly in place.
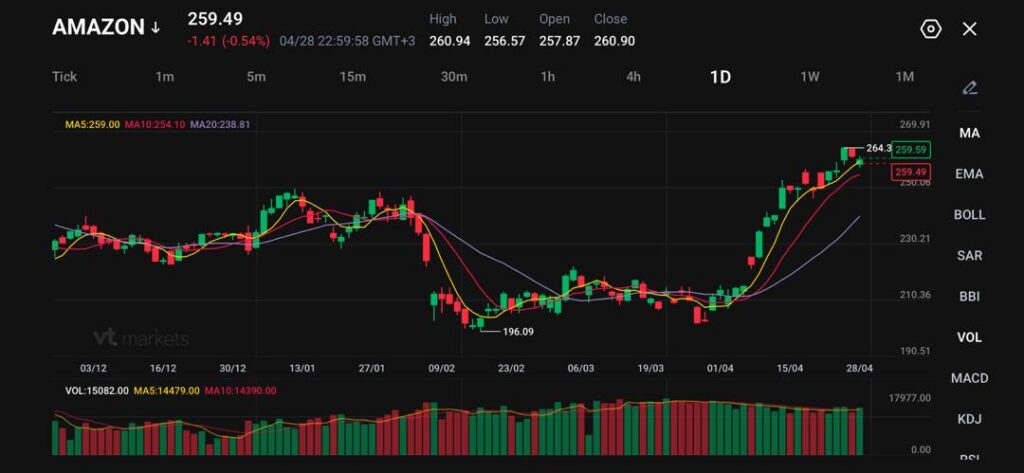
Amazon traded at 259.49, down 1.41 points, or 0.54%, after touching a session high of 260.94.
MSCI’s broadest index of Asia-Pacific shares outside Japan rose 0.2%, while S&P 500 e-mini futures edged up 0.2%.
Brent crude rose 0.2% to $111.51 per barrel as efforts to end the Iran conflict hit an impasse.
Fed funds futures priced a 100% chance that the Federal Reserve keeps rates unchanged, with no policy changes expected until late in 2027.
Amazon stock is trading close to recent highs as markets shift back toward corporate earnings, AI spending, and the Federal Reserve’s rate decision. The wider market found support in Asian trading on Wednesday, helped by stronger earnings optimism and a calmer tone after recent worries over Iran and the AI sector.
MSCI’s broadest index of Asia-Pacific shares outside Japan reversed earlier losses to rise 0.2%, while S&P 500 e-mini futures edged up 0.2%. Japanese markets were closed for a holiday.
For Amazon, timing is key. Microsoft, Alphabet, Amazon, and Meta Platforms are due to report earnings later on Wednesday, and those results will test whether traders still trust the AI-led rally.
The market has moved past the early stage of the AI boom. It now wants proof that cloud revenue, advertising demand, retail margins, and data-centre spending can still justify premium valuations.
Amazon said it will finally be able to make OpenAI's models available to its own customers after Microsoft agreed to drop its exclusive rights to resell the ChatGPT maker’s products https://t.co/sk3pet8dcB
The cautious forecast is straightforward. If Amazon shows stronger cloud growth, clean retail margins, and disciplined AI investment, the stock can defend its recent breakout. If management points to heavier data-centre costs without a clear revenue payoff, traders may sell into strength.
Earnings Optimism Is Still Supporting Risk Appetite
The broader earnings picture remains firm. Corporate America has shown resilience during the Iran conflict, with slightly more than one-third of S&P 500 sectors already reporting profits and 81% of companies beating estimates.
Q1 earnings are tracking year-over-year growth and climbing, while analysts appear to be revising numbers higher rather than lower this season.
That gives equity bulls a reason to stay involved. Strong earnings can offset some pressure from higher oil prices, a firmer dollar, and geopolitical risk. Amazon benefits from that backdrop because traders are still willing to reward companies that can prove earnings power in a tougher macro setting.
Amazon and Meta have struck a multibillion-dollar deal for the social-media giant to rent hundreds of thousands of Amazon’s general-purpose chips for its AI efforts. https://t.co/yKzaP9pT4M
Still, the bar is high. A broad beat rate of 81% means traders may punish even small disappointments. Amazon needs more than a headline beat. It needs guidance that calms concerns around AWS growth, AI infrastructure spending, consumer demand, and operating leverage.
AI Doubts Put More Pressure On Amazon’s Cloud Story
AI sentiment weakened on Tuesday after The Wall Street Journal reported that OpenAI had missed internal targets for weekly users and revenue. The report raised fresh questions about whether the AI ecosystem can support massive spending on data centres. Oracle and CoreWeave came under pressure, while the S&P 500 fell 0.5% and the Nasdaq Composite dropped 0.9%.
AWS sits at the centre of the AI infrastructure trade. Traders want to know whether cloud clients are still spending, whether demand for AI workloads is rising fast enough, and whether capex will turn into stronger cash flow over time.
Amazon and Meta signed a deal for Meta to deploy AWS Graviton chips, making Meta one of the top five customers of Amazon's custom CPU. CNBC's Kristina Partsinevelos has the details. https://t.co/sx6uD8ebF9pic.twitter.com/r0Q0TgH7mK
Amazon’s cautious upside case depends on AWS delivering a clear growth story. A strong cloud result could help the stock push above its recent 264.3 chart peak. A weaker cloud tone could leave the shares exposed, especially after the sharp rally from the 196.09 low.
Iran, Oil and the Fed Keep Macro Risk Alive
The Iran conflict remains the main macro risk. Brent crude rose 0.2% to $111.51 per barrel as efforts to end the conflict hit an impasse. A US official said President Donald Trump was unhappy with Tehran’s latest proposal because he wants nuclear issues dealt with from the outset. The Wall Street Journal also reported that Trump had instructed aides to prepare for an extended blockade of Iran.
Higher oil keeps inflation risk alive. For companies like Amazon, energy costs can affect logistics, shipping, warehouse expenses, and consumer confidence. A prolonged oil shock can also push the Fed into a more cautious stance, which tends to weigh on long-duration growth stocks.
The Federal Reserve’s April meeting now sits at the centre of the next market move. Traders see a hold as certain, with fed funds futures pricing an implied 100% probability that the Fed keeps rates unchanged. No policy changes are expected until late in 2027, according to the CME Group’s FedWatch tool. ING analysts said the Fed could adopt a hawkish tilt while staying in wait-and-see mode because of the war-hit inflation backdrop.
Technical Analysis
AMAZON is trading near 259.50, easing slightly after a strong upside run that pushed price into the 264.30 region, marking a fresh swing high. The broader structure shows a clear shift from consolidation into a firm bullish trend, with buyers maintaining control following the breakout from the 210–230 base earlier this month.
From a technical standpoint, momentum remains constructive but stretched in the short term. Price is holding above the 5-day (259.00) and 10-day (254.10) moving averages, both of which are trending higher and acting as dynamic support. The 20-day (238.80) sits well below, reinforcing the strength of the underlying move and highlighting how aggressive the recent rally has been.
Key levels to watch:
Support: 259.00 → 254.10 → 238.80
Resistance: 264.30 → 269.90 → 275.00
Price is now hovering just below 264.30 resistance, where recent upside stalled. A clean break above this level could extend the move toward 269.90, with further upside possible if momentum continues to build. However, given the sharp run higher, some near-term consolidation or pullback would be typical before any sustained continuation.
On the downside, 259.00 is the first level to watch, aligning with the short-term trend support. A break below this could trigger a deeper retracement toward 254.10, though such a move would still be considered corrective within the broader uptrend unless momentum deteriorates more materially.
Overall, Amazon remains in a strong uptrend with shallow pullbacks, but price is now testing a resistance zone where buyers may need to pause before attempting the next leg higher.
Cross-Asset Sentiment Stays Mixed
Gold fell 0.2% to $4,583.40 as the dollar edged higher. In crypto, bitcoin gained 1.1% to $77,296.62, while ether rallied 1.5% to $2,331.23. That mix shows a market willing to take selective risk, but not ready to ignore inflation, oil, and central bank pressure.
For Amazon, the cautious forecast favours a volatile but constructive setup while the stock holds above 254.10. A strong earnings report could push price back toward 264.3 and then 269.91. A weak AI or AWS message could trigger a move back toward 250.00 and 238.81, especially if the Fed leans hawkish or Brent stays above $111.51.
Create a live VT Markets account today to access our platform features, including market insights and educational content.
Trader Questions
Why Is Amazon Stock In Focus?
Amazon stock is in focus because its earnings are due alongside other major US tech names, including Microsoft, Alphabet, and Meta Platforms.
The results will test whether investors still trust the AI-driven rally, especially after recent concerns over data-centre spending and slower AI revenue momentum.
How Is Amazon Trading On The Chart?
Amazon traded at 259.49, down 1.41 points, or 0.54%.
The session high was 260.94, with a low of 256.57, an open at 257.87, and a close at 260.90. The stock remains close to its recent peak near 264.3.
What Are The Key Amazon Stock Levels To Watch?
The first resistance sits near 260.94, followed by the recent high around 264.3.
A daily close above 264.3 could bring 269.91 into focus. Support sits near 259.00, then 256.57 and 254.10. A break below 254.10 could expose 250.00 and the 20-day moving average at 238.81.
Is Amazon Still In An Uptrend?
Amazon remains in a short-term uptrend while it holds above its key moving averages.
The 5-day moving average sits at 259.00, the 10-day moving average at 254.10, and the 20-day moving average at 238.81. Price remains above all three, which keeps the technical setup constructive for now.
Why Do Amazon Earnings Matter For The AI Trade?
Amazon earnings matter because AWS sits at the centre of cloud and AI infrastructure demand.
Investors want to see whether cloud clients are still spending, whether AI workloads are growing, and whether data-centre investment can turn into stronger revenue and cash flow.
Start trading now – Click here to create your real VT Markets account
Written on April 29, 2026 at 8:17 am, by josephine