The United Arab Emirates (UAE) will leave the Organization of the Petroleum Exporting Countries (OPEC) on 1 May, Reuters reported on Tuesday. The move comes during an energy crisis linked to the Iran war, with reports of growing discord among Gulf nations.
The report said the UAE has faced missile and drone attacks for weeks by Iran, which is also an OPEC member. It also said Iran’s attacks on shipping in the Strait of Hormuz have constrained the UAE’s ability to export oil, affecting a key part of its economy.
Uae Exit Impact On Oil Markets
UAE Energy Minister Suhail Al Mazrouei said the exit would have a minimum impact on oil prices and on OPEC and OPEC+. At the time of writing, West Texas Intermediate (WTI) was up 2.15% on the day at $97.00.
We are now approaching the one-year mark since the United Arab Emirates left OPEC, a move prompted by attacks from Iran last year. The initial price spike to $97 a barrel, which we saw in April 2025, was driven by war fears that overshadowed the prospect of more supply. This underlying tension between geopolitical risk and unconstrained production continues to define the market.
Since its departure, the UAE has aggressively increased output, adding an estimated 750,000 barrels per day to the market to maximize revenue. This is a significant move towards their stated capacity goal of 5 million barrels per day. This sustained increase in non-OPEC supply has created a persistent headwind for crude oil prices over the last several months.
We expect implied volatility in crude options to surge in the coming weeks, especially with ongoing shipping disruptions in the Strait of Hormuz. Looking back, similar geopolitical flare-ups, like the beginning of the Ukraine conflict in 2022, saw volatility metrics double almost overnight. Traders should consider purchasing straddles or strangles to profit from a large price move in either direction.
Brent Wti Spread And Strait Of Hormuz
The conflict’s concentration in the Strait of Hormuz puts direct pressure on seaborne crude, which primarily affects Brent pricing. This has caused the Brent-WTI spread to widen significantly, recently hitting multi-year highs of over $9. We see opportunities in positioning for this spread to widen further if regional tensions escalate.
EUR/USD traded lower near 1.1715 in early Asian trading on Wednesday, with the US Dollar supported by uncertainty over a possible Middle East ceasefire. Markets are focused on the US Federal Reserve rate decision later on Wednesday.
Donald Trump said Iran asked the US to lift a naval blockade of the Strait of Hormuz while talks continue to end a two-month war. CNN reported that mediators in Pakistan expect Iran to submit a revised proposal within the next few days.
Geopolitical Risk And Dollar Demand
Iran has said it will not open the waterway while the US blockade remains in place. This keeps uncertainty elevated and supports demand for the US Dollar.
The Fed is expected to keep rates unchanged at 3.50% to 3.75% at its April meeting, which would be the third straight hold. Traders will watch Jerome Powell’s press conference for signals on the path ahead.
Attention then turns to the ECB decision on Thursday, with expectations of a hawkish hold and possible rate rises in June or July. Goldman Sachs forecasts two 25 bps hikes, in June and September, taking the deposit rate back to 2.50%.
In 2022, the Euro accounted for 31% of FX trades, with daily turnover above $2.2 trillion. EUR/USD represents about 30% of FX turnover; EUR/JPY 4%, EUR/GBP 3%, and EUR/AUD 2%.
Central Banks And Volatility
We see echoes of the situation back in 2025, where geopolitical risk drove flows into the US Dollar, putting pressure on the Euro. With EUR/USD currently struggling around 1.05 amid renewed tensions in the Middle East, the dollar’s safe-haven appeal is once again a dominant market theme. This week’s central bank decisions will be critical for setting a direction for the coming weeks.
The market is pricing in a hold from the Federal Reserve, keeping the federal funds rate in its current 4.00% to 4.25% range. Recent inflation data, with the core Consumer Price Index (CPI) remaining stubbornly above 3% last quarter, has pushed back expectations of any near-term rate cuts. This policy stance supports a strong dollar, especially as the US economy continues to show resilience with Q1 2026 GDP growth reported at a healthy 2.1%.
Across the Atlantic, the European Central Bank is also expected to hold its deposit rate at 3.00%, but its challenge is different. While Eurozone inflation has cooled, sluggish economic performance, particularly with Germany’s manufacturing PMI contracting for a fourth straight month, makes a hawkish policy difficult to justify. This economic divergence makes a sustained rally in the Euro unlikely.
For derivative traders, this suggests owning volatility could be a prudent strategy. We believe long straddles or strangles on EUR/USD options could be effective, as they would profit from a significant price swing following the central bank announcements, regardless of the direction. Implied volatility for one-month options has already risen to 8.2%, reflecting the market’s uncertainty, but a surprise could easily push actual volatility higher.
For those with a directional view, the path of least resistance appears to be a weaker Euro. The interest rate differential, with US 2-year yields offering a premium of over 120 basis points compared to German bunds, creates a positive carry for holding short EUR/USD positions. However, any unexpected de-escalation of global tensions could trigger a sharp relief rally, making disciplined risk management essential for any short futures or forward positions.
GBP/USD fell 0.12% on Tuesday to about 1.3520, staying in a consolidation zone near 1.3500. It moved in a 115-pip range from 1.3465 to 1.3580, with early gains fading before a late bounce from the lows.
Attention turns to the Bank of England decision on Thursday at 11:00 UTC. The Bank Rate is expected to stay at 3.75%, with an MPC vote forecast at 8-1-0 versus the prior 9-0-0 hold, followed by the Monetary Policy Report and a 11:30 UTC press conference.
Central Bank Events In Focus
Energy-driven inflation risks linked to the Iran conflict are a focus, with an MPC member Pill speech due Friday at 11:15 UTC. In the US, the Federal Reserve decision on Wednesday at 18:00 UTC is expected to keep rates at 3.50% to 3.75%, with Powell’s tone on inflation watched closely.
Traders are assessing whether oil disruption at the Strait of Hormuz affects inflation beyond the near term; Friday’s US ISM Manufacturing PMI is also due. On charts, price sits near 1.3519 below 1.3538 resistance, while daily levels show support at 1.3518, the 50-day EMA at 1.3440, and the 200-day EMA at 1.3387, with Stochastic RSI near 65.
We see the GBP/USD pair is currently stalled around the 1.3500 level, reflecting widespread caution ahead of major central bank decisions. This indecisive price action, shown by the tight consolidation, suggests that the market is waiting for a clear signal from either the Bank of England (BoE) or the Federal Reserve. Derivative traders should be preparing for a significant breakout from this range once the news is released.
With both central bank meetings occurring this week, implied volatility is likely to rise, making option strategies attractive. A simple approach would be to buy a straddle, which involves buying both a call and a put option with the same strike price and expiry date. This position profits if the GBP/USD makes a strong move in either direction, which is a real possibility given the current geopolitical tensions affecting inflation.
Options Positioning For Breakout
The BoE’s expected 8-1 split vote highlights its dilemma with rising inflation, a situation we saw unfold similarly in 2022. Recent data shows UK Consumer Price Index (CPI) inflation unexpectedly rose to 3.1% in March 2026, pushed higher by the energy price shock from the Iran conflict. This persistent inflation, well above the 2% target, puts immense pressure on the BoE to avoid appearing too soft, even if a rate hike is not expected now.
On the other side, the Fed is watching US Core Personal Consumption Expenditures (PCE), which has remained stubbornly above target at 2.9%. Historically, geopolitical oil shocks, such as the 1979 crisis, have led to sustained inflation, forcing the Fed into aggressive action. If Chair Powell hints that the Strait of Hormuz disruption is not a temporary issue, it would signal a more hawkish path for the dollar.
A hawkish Fed combined with a dovish split from the BoE would likely send GBP/USD lower. In this scenario, we would consider buying put options with strike prices below the key 50-day moving average at 1.3440. This would position us to profit from a breakdown toward the 200-day average near 1.3387.
Conversely, if the Fed dismisses the oil shock as transitory and the BoE expresses unified concern about inflation, the pound could rally sharply. For this possibility, we could look at call options with strike prices above the recent high of 1.3580. The technical support provided by the moving averages on the daily chart gives us a clear zone where dip-buying strategies have previously been successful.
Spot gold (XAU/USD) fell 1.85% on Tuesday and closed near $4,596, after trading as low as about $4,555. It has closed lower in four of the last six sessions, and the move broke a prior hold above $4,650.
The Federal Reserve decision is due at 18:00 UTC on Wednesday, with the policy rate expected to stay at 3.50% to 3.75%. Key US releases on Thursday include Q1 GDP, forecast at 2.3% annualised after 0.5%, and March Core PCE, seen at 3.2% year on year versus 3%.
Fed Decision And Market Setup
Friday brings the ISM manufacturing PMI, with the prices paid index expected near 80, above the 50 expansion level. On a 15-minute view, price is $4,595.84 versus the day’s open of $4,697.98, with Stochastic RSI moving down from overbought.
On the daily chart, price is between the 50-day EMA at about $4,764.90 and the 200-day EMA near $4,325.77, with Stochastic RSI near 32. Central banks added 1,136 tonnes of gold worth around $70 billion in 2022, the highest annual total on record.
We are seeing gold prices test the $4,600 level after a sharp decline ahead of the Federal Reserve’s decision later today. The key uncertainty is how the Fed will address persistent inflation, especially with recent energy price shocks stemming from the Iran conflict. Implied volatility in gold options has risen to a six-week high, which suggests the market is bracing for a significant price move in either direction following the announcement.
A hawkish tone from the Fed, emphasizing inflation control despite energy costs, would likely strengthen the dollar and push gold lower. In this scenario, we would consider buying put options or establishing short futures positions, targeting a break below yesterday’s low near $4,555. The primary support level to watch on a sustained sell-off remains the 200-day moving average around $4,325.
Conversely, if the Fed signals patience and acknowledges the risk of an energy-driven slowdown, gold should find relief. This outcome would warrant looking at call options or long futures to capitalize on a rally. The first major hurdle to overcome would be the 50-day moving average, currently sitting near $4,765.
Macro Backdrop And Key Catalysts
We are mindful of historical precedents, as the current combination of an energy shock and persistent inflation echoes the stagflationary environment of the 1970s. While that period was volatile, gold ultimately performed well as a store of value. This longer-term bullish case is also supported by continued central bank buying, which, looking back from 2025, we saw reach record levels in 2022 and has continued robustly into this year.
Beyond today’s Fed meeting, our focus will shift to Thursday’s Q1 GDP and Core PCE inflation data. Stronger-than-expected figures would validate a hawkish Fed stance and likely add further pressure on gold prices through the end of the week. Any signs of slowing growth or cooling inflation, however, could reignite bullish sentiment for the metal.
Chile’s central bank kept its benchmark interest rate at 4.50% after a unanimous vote. The board said the worsening conflict in the Middle East is weighing on the policy outlook.
The Banco Central de Chile stated that the war’s effect on the global economy has been more adverse than the scenario in its March Monetary Policy Report (IPoM). It said further escalation could raise inflation while also worsening a global economic slowdown.
Middle East Conflict And Inflation Risks
The board warned that a prolonged conflict could keep crude oil prices high for longer. It noted this risk is important for a small open economy that is exposed to higher external costs through energy imports.
The rate hold leaves policy on a wait-and-see approach as officials assess falling inflation in domestic data against renewed supply risks. The next quarterly IPoM is expected to update external assumptions due to changes since March.
The Chilean central bank’s decision to hold rates at 4.5% signals significant caution in the face of geopolitical risk. With Brent crude futures now pushing towards $98 a barrel, a sharp increase from the Q1 average, we see this as a defensive move against imported inflation. This indicates that betting on imminent rate cuts in Chile is a risky position for now.
This sustained tension suggests long positions in crude oil call options or futures could be beneficial. Traders might consider longer-dated contracts to ride out potential volatility caused by any further escalation in the Middle East. We believe the risk premium in oil is likely to remain elevated for the foreseeable future.
Chilean Peso And Market Volatility
For the Chilean peso, this “wait-and-see” stance creates uncertainty, which we’ve seen reflected in the USD/CLP exchange rate breaking above 980. This makes currency options, which can profit from volatility, a more prudent strategy than taking a direct position. Looking back at the historical data from 2025, the peso was much stronger when global conditions were calmer.
The bank’s inflation fears are not isolated; the latest U.S. CPI data for March surprised to the upside at 3.7%, interrupting the cooling trend from late 2025. This environment suggests we should be wary of positions, like shorting the U.S. dollar, that rely on imminent rate cuts from the Federal Reserve. Any trades betting on lower global interest rates should be carefully reconsidered.
The risk of a global slowdown, echoed by the IMF’s recent downgrade of its 2026 growth forecast to 2.8%, should also guide our strategy. We believe hedging equity portfolios with put options on major indices like the S&P 500 is a necessary precaution. The combination of high energy prices and tightening financial conditions presents a clear headwind for corporate earnings.
USD/JPY traded in an 80-pip range on Tuesday and closed near 159.62, after a low of 158.96 in early Asia and a high of 159.79 late in New York. The pair has been broadly unchanged since mid-March, with 160.00 acting as a cap through repeated tests.
Japan’s calendar becomes busier over the next 48 hours, with March Retail Trade due on Wednesday, forecast at 0.8% year-on-year versus -0.2% previously. Tokyo CPI is due on Thursday, with the ex-fresh-food measure forecast at 1.8% year-on-year versus 1.7% prior, while two-year Japanese government bond yields are around multi-decade highs.
Key US And Japan Catalysts
In the US, the Federal Reserve decision is due at 18:00 UTC on Wednesday, with the federal funds rate expected to be held at 3.50% to 3.75%. Attention is also on the Iran conflict and Strait of Hormuz oil disruption, ahead of Thursday’s US Q1 GDP and Core PCE Price Index releases.
On a 15-minute chart, the pair trades at 159.62, above the day’s open at 159.36, with Stochastic RSI around the mid-50s. On the daily chart, price is above the 50-day EMA at 158.44 and the 200-day EMA at 155.10, with Stochastic RSI near the mid-50s.
We are seeing a familiar picture as USD/JPY pushes toward 170.00, which feels very similar to when the pair was stuck below the 160.00 level this time last year in 2025. The fundamental problem has not changed, as the gap between U.S. and Japanese interest rates remains the primary driver of yen weakness. The Federal Reserve’s policy rate is holding firm at 4.50%, while the Bank of Japan has only edged its rate up to 0.10%.
Just as 160.00 acted as a line in the sand, strong verbal warnings from Japanese officials suggest 170.00 is the new critical level to watch. We must remember the sharp, multi-yen drops that followed official intervention after the pair broke 150 in 2022 and the volatility we saw after 160 was breached last year. This history suggests that buying far out-of-the-money call options is extremely risky, as a sudden move by authorities could make them worthless overnight.
Options Strategies And Volatility
The upcoming economic data will be decisive for the next move, just as it was in 2025. With recent US Core PCE inflation proving sticky at 2.8%, the Federal Reserve is unlikely to signal any new rate cuts soon, keeping the dollar supported. Although Japan’s national inflation is holding above the 2% target, the Bank of Japan’s cautious stance continues to weigh on the yen, leaving the path of least resistance pointed higher.
This tension between a steady uptrend and the threat of sudden intervention is causing implied volatility in the options market to rise. This environment makes selling short-dated strangles appealing, as traders can profit if the pair remains contained below 170.00. However, this strategy carries significant risk should there be a sharp breakout in either direction.
For those wanting to maintain a bullish bias while managing the enormous risk of intervention, using option spreads is a sensible approach. A bull call spread, for example, allows us to profit from a continued grind higher but defines our maximum loss if the government steps in and sends the pair tumbling. This strategy provides a way to stay in the trade without exposing ourselves to an account-destroying move.
NZD/USD fell 0.4% on Tuesday and closed near 0.5885, after reaching about 0.5925 and failing again at 0.5900. It moved in a 65-pip range between 0.5860 and 0.5925, with lower highs forming as early strength faded.
In New Zealand, focus shifts to an RBNZ speech by Breman on Wednesday and the ANZ-Roy Morgan consumer confidence release on Thursday. The prior confidence reading was 91.3, while the Iran conflict has pushed up commodity prices and freight costs, and Australia’s PPI is due on Friday.
Fed Event Risk And Us Data
In the US, the Federal Reserve decision is due at 18:00 UTC on Wednesday, with rates expected to stay at 3.50% to 3.75%. Attention is also on Thursday’s US Q1 GDP and Core PCE, with Core PCE forecast at 3.2% year-on-year versus 3% previously.
On a 15-minute view, the pair stayed below the daily open at 0.5915, with Stochastic RSI near 44. On the daily chart, it traded around 0.5885 above the 200-period and 50-period EMAs near 0.5850 to 0.5860, while Stochastic RSI sat near 74.
Looking back to mid-2025, we saw the US Dollar strengthen significantly into that year’s Federal Reserve meetings. The hawkish tone from the Fed, driven by persistent inflation from the Iran conflict, did push NZD/USD below the 0.5850 support level we were watching. That downward pressure continued through the second half of 2025 as the Fed held rates firm.
The environment has since changed dramatically as we approach May 2026. Geopolitical tensions eased late last year, causing oil prices to recede and helping cool global inflation. US Core PCE inflation has now fallen to 2.7% as of the March 2026 report, a significant drop from the 3.2% feared in 2025.
Rbnz Fed Divergence And Kiwi Bias
This has created a clear policy divergence between the central banks. The RBNZ, facing weaker domestic data like the ANZ consumer confidence number which currently sits at a subdued 85.1, already cut its official cash rate to 5.25% in February. The Federal Reserve, however, is only now signaling a potential first rate cut this summer, creating a tailwind for the Kiwi dollar.
Given this outlook, traders should consider positioning for further NZD/USD strength. Buying call options with a strike price around 0.6150 expiring in the next two to three months offers a way to profit from a continued rally with a defined risk. This strategy capitalizes on the shifting interest rate differential favoring the New Zealand Dollar.
Alternatively, using bull call spreads can reduce the upfront cost of getting long exposure. For instance, buying a 0.6100 call and selling a 0.6250 call would position for a steady, but not explosive, move higher. This reflects the view that while the trend has turned, the rally will be gradual as we await confirmation from upcoming US employment and inflation data.
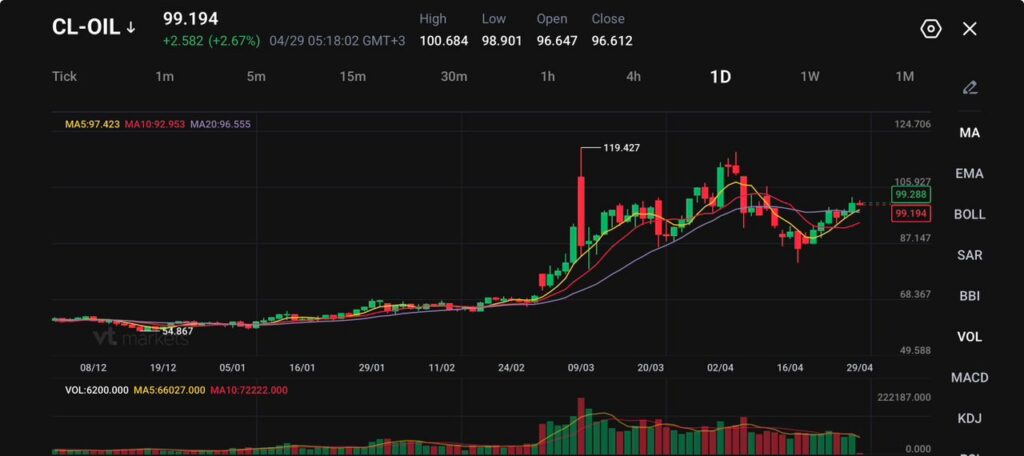
CL-OIL traded at 99.194, up 2.582 points, or 2.67%, after reaching a session high of 100.684.
Brent crude futures for June rose 52 cents, or 0.47%, to $111.78 a barrel at 0154 GMT, climbing for an eighth day.
WTI futures for June rose 57 cents, or 0.57%, to $100.50 a barrel after gaining 3.7% in the previous session.
API data showed US crude stocks fell by 1.79 million barrels in the week ended April 24, while gasoline inventories fell by 8.47 million barrels and distillates fell by 2.60 million barrels.
Oil prices extended their multi-day rally on Wednesday after reports said the US would extend its blockade of Iranian ports. The move raises the risk that supply disruptions from the Middle East will last longer than markets had priced only days ago.
US President Donald Trump has instructed aides to prepare for an extended blockade of Iran, according to reports citing US officials. The plan would continue to squeeze Iran’s economy and oil exports by preventing shipping to and from its ports. Brent crude futures for June rose 52 cents, or 0.47%, to $111.78 a barrel at 0154 GMT, climbing for an eighth day.
Even as Wall Street bets on oil staying above $100 amid dwindling stockpiles and a near-shuttered Strait of Hormuz, some traders are buying options to hedge against a sudden US-Iran deescalation https://t.co/zcXtTW3SIC
The June contract expires on Thursday, while the more active July contract traded at $104.84, up 0.4%. WTI futures for June rose 57 cents, or 0.57%, to $100.50 after gaining 3.7% in the previous session, climbing for seven out of the last eight days.
This keeps crude in a headline-driven market. Traders are not only reacting to current supply loss. They are also pricing the chance that the blockade forces more shipping delays, higher insurance costs, wider freight spreads, and deeper inventory draws.
If Trump extends the blockade, supply disruptions could worsen and keep pressure on crude prices upward.
Hormuz Keeps The Supply Shock Alive
The ceasefire in the US-Israeli war with Iran has not delivered a clean peace path. The conflict remains deadlocked as both sides push for a formal end to the fighting. Iran continues to shut shipping flows through the Strait of Hormuz, while the US keeps its blockade on Iranian ports.
Trump said Iran has asked the US to lift a naval blockade of the Strait of Hormuz while the two sides negotiate an end to the two-month war, which has upended global energy supplies https://t.co/Z9WQ7x3ajm
Hormuz remains one of the most important energy chokepoints in the world. The strait carries about 20% of global oil and liquefied natural gas supplies. The IEA said LNG transiting the Strait of Hormuz reached just over 112 bcm in 2025, equal to almost 20% of global LNG trade, with no alternative route for Qatar or the UAE to supply global LNG markets through existing liquefaction facilities.
The US wants an end to what it calls Iran’s nuclear weapons programme. Iran is demanding some form of reparations from the latest round of fighting, an easing of economic sanctions, and some form of control over the Strait of Hormuz. That gap leaves oil exposed to every diplomatic headline.
For traders, this means the ceasefire is not enough by itself. Crude needs signs of real maritime reopening, not just lower military activity. Until then, each failed negotiation can feed a fresh risk premium into Brent and WTI.
Inventory Draws Tighten The Market
The supply story is now showing up in inventories. Market sources said the American Petroleum Institute reported that US crude oil inventories fell for a second week. Crude stocks fell by 1.79 million barrels in the week ended April 24. Gasoline inventories fell by 8.47 million barrels, while distillate inventories fell by 2.60 million barrels.
Those numbers sharpen the bullish case for oil. A crude draw points to tighter supply. A large gasoline draw points to stronger fuel pressure ahead of the summer driving season. A distillate draw adds stress to diesel, freight, industry, and heating-linked demand.
American imports of used cooking oil from China are set to accelerate as increased US biofuel-blending requirements kick in and the Iran war drives up energy costs, making the feedstock a relative bargain https://t.co/KODciyfL9e
The market may now treat any fresh inventory draw as confirmation that the Hormuz shutdown is pulling barrels out of the system. If official data confirms the API trend, crude may find stronger support on dips. If the data reverses and shows a surprise build, traders may take profit after the sharp run higher.
Inflation Risk Spreads Across Assets
Oil above $100 changes the market conversation. Higher crude can lift transport costs, production costs, power costs, and fuel prices. That can slow the path back toward lower inflation, even if demand starts to cool.
The World Bank has forecast a 24% surge in energy prices in 2026 due to the Middle East war. It also projected Brent crude could rise to $115 if the conflict persists or deepens, while developing economy inflation could average 5.1%, or reach 5.8% if the conflict continues.
The shock decision by the United Arab Emirates to quit OPEC blindsided its partners of six decades. Now the cartel will have to fight to stay relevant in a fast-shifting global oil market. https://t.co/MOaps1uR59
That gives crude a wider market impact. A sustained oil rally can support energy shares, but it can pressure airlines, logistics firms, consumer stocks, and rate-sensitive equities. It can also support the US dollar if traders think the Federal Reserve will keep policy tighter for longer.
This does not mean every oil rally will hurt stocks at once. If higher crude prices reflect supply risk rather than stronger growth, equity traders usually become more cautious. If oil prices keep rising while central banks sound cautious about inflation, risk appetite may weaken.
Technical Analysis
CL-OIL is trading near 99.20, rebounding strongly from recent lows and pushing back toward the upper end of its short-term range after a period of consolidation. The bounce comes after a corrective phase from the 119.40 peak, with price now attempting to rebuild momentum just below the 100 psychological level.
From a technical standpoint, the structure is shifting back toward bullish in the near term. Price has reclaimed the 5-day (97.42) and 10-day (92.95) moving averages, both of which are now sloping higher and providing immediate support. The 20-day (96.55) sits just below current price and is beginning to stabilise, suggesting the broader pullback may be losing strength.
Key levels to watch:
Support: 97.40 → 96.50 → 92.90
Resistance: 100.00 → 105.90 → 110.00
Price is now pressing into the 100.00 resistance zone, which is acting as a key pivot. A clean break and hold above this level could open a move toward 105.90, where previous highs and supply sit. Momentum through that region would suggest a broader continuation back toward the 110 area.
On the downside, 97.40 is the first level to watch for support. A break back below this zone would weaken the current recovery and expose 96.50, with deeper downside risk if sellers regain control.
Overall, oil is attempting to re-establish upward momentum after a pullback, with the 100 level acting as the immediate battleground. Price action around this zone will likely dictate whether the market resumes its broader uptrend or slips back into consolidation.
Cautious Forecast
The near-term bias stays bullish while CL-OIL holds above 96.555 and 97.423. A daily close above 100.684 would strengthen the case for a move toward 105.927, especially if the US confirms a longer blockade and inventory draws continue.
A failed break above $100 would warn that traders are taking profit after the seven-out-of-eight-day WTI rally and the eighth straight gain in Brent. A drop below 96.555 would shift focus back to 92.953. If peace talks improve or the Strait of Hormuz starts reopening, crude may lose part of its supply-risk premium quickly.
Learn more about trading Energies on VT Markets here.
Trader Questions
Why Are Oil Prices Rising?
Oil prices are rising because traders expect the US blockade of Iranian ports to last longer. Reports said President Donald Trump instructed aides to prepare for an extended blockade, which could further restrict shipping to and from Iran.
This comes while Iran continues to shut shipping flows through the Strait of Hormuz, a key route for about 20% of global oil and liquefied natural gas supplies.
How High Did Oil Prices Move?
Brent crude futures for June rose 52 cents, or 0.47%, to $111.78 a barrel at 0154 GMT. The June contract expires on Thursday, while the more active July contract traded at $104.84, up 0.4%.
US West Texas Intermediate futures for June rose 57 cents, or 0.57%, to $100.50 a barrel after gaining 3.7% in the previous session.
Why Is The Strait Of Hormuz So Important?
The Strait of Hormuz is one of the world’s most important energy routes. Around 20% of global oil and liquefied natural gas supplies usually move through it.
If shipping remains blocked, buyers may face tighter supply, higher freight costs, higher insurance costs, and longer delivery delays. That can add a supply-risk premium to oil prices.
What Does The US Blockade Mean For Oil Supply?
An extended US blockade of Iranian ports could prevent shipping to and from Iran for longer. That would make it harder for Iranian oil exports to reach the market and could deepen supply disruption across the Middle East.
Haitong Futures analyst Yang An said if Trump extends the blockade, supply disruptions could worsen further and continue to push oil prices higher.
Why Is Oil Rising Even Though There Is A Ceasefire?
Oil is rising because the ceasefire has not produced a final peace deal. The US-Israeli war with Iran remains deadlocked, and both sides are still negotiating the terms for a formal end to fighting.
Iran wants reparations, sanctions relief, and some form of control over the Strait of Hormuz. The US wants an end to what it claims is Iran’s nuclear weapons programme. The gap between both sides keeps oil exposed to fresh headline risk.
Start trading now – Click here to create your real VT Markets account
Written on April 29, 2026 at 4:17 am, by josephine
AUD/USD ended Tuesday almost unchanged at about 0.7180, after moving in a 70-pip range between 0.7130 and 0.7200. It touched 0.7200 early in Europe, then returned towards 0.7180 ahead of Wednesday’s inflation data.
Australia’s Consumer Price Index is due at 01:30 UTC on Wednesday. Headline CPI is forecast at 4.7% year on year for March, up from 3.7%, and Trimmed Mean CPI is also being watched for policy signals from the Reserve Bank of Australia.
Key Events Ahead
The US Federal Reserve decision is due at 18:00 UTC on Wednesday, with the policy rate expected to stay at 3.50% to 3.75%. Attention is on guidance about inflation, including oil-related cost pressures tied to disruption in the Strait of Hormuz, and Friday’s ISM Manufacturing PMI is also ahead.
On a 15-minute chart, the pair is near 0.7180 and below the daily open at 0.7191, which acts as resistance. Stochastic RSI is near 15, while the daily chart shows price above the 50-day EMA at 0.7041 and the 200-day EMA at 0.6800, with Stochastic RSI near 79.
The current market inaction in AUD/USD reminds us of the tight consolidation we saw this time last year, in April 2025. Back then, the pair hovered around 0.7180 ahead of critical inflation data, much like the market is holding its breath now. Traders should be cautious of this quiet, as it often precedes a significant breakout.
We are watching for Australia’s quarterly CPI data, which is expected to show inflation remains persistent at 3.9% year-over-year, well above the RBA’s target. We remember in 2025 when a CPI jump to 4.7% fueled expectations for RBA rate hikes, and a similar outcome this week could trigger a sharp rally in the Aussie dollar. This backdrop suggests positioning for upside through call options could be a prudent strategy to capture a potential surprise.
Strategy Considerations
On the other side of the pair, the US Federal Reserve’s stance is creating uncertainty, just as it did in 2025 when the focus was on oil shocks. Today, with the Fed funds rate holding at a restrictive 4.75% and recent core PCE inflation still at 2.9%, any hawkish language from the Chair could strengthen the US dollar. This dual risk makes trading the directional break tricky ahead of the announcements.
Given the significant event risk from both central banks, implied volatility is rising. The situation mirrors the indecisive, small-bodied candles from last year, suggesting traders are unwilling to commit. A long straddle or strangle options strategy could be effective for playing the large move that is likely to come, without having to bet on the direction.
With the pair currently trading near 0.6750, the key support level to watch is the 50-day moving average around 0.6680. In 2025, we saw dip-buyers emerge at a similar technical floor, and we would expect that level to hold to maintain the near-term bullish bias. A break below this support would signal a more significant downturn and could trigger stop-loss orders.
Ireland’s consumer confidence fell to 53.3 in April. This was down from 56.7 in the previous reading.
The change marks a drop of 3.4 points month on month. The latest figure remains above 50.
Irish Consumer Confidence Outlook
The April drop in Irish consumer confidence from 56.7 to 53.3 is a clear signal of growing economic concern among households. This suggests we should prepare for a potential slowdown in domestic spending over the coming months. This sentiment is likely a reaction to stubborn inflation, which, despite easing from its peaks, was still reported at 2.9% in the latest figures from the CSO.
This consumer anxiety aligns with recent retail sales data, which showed a volume decrease of 0.5% in the last reported quarter. With the European Central Bank maintaining its benchmark interest rate at 4%, high borrowing costs continue to pressure family budgets. We see this combination of factors as a headwind for the Irish domestic economy.
For us, this points towards taking a bearish stance on consumer-discretionary sectors. We should consider buying put options on the iShares MSCI Ireland ETF (EIRL) as a broad play on the market. This strategy allows us to profit from a potential downturn in the main Irish index over the next few weeks.
We remember a similar, though less severe, confidence dip back in the third quarter of 2025, which preceded a disappointing earnings season for retail and hospitality stocks. That historical pattern suggests the market may be slow to price in the impact of this weakening sentiment. It reinforces the case for securing downside protection or initiating bearish positions now.
This environment of increased uncertainty also implies a rise in market volatility. Trading strategies that benefit from price swings, such as purchasing straddles on key domestic stocks like AIB or Bank of Ireland, could be prudent. Such positions would pay off if the stocks make a significant move in either direction as new economic data is released.
Positioning And Risk Targeting
It is critical, however, to differentiate between domestically-focused firms and Ireland’s large, export-oriented multinationals. Companies with significant global revenue streams will be far more insulated from a local spending slump than those dependent on the Irish consumer. Therefore, any short positions should be targeted with precision toward the most vulnerable sectors.