Daily Market Analysis
Market Focus
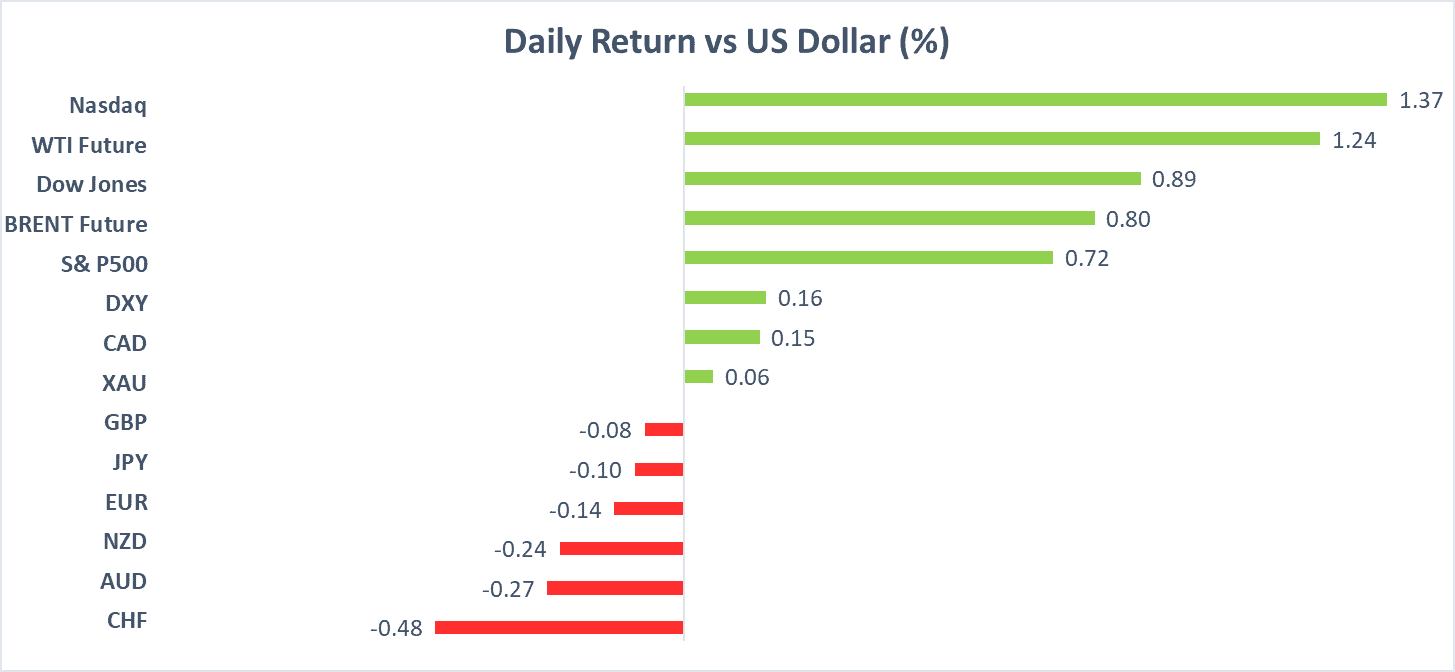
U.S. market was fluctuating with mixed information. Dow Jones gained as investors considered more earning results and potential outcomes for coronavirus- related stimulus. Despite of failing to make progress on a new coronavirus stimulus plan last week, raising the uncertainty about U.S. economy recovery, investors kept up their hope on the market. Technology shares fell as market participants were uncertain amid tensions between the U.S. and China. Moreover, oil price continues to rise after Saudi Aramco announced that the demand for oil will be improved.
After the Trump administration attempted to ban WeChat and TikTok, the U.S.- China tensions continue to escalate further. At the same time, China has decided to impose sanctions on 11 American citizens and other high- profile officials in response to U.S. behaviors including the executive order from President Trump on the sanction of a Hong Kong chief executive. The U.S. and China relation has intensified to the highest point; it is compelling to examine how global markets react amid tensions.
Market Wrap

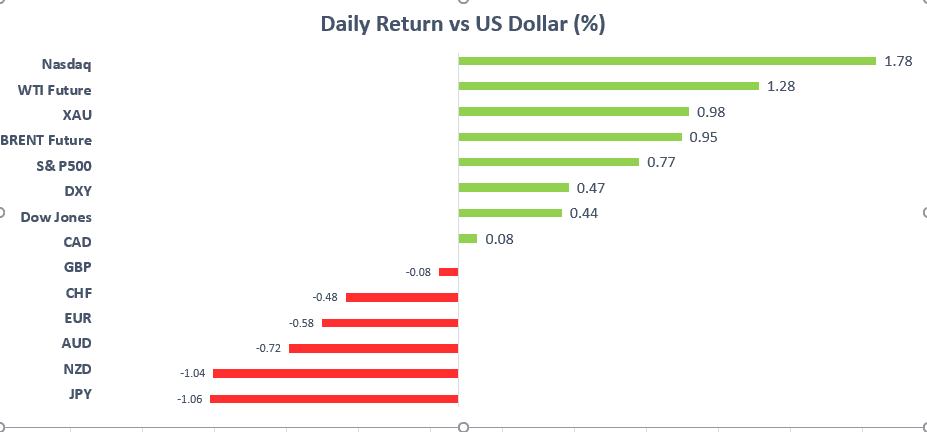
Main Pairs Movement
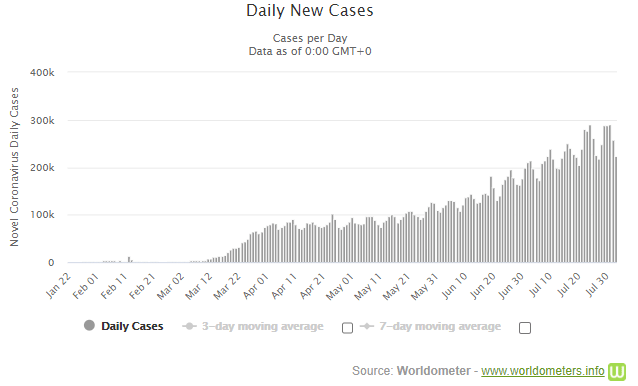
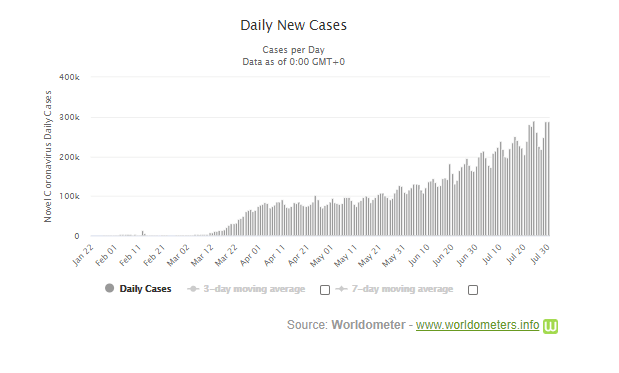
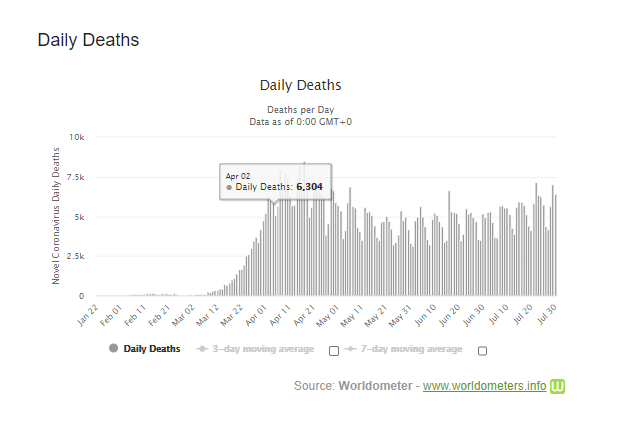
EURUSD drops as the dollar comebacks to the game. EURUSD has dipped below 1.1750 and is back to the consolidation zone thereafter. EUR has been in the bearish momentum after the U.S. JOLTS Job Opening report from today and the Nonfarm Payroll data from last week. Moreover, the dollar is held by the situation of COVID-19 in the U.S.; COVID-19 flareups seem to become moderated recently. Cases in the U.S. is now leaning lower while the pace of new deaths is showing signs of dropping as well. Although the pandemic situation in the U.S. is still worse than that in Europe, but the gap is becoming narrower. That being said, the main driver for the dollar will depend mainly on future stimulus arrangements.
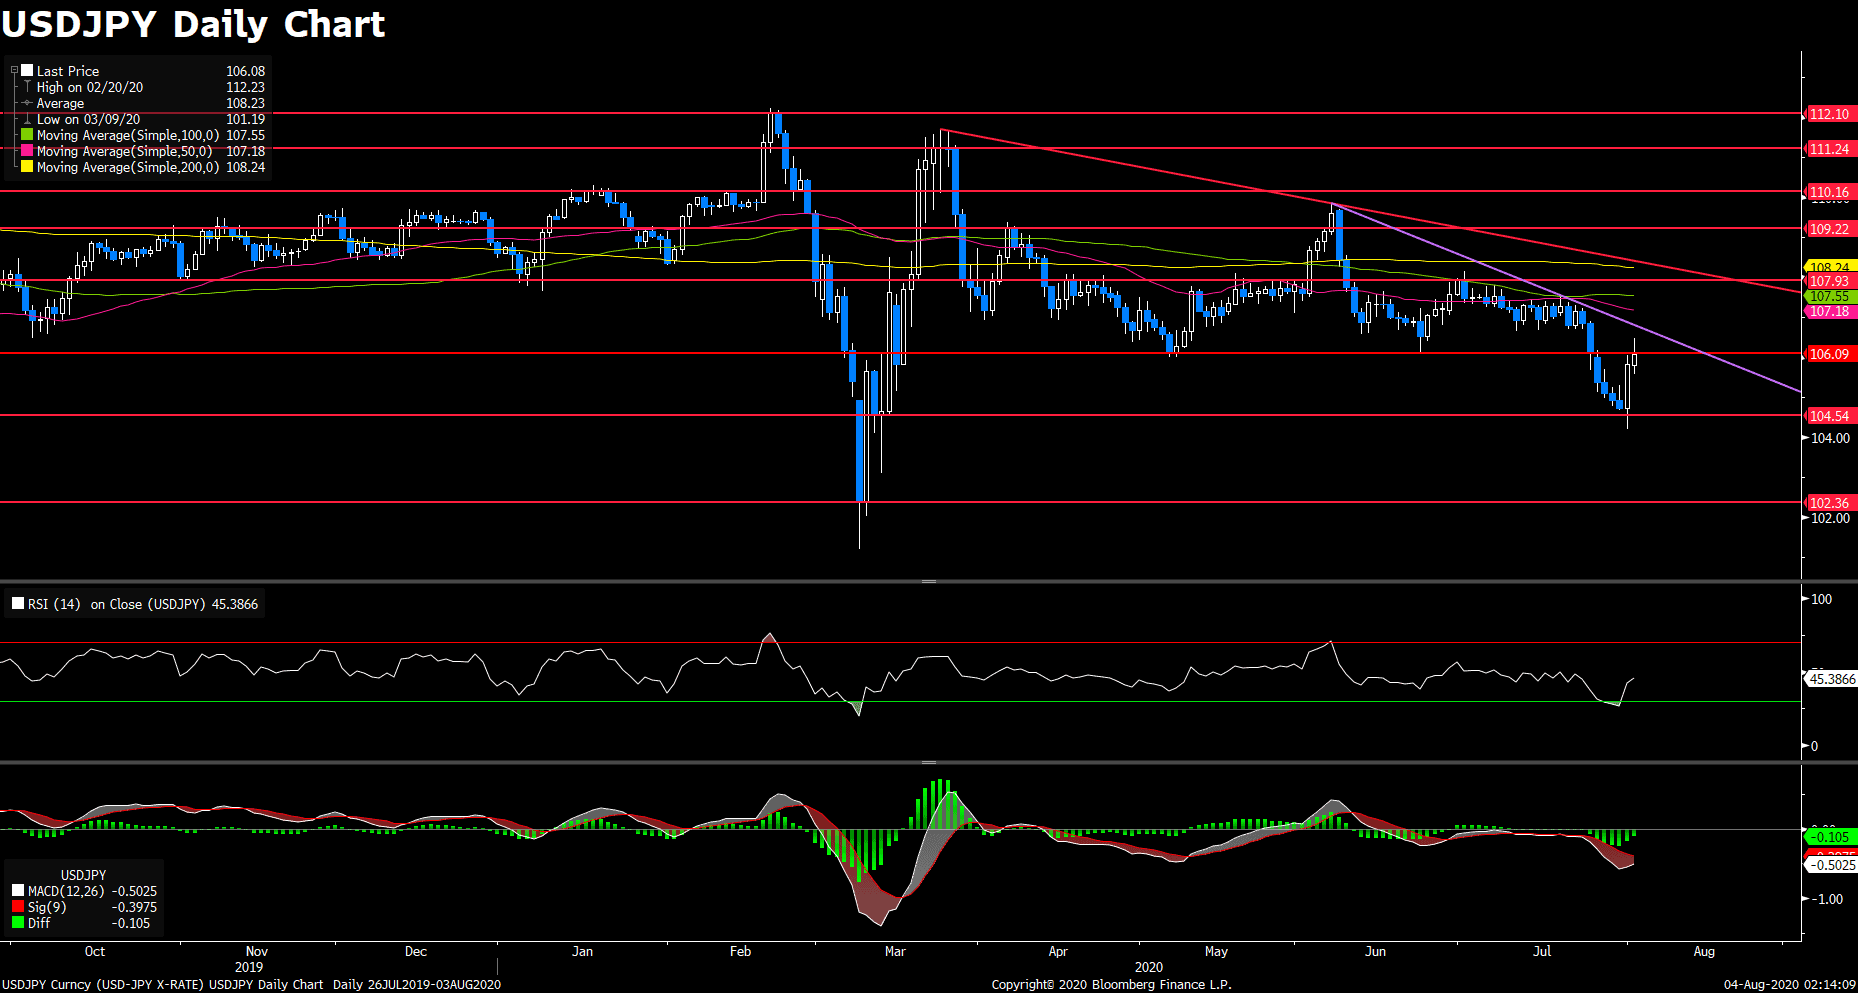
USDJPY is fluctuating in a tight range. The dollar has once strengthened to its highest level at 106.21. The dollar is upheld by a 1.8 million rise on the Nonfarm Payrolls in the U.S., making the dollar preserve its bullish momentum at the start of the week. However, Japanese Yen will likely be featured by Japanese Bank Lending program and trade balance data during early Asian session on Tuesday.
The dollar appreciated 0.6% against the Franz on a daily basis, trading at its highest level in a week at 0.9176 as of writing. The Franz was dragged by the unchanged unemployment rate of 3.3% in July in Switzerland, which was lower than the market expectation of 3.1%. Contrarily, the dollar was boosted and reflected by the Nonfarm Payrolls and the JOLTS Job Openings data in July. With all those conditions, it is difficult for the Swiss Franz to stay strong against the dollar.
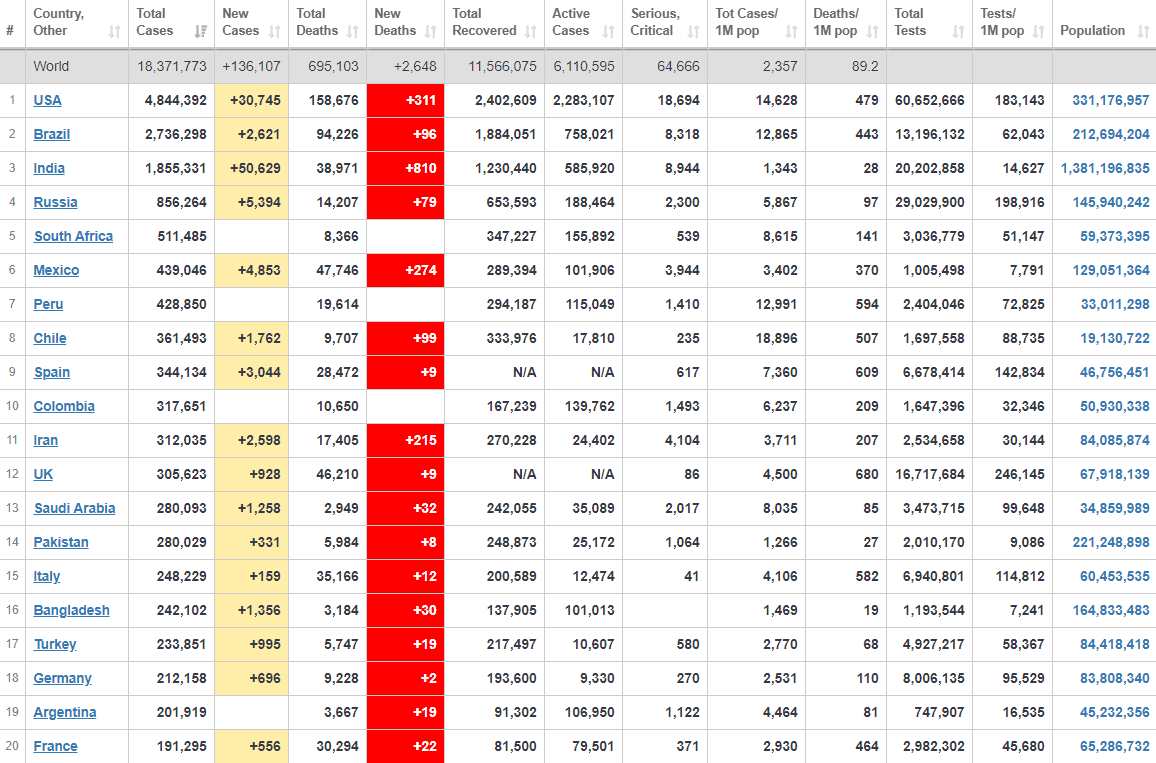
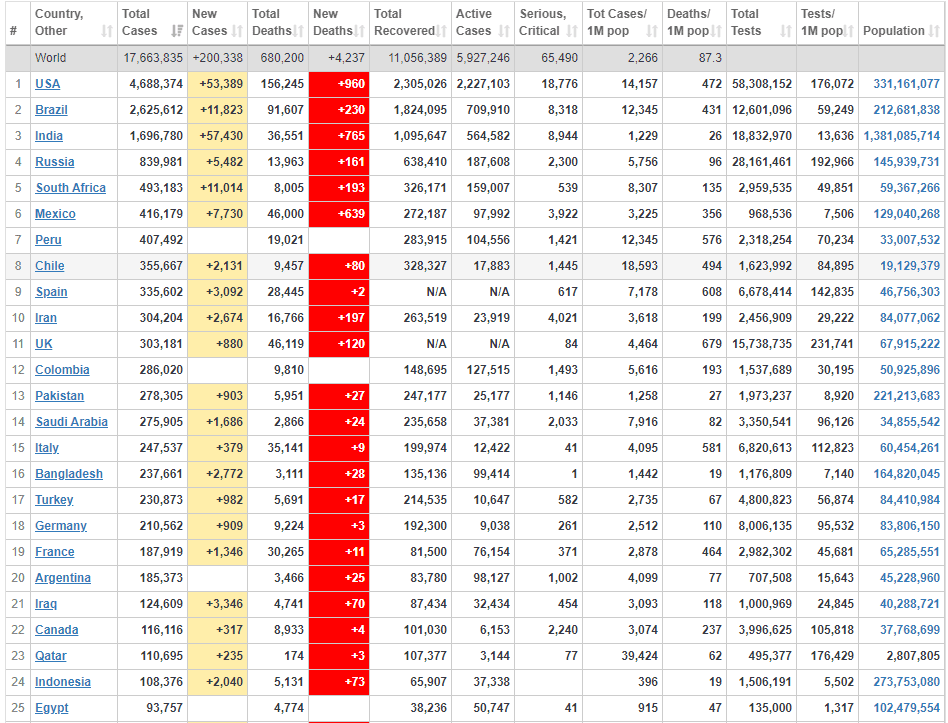
COVID-19 Data (EOD):


Technical Analysis:
EURUSD (H4)

EURUSD is currently trading at 1.1742 during the U.S. session as of writing. The pair has failed to challenge its resistance level at 1.1802, then it retains its bearish stance after-ward. EURUSD continues to maintain in the negative territory since the RSI is currently only at 38 mark in the 4- hour chart. In the meantime, the pair is trading firmly below the 20 SMA. Now, the pair is testing its support level at 1.1742; if it successfully breaks through, it will likely continue to decline.
Resistance: 1.1802, 1.1847, 1.1900
Support: 1.1776, 1.1742, 1.1720
USDJPY(H4)

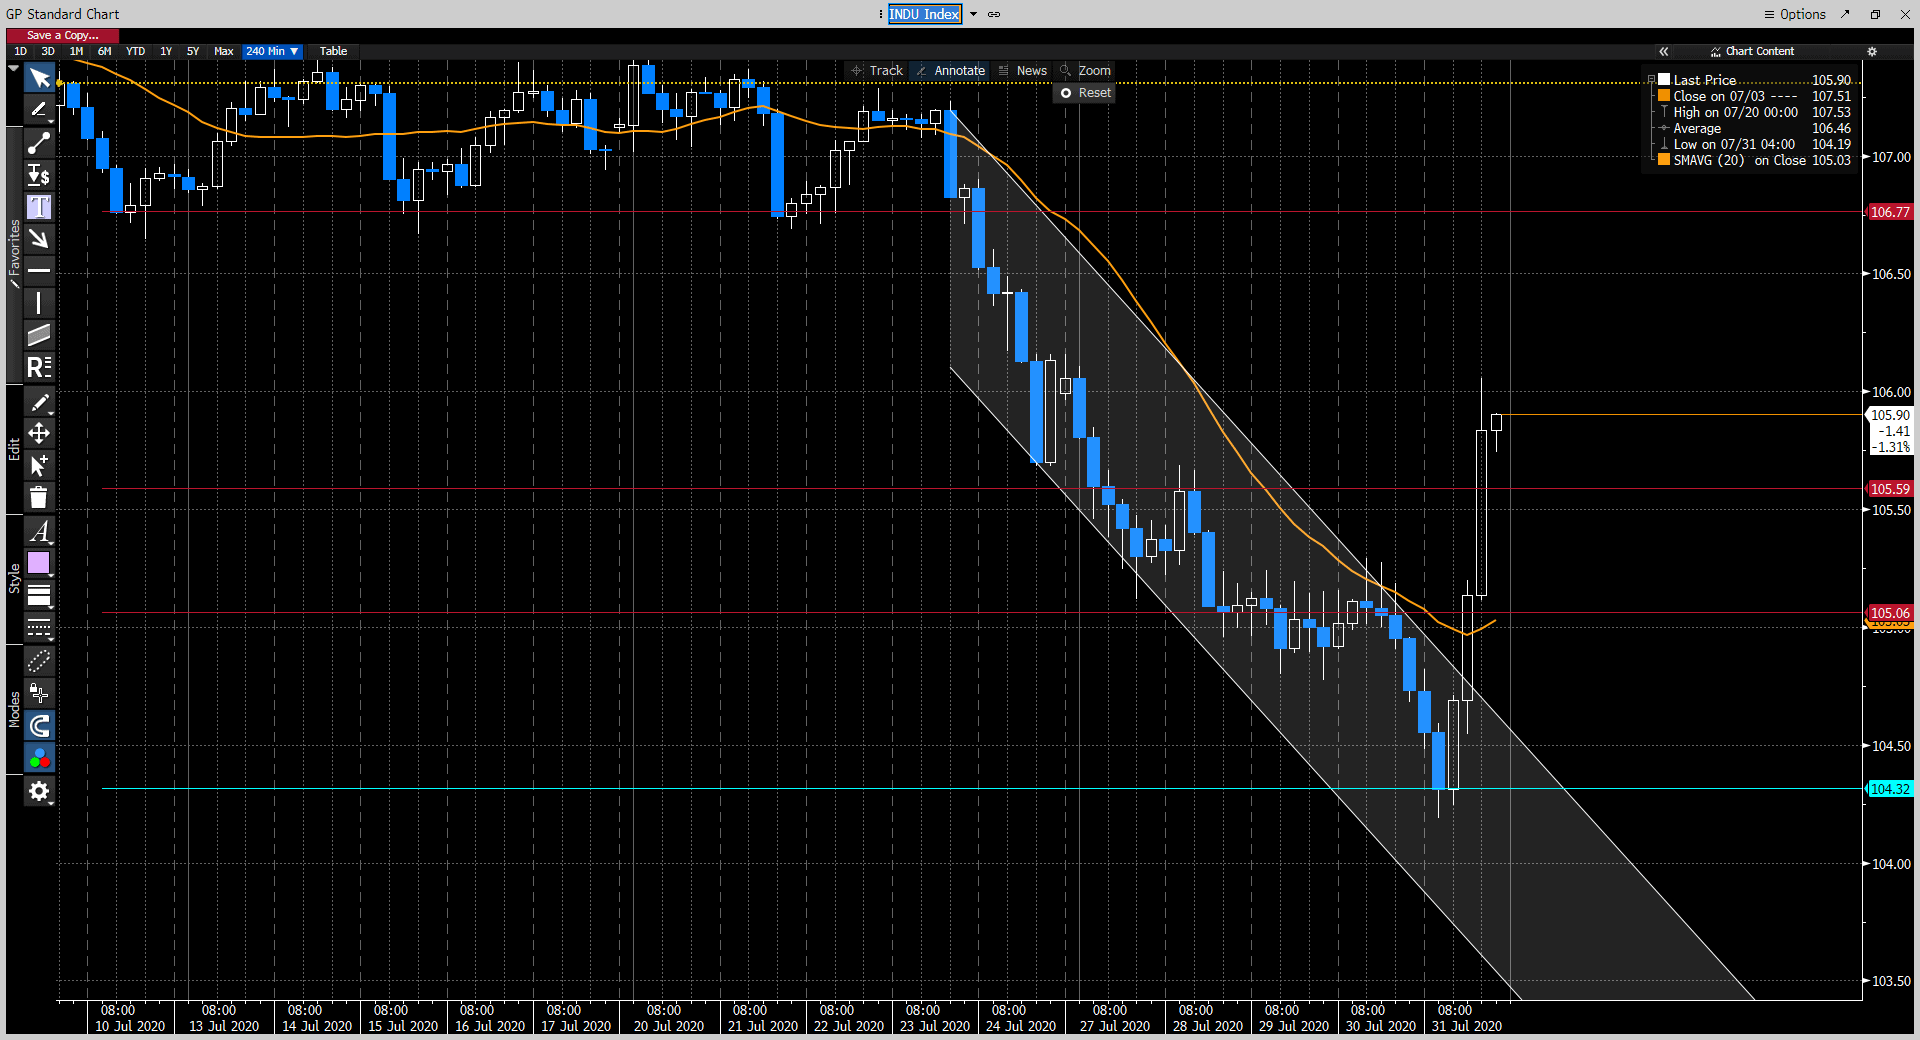
USDJPY is currently trading at 105.94 during the U.S. session. The pair seems to be neutral and in a consolidation area for nearly a week in the 4- hour chart. Moreover, the pair holds just above the midlines, but lack of strength to challenge its resistance level at 106.18. It is expected to see the pair to keep up its neutral tendency from the perspective of the RSI indicator, currently holding at 58 mark.
Resistance: 105.06, 105.53
Support: 106.18
USDCHF (H4)

USDCHF is currently trading at 0.9157 during the U.S. session, and it once reached its highest level at 0.9178, the resistance level; afterward, the pair goes into a consolidation zone. Both indicators and fundamentals suggest that the dollar is rising against the Swiss Franz. The RSI indicator is currently at 56 mark, which implies that the pair has not reached the position of overbought yet. In the meantime, the pair is firmly trading above the 20 SMA in the 4- hour chart.
Resistance: 0.9218, 0.9386
Support: 0.9066
Economic Data