Sep 23,2020

Daily Market Analysis

Market Focus

U.S. stocks market gained some traction as dip buyers emerged after the market selloff, tempering concern over remarks from Federal Reserve officials that pointed to a slow economic recovery. Most groups in the S&P500 advanced, with retailers and tech companies among the biggest gainers. The Nasdaq 100 notched a back-to-back rally, while the Dow Jones Industrial Average underperformed amid a drop in banks.

Nonetheless, American stocks are still heading toward their first monthly slide since March as concerns over Congress not reaching any agreements on another fiscal stimulus package are growing. At the same time, an increase in global virus cases has hinted a possible second round of lockdowns across nations might take place soon. For instance, the British Prime Minister Boris Johnson recently announced new restrictions that are likely to last for another six-month, stating that the country is at a perilous turning point for the virus and that people should try to work from home if possible.


Market Wrap


Main Pairs Movement

The greenback has been made a fresh daily high, breaking up from consolidation in the DXY to test the 94 area as risk appetite take a turn for the worst in the last full week of the trading month. Additionally, the Fed reiterated its low-for-longer stance without providing further stimulus, making the U.S. equities investors less committed to risky investments, and in turn, has helped the USD to regain its safe haven bid.

GBPUSD bears stay on top, taking the pair down in the largest monthly percentage drop since March, Brexit, Covid-19 cases, negative rate sentiment, and risk-off environment playing in the hands of the bears.

After spending the first half of the day moving sideways near 104.50 area, the USDJPY pair gained traction in the U.S. session and advanced to a daily high of 105.07 before re-entering to a consolidation phase.


COVID-19 Data (EOD):


Technical Analysis:

EURUSD(H4)

In the EURUSD 4 hour chart, we see that the pair has fallen below the 1.1745 level and bottomed around 1.1689. The reason for this slide is that the second wave of coronavirus in Europe is beginning to take its toll on the shared currency. At the same time, fears of the slower growth hit EUR ahead of Markit preliminary PMIs estimates this Wednesday. Furthermore, as the SMAVG 15 crosses below SMAVG 60, the selloff of the EURUSD seems reasonable. However, with the pair’s RSI moving towards the 30 threshold, it appears that EURUSD may be entering the oversold area soon.

Resistance: 1.1766, 1.1745

Support: 1.1689, 1.1635


USDCAD (H4)

The Loonie pair preserved its bullish momentum after gaining more than 100 pips on Monday and touched its highest level since August 12th at 1.3349 Tuesday. Essentially, with the U.S. Dollar Index, which gained 0.6% on Monday, continued to extend its rally and rose above 94 for the first time since late July, the Loonie bulls pretty much dominate the pair’s price movement today. But, as the market sentiment turned positive on Tuesday, WTI bounced back from Monday’s plummet intensively, edging towards $40 a barrel, the bullish trend of the pair was offset slightly and retreated back to the 1.3300 area. Looking ahead, USD’s Fed Chair Powell’s testification and crude oil inventories data are going to be significant determinants for the USDCAD’s near-term movement.

Resistance: 1.3350, 1.3388

Support: 1.3280, 1.3238


AUDUSD (H4)

The Australian dollar came under strong selling pressure amid resurgent demand for its American rival. Despite the recovery in market sentiment, the bulls of AUDUSD remains unable to fight off the strengthened USD. By looking at the pair’s RSI, we can see that the pair has gradually decline towards the 30 threshold, suggesting the pair could be entering the oversold region in the near-term. On the downside, a strong support at 0.7155, which is a price level that was once a resistance level, we expect the pair will bounce back from this price level until any further bearish news exacerbates the downward momentum.

Resistance: 0.7227, 0.7266

Support: 0.7155, 0.7136, 0.7092


Economic Data

Sep 22,2020

Daily Market Analysis

Market Focus

On Monday, Stocks trimmed losses as a rebound in tech giants tempered concern over cloudy prospects for more economic stimulus and a report detailing suspicious transactions at global banks. Treasuries and the dollar climbed.

After approaching the threshold that many investors consider to be a market correction, the S&P 500 came off session lows as the Nasdaq 100 climbed. Commodity, industrial and financial shares still led the benchmark gauge to its lowest in almost two months. American Airlines Group Inc. paced losses in travel companies on worries that an increase in virus cases could prompt further lockdown measures.

Equities extended their September selloff, while the eruption of a partisan battle over replacing Supreme Court Justice Ruth Bader Ginsburg damaged already-slim prospects for another round of fiscal stimulus. Speaker Nancy Pelosi and House Democrats released a stopgap government funding bill without support from the White House or Senate Republicans — raising the risk of a federal shutdown at the end of the month.

As U.S. deaths related to Covid-19 approached 200,000, former Food and Drug Administration Commissioner Scott Gottlieb said he expects the nation to experience “at least one more cycle” of the virus in the fall and winter. Germany’s health minister warned that the trend of cases in Europe is “worrying” amid expectations that restrictions could soon be extended to London.


Market Wrap


Main Pairs Movement

Greenback advanced by the most in three months as a slump in global stock markets and concern about rising Covid-19 cases drove demand for haven assets. The greenback surged up all of its major developed-market peers and DXY index hovered .6% around the end of the trading day and putting it on course for its largest one-day rally since June. Japanese yen and the Swiss franc that both often seen as haven currencies also outperformed riskier counterparts.

Data from the CFTC which shows positioning through last Tuesday had also indicated an accompanying increase in speculative positioning against the greenback. Meanwhile, treasuries climbed, implied volatilities rose across currencies and tenors on political uncertainty in the U.S.


COVID-19 Data (EOD):


Technical Analysis:

GBPUSD(H4)

GBPUSD is trading around 1.2820 region, which wiped off the last consolidation. Sterling was hit by comment of concern amid second wave of the virus pandemic, official member who said that if current trend of rising cases continue then it will expect to outstrip 50k in mid-Oct. according to statement, U.K. Prime Minister is reportedly considering another national two-week lockdown to stop the outbreak happen. For short-term technical outlook, it seems constitue a range-walk in consolidation tunnel between 1.277 and 1.3 as the codify cap and floor.

Resistance: 1.2847, 1.3

Support: 1.2775, 1.2717


USDJPY (H4)

Loonie pair broke above 1.33 on Monday which touched its highest level in six weeks at 1.3321. meanwhile, there is no majority eco news, but the broad-based USD strength combined with the heavy crude oil sell off today that fueled it went up. Moreover, loonie breakthrough a critical resistance at 1.325 around that prop up the market position to another bullish momentum. For RSI indicator, its once approach 70 as a over bought zone then back down a little bit to 69 around while writing.

Resistance: 1.3349, 1.3388

Support: 1.3248, 1.32


XAUUSD (H4)

Gold currently trading at 1912 which rebound from intraday low in 1882 and its worst performance since last month. However, gold market surprisingly slipped while risk-off sentiment spread in global shares market. As the yesterday movement, it almost tested last lowest level in August beginning in 1863. On the other hands, RSI index reverse from over sought area to 32 but short-term and long-term MA is consecutive upwind at the moment.

Resistance: 1921.68, 1940.84

Support: 1902.7, 1881.58


Economic Data

Notification of Middle Autumn & National Holiday in 2020

Dear Client,

Please kindly note that we will have the Middle Autumn & National Holiday from 1st, October to 11th, October. During the Asia Holiday, business is running normally.

Thank you for your understanding and wish you & your family a happy Mid-Autumn Festival.

If you have any questions, our team will be glad to answer your questions.Please mail to [email protected] or contact the service online.

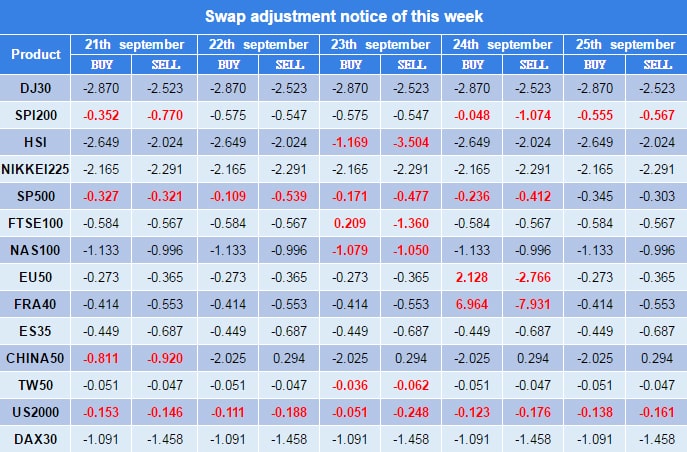
VT Markets The Adjustment Of Weekly Swap Notification

Dear Client,

Warmly remind you that the component stocks in the stock index spot generate dividends. When dividends are distributed, VT Markets will make dividends and deductions for the customers who hold the trading products after the close of the day before the ex-dividend date. After the adjustment, it will be reflected in the swap along with the swap cost of the product you hold.

Please note the specific adjustments as follows:

If you have any questions, our team will be happy to answer your questions.Please mail to [email protected] or contact the service online.

VT Markets Notification of Server Upgrade

Dear Client,

As part of our commitment to providing the best reliability and service to our customers, we are planning an upgrade in our server on Sep 19th – 20th, 2020.

As a result, we will be conduct maintenance according to the schedule below.
Start date and time: 2020-09-19 01:30 GMT+3(Server time)
End date and time: 2020-09-20 06:00 GMT+3(Server time)

The impact can only make customers be unable to log in to the MT4 software temporarily, and that won’t affect any order which has been opened.

No action is required by our customers. Your services will come back online at the end of the maintenance.

Thank you for your patience and understanding with regard to this important initiative.

If you have any questions, our team will be happy to answer your questions.Please mail to [email protected] or contact the service online.

Sep 15,2020

Daily Market Analysis

Market Focus

According to Bloomberg’s observation, the equity market continues to rise amid a flurry of deal activity and signs of progressive toward a coronavirus vaccine. Oracle Corp., in particular, rose 4.3% on reports that indicate the company is beating Microsoft Corp. in acquiring Tik Tok’s United States operations. On the other hand, stock price of Immunomedics Inc. almost doubled after Gilead Sciences Inc. agreed to purchase the cancer drug maker for $21 billion.

As a result, the S&P 500 reached a week high while the Nasdaq 100 broke a two-day slide. Nevertheless, Chief Executive Officer of Pfizer Inc. claimed that it is unlikely for the U.S. to deploy Covid-19 vaccine to the public before year-end. This information might deter the market’s sentiment as it is basically hinting a further delay in the U.S. market recovery.

Looking ahead, one extremely anticipated mega-merge of UBS Group and Credit Suisse is currently growing in its possibility as people who are familiar with the matter pointed out the UBS chairman has been studying the feasibility and approaches to complete this task.


Market Wrap


Main Pairs Movement

EURUSD is trading near the 1.19 threshold as the markets are becoming optimistic about the development of a coronavirus vaccine and shrugging off the rising European cases. GBPUSD dipped below 1.2850, failing to gain traction that is created by the market optimism. Additionally, ahead of a critical debate in parliament that will discuss a controversial deal that violates the Brexit, potential, major fluctuation in GBP can be expected. AUD rises against the USD by the end of the American session, in response to the positive tone of Wall Street. The USDCAD pair increased towards 1.3200 amid failing crude oil prices but turned flat on the day near 1.31700 at the time of writing.


COVID-19 Data (EOD):


Technical Analysis:

NZDUSD(H4)

NZDUSD is edging higher on Monday after closing the previous week modestly lower. After the markets turn optimistic on Monday, the risk-on sentiment strengthen the U.S. stock markets, which in turn, makes it difficult for the greenback to find demand. Despite the fact that New Zealand economic data that showed the country’s Business Performance of Services Index has decreased from 54.4 in July to 46.9 in August, it seems like the market participants are generally ignoring it. The investors’ attention was largely capture by the risk-on sentiment across the U.S. stock market as the three Wall street indexes closes the day with moderate gains. A strong resistance for the Kiwi sits around the 0.6715 level as it was once a resistance for the pair and has now turned into a resistance. On the flip side, pice levels at 0.6685 and 0.6650 are likely to provide some cushion for the pair if the risk-on sentiment is overturned.

Resistance: 0.6780, 0.6745, 0.6715

Support: 0.6685, 0.6650, 0.6620


USDJPY(H4)

After rising and fluctuating between 106 and 106.3 regions in the past two weeks, the JPY finally fought back substantially as the pair is currently trading near 105.50 on Monday. This tumble was largely due to the risk-on sentiment that weigh down on the greenback. By looking at the pair’s RSI, we can see that the indicator is approaching the threshold at 30, suggesting the USDJPY is approaching the oversold area. Subsequently, we expect the bulls to step in and stage a bounce back from the short-term price dip in the near terms.

Resistance: 106.25, 106.45

Support: 105.60, 105.30, 104.85


XAUUSD(H4)

On Monday, the bulls for XAUUSD has, once again, attempted to break through the critical resistance level in 1965. Considering the fact that the USD has lost its demand across global investors as a risk-on appetite broke out amid markets’ optimism, XAUUSD’s bullish momentum might gain some traction and break above the 1965 threshold. However, with a strong Monday U.S. equity market performance, the short-term surge of the yellow metal might be undermined. Looking ahead, if the gold were pulled back under the 1950 level, it is likely that a fall towards 1924 support would be accelerated. But if the pair can break through the 1968 level, then a rally towards the psychological resistance around 2000 is quite possible.

Resistance: 1968, 1995

Support: 1938, 1924


Economic Data

VT Markets The Adjustment Of Weekly Swap Notification

Dear Client,

Warmly remind you that the component stocks in the stock index spot generate dividends. When dividends are distributed, VT Markets will make dividends and deductions for the customers who hold the trading products after the close of the day before the ex-dividend date. After the adjustment, it will be reflected in the swap along with the swap cost of the product you hold.

Please note the specific adjustments as follows:

If you have any questions, our team will be happy to answer your questions.Please mail to [email protected] or contact the service online.

Sep 14,2020

Daily Market Analysis

Market Focus

U.S. shares continued to swing wildly after a five-month rally came to halt last week, putting the Nasdaq 100 on track for its worst week since March. The tech-heavy index traveled 3% from high to low Friday and was headed for the fifth loss in six days. It’s down 11% from its Sept.2 record. The rout comes after a torrid August capped a 59% rally from late March. Apple has plunged 16% from its 10-day old high, but remains only at the lowest in a month.


The S&P 500 was little changed, with three stocks higher for every one that fell. The Dow Jones industrial average advanced on rallied in Nike, Dow and Catepillar. Tech, the scene of fervent bullish options activity, gave up early gains for a second day, as investors assessed whether the pullback had run its course.


Global shares remain on track for the first back-to-back weekly declines since March after a rally that added $7 trillion to U.S. equity values. The pandemic is continuing to upend the global economy, with U.S. data showing cracks in recent labor-market strength and virus cases continuing to climb globally.


Market Wrap

Main Pairs Movement

Greenback pared a decline in quiet trade Friday afternoon while the pound was broadly lower as the European Union and the Kingdom remain in disagreement on important areas of Brexit treaty.

Euro dollar gain for a third day though is on pace to end the week little changed while spot trade positive 0.2% around to 1.184 that against to the day’s high of 1.1874. the euro gain despite a warning from European Central Bank chief economist Lane that its appreciation has dampened the inflation outlook.

Loonie rebound has started to waver as the prospect of a slowdown in the economic recovery and the risk of a second wave of Covid-19 has hurt the loonie of late. Oil’s weakness is also a factor in the currency’s 1.1% drop against the greenback this month. Other than this, loonie is among the best-performing G-10 currencies this year.


COVID-19 Data (EOD):


Technical Analysis:

EURUSD(H4)

euro dollar set around in the middle of the consolidation range between 1.18 to 1.1858 post ECB and in anticipation of the FOMC. The price will probably stay in this zone until the next Fed meeting on 16th September. According to RSI index, its near the neutral at 54 side that suggesting low fluctuation untill Fed meeting. 60-MA is slighlty down and 15-MA started turned up.

Resistance: 1.1858, 1.1895

Support: 1.18, 1.1768


GBPUSD(H4)

After sterling slumped to 3-month low, it little changed at 1.2797 on the market close. According to option market, risk reversals figures may have reached a short-term peak as the steeply drop to -2.5 of pound-dollar six-month risk reversals. For RSI index aspect, it kick-off to shrink in continuous over sought area to 27 around. Meanwhile, 60 and 15-MA remain upwind without reverse signal.

Resistance: 1.285, 1.2905

Support: 1.277, 1.27


XAUUSD(H4)

Gold remain choppy in slightly range that between 1918 to 1948.7 as first resistance and support. For RSI index perspective, figure shows it steady around neutral area at 50 and suggesting flat market ahead. Meanwhile, long-short MA mixed as 60-MA still remain little change in month. Other aspect, downtrend yellow line gave pressure to market status and seems convergence to market.

Resistance: 1948.7, 1968.19

Support: 1918.33, 1905.62


Economic Data

Sep 09,2020

Daily Market Analysis

Market Focus

After the holiday, the U.S. market plunged heavily. The Nasdaq fell as much as more than 4%, and it is down nearly 10% within three days; major technology companies tumbled as much as 15%, such as Tesla Inc. and Apple Inc. The sell off in risky assets has been concentrated on tech shares and momentum stocks, while credit has been more resilient. The huge sell off was caused by the speculative fever that drove previous bullish bets in options markets. As of now, investors are seeking for the safety of haven assets, which pushes Treasury yields lower and the dollar stronger as more demand in the greenback.

Oil price plummeted on Tuesday with the Brent oil slid to $40 a barrel, which is due to the concern of oil demand recovery is faltering. The situation of Covid-19 is still the biggest consideration, raising concerns about the short- term demand outlook. Today’s downward prices in oil potentially imply that investors worry about the future of oil demand and not just plays a bearish- bullish trading game.


Market Wrap

Main Pairs Movement

The dollar index extends the strength further north of the 93.5 mark. With the major sell off in stocks and oil, investors are now back to seek for the safety of haven assets, the dollar, resulting in a lower rate in the U.S. Treasury yields and a stronger dollar. The dollar can possibly advance to weekly tops over 93.5 and August high over 94.0.

EUR/USD extends the slide below 1.1800 today. The pair faces the pressure as the dollar boosts. Besides, potential movement of EUR/USD is also driven by the European Central Bank (ECB) meeting. According to the Eurostat, overall euro area economy contracts  14.7% on a yearly basis in Q2; despite of performing slightly better than the expectation, 15%, the data fail to help the euro dollar find demand, thus performing weaker against the dollar today.


COVID-19 Data (EOD):


Technical Analysis:

EURUSD(H4)

EUR/USD extends its downward trend from last week. As of writing, the pair is trading at 1.1785 during American session. In the 4- hour chart, the pair merely broke through the support level at 1.1786, and slightly bounced back later. Nonetheless from the technical perspective, it is expected to see the euro dollar continupusly behave weaker against the dollar because of the signals from both MACD histogram and Bollinger Band. MACD histogram seems to still too flat, implying that selling is not over yet; Bollinger Band suggests that the pair is still trading along with the lower band, showing no sign of an upward tendency.

Resistance: 1.1881, 1.1836, 1.1786

Support: 1.1753, 1.1740


GBPUSD(H4)

GBP/USD continues the bearish momentum from last week, currently trading at 1.2995 during American session. In the 4- hour chart, although both MACD and RSI indicators suggest that the pair is anticipated to bounce back modestly, it continues to head south, currently heading to challenge its support at 1.2976. The trend seems to exacerbate the ongoing slump along with the uncertainties of British economy and Brexit. Thus. It is expected to see the pair staying in short positions along with the range from 1.3061 to 1.2976 until it bounces back from 1.2976.

Resistance: 1.3256, 1.3166, 1.3061

Support: 1.2976, 1.2884


GOLD(H4)

As of writing, gold is trading at $1931.85 during American session. Gold bounces back from last week’s bearish, heading to test its resistance at $1941.85. From the technical viewpoint, gold is expected to keep up its bullish momentum until it surpasses the upper band in Bollinger Band; neutral RSI and flat MACD histogram both suggest that gold’s upward momentum is not over yet.

Resistance: 1959.21, 1950.78, 1941.85

Support: 1924.09, 1911.17


Economic Data

VT Markets Sep. futures rollover announcement (Update)

Dear Client,

New contracts will automatically rolled-over as follow.

Please note:
• The rollover will be automatic, and any existing open positions will remain open.

• Positions that are open on the expiration date will be adjusted via a rollover charge or credit to reflect the price difference between the expiring and new contracts.

• To avoid CFD rollovers, clients can choose to close any open CFD positions prior to the expiration date.

• Clients should ensure that take profits and stop losses are adjusted before this rollover occurs.

If you have any questions, our team will be happy to answer your questions.Please mail to [email protected] or contact the service online.

Back To Top
server

Hello there 👋

How can I help you?

Chat with our team instantly

Live Chat

Start a live conversation through...

  • Telegram
    hold On hold
  • Coming Soon...

Hello there 👋

How can I help you?

telegram

Scan the QR code with your smartphone to start a chat with us, or click here.

Don’t have the Telegram App or Desktop installed? Use Web Telegram instead.

QR code