The Netherlands’ seasonally adjusted unemployment rate over a three-month period rose to 4.1% in February. It had been 4.0% in the previous period.
Looking back at the data from February 2025, the rise in Dutch unemployment to 4.1% was an early indicator of a softening labor market that we saw play out over the following year. At the time, this small increase was a signal that suggested potential headwinds for the Eurozone economy. This piece of data contributed to a shift in market expectations towards a more dovish European Central Bank throughout 2025.
Labor Market Signals And Policy Expectations
We now see that this trend did continue through mid-2025, but the latest figures for February 2026 show the Dutch unemployment rate has since improved, falling back to 3.8%. This recovery comes as recent Eurostat data shows Eurozone core inflation has cooled to 1.9%, comfortably within the ECB’s target range. The economic slowdown anticipated back then proved to be relatively mild and short-lived.
Given this recovery and the ECB’s recent shift to a neutral policy stance, traders should consider reducing hedges that were positioned for a significant economic downturn. We believe strategies like selling out-of-the-money puts on the AEX index could be favorable, as implied volatility has decreased from its late-2025 highs of over 22% to a more stable 15% today. The focus in the coming weeks should be on a stable to moderately growing European market, rather than the slowdown that the 2025 data first hinted at.
Silver (XAG/USD) fell to a fresh monthly low of $75.50 in late Asian trade on Thursday and then struggled to recover. The move came amid expectations that the Federal Reserve will keep rates in the 3.50%–3.75% range through the year.
CME FedWatch puts the combined odds of the Fed keeping the Federal Funds Rate unchanged or raising it at 57.5%. A longer period of steady rates can support interest-bearing assets and reduce demand for non-yielding assets such as silver.
Rates Higher For Longer
At the time of writing, the 10-year US Treasury yield was up 0.42% to about 4.28%, near a more than six-week high. The US Dollar Index (DXY) was slightly lower but remained above 100.00 after Wednesday’s gains.
The Fed left rates unchanged for a second straight meeting and said inflation risks remain tilted higher. Fed Chair Jerome Powell said, “Inflation remains somewhat elevated, with recent progress slower than hoped,” and described policy as “at the high end of neutral, or mildly restrictive.”
On the 4-hour chart, price action turned bearish after a break below a Descending Triangle near $77.50, and the 14-period RSI moved into the 20.00–40.00 zone. Support sits near $72.00 and $64.17, while resistance is around $78.00, then $80.00, with $87.45 as the next level if $80.00 is cleared.
Given the Federal Reserve’s firm stance on holding interest rates, we see significant pressure on silver prices. The latest Consumer Price Index (CPI) data from February 2026 showed inflation stubbornly at 2.9%, reinforcing the market’s belief that rate cuts are not imminent. Based on today’s CME FedWatch tool, probabilities for rates remaining at the 3.50%-3.75% level through the summer have now increased to 65%.
For derivative traders, this environment suggests that buying put options on silver could be a primary strategy in the coming weeks. We are looking at strike prices near the key support levels of $72.00 and even the deeper February low of $64.17 as potential targets. The bearish breakdown of the triangle pattern signals strong momentum, making puts an effective way to capitalize on further declines.
Positioning And Risk Management
The persistent strength in the US dollar and Treasury yields adds weight to this bearish outlook. With the 10-year Treasury yield currently hovering at 4.30% and the US Dollar Index holding firm at 100.25, non-yielding assets like silver lose their appeal. This dynamic makes it difficult for silver to attract investor capital.
We saw a similar pattern back in mid-2022, when the Fed’s aggressive hiking cycle caused a significant drop in precious metal prices before they eventually stabilized. That historical performance shows how sensitive silver is to restrictive monetary policy and a strong dollar. This precedent gives us more confidence in anticipating further weakness as long as the Fed remains hawkish.
However, we must also consider the potential for a sudden price spike due to escalating geopolitical tensions in the Middle East. Recent reports of renewed friction near crucial shipping lanes are keeping a floor under safe-haven assets. Therefore, traders might consider buying cheap, out-of-the-money call options as a hedge against an unexpected geopolitical flare-up.
The technical chart provides clear levels for managing risk on any bearish positions. The breakdown zone around $78.00 now acts as a critical resistance level where new short positions could be initiated. A decisive move back above the $80.00 mark would be our signal that the immediate downward pressure is easing, requiring a reassessment of the strategy.
Create your live VT Markets account and start trading now.
Start trading now – Click here to create your real VT Markets account
Written on March 19, 2026 at 8:58 am, by josephine
GBP/JPY rose to about 212.35 in the Asian session on Thursday but then slipped back towards 211.85–211.80. It is nearly unchanged on the day as traders wait for the Bank of England (BoE) policy decision before taking clear positions.
Markets have moved away from expecting two UK rate cuts this year and are now pricing a higher chance of a hike in November due to an energy shock linked to the Middle East conflict. Attention is also on the BoE statement and monthly UK employment data, which may affect the Pound and the pair.
BoJ Policy And Yen Support
In Japan, the Bank of Japan (BoJ) kept interest rates unchanged at its March meeting, citing concerns that a war-driven rise in crude oil prices could slow economic growth. Geopolitical tensions have supported the safe-haven Yen and limited gains in GBP/JPY, with traders watching Governor Kazuo Ueda’s press conference for policy clues.
Markets still expect the BoJ to continue policy normalisation, and there is also talk of possible action by Japanese authorities to curb Yen weakness. The mixed drivers and range-bound trading since the start of the week suggest caution on strong near-term direction.
Looking back at the situation in March 2025, we saw the GBP/JPY cross hovering near the 212.00 level, with markets torn between Bank of England (BoE) and Bank of Japan (BoJ) policies. Since then, the pound has strengthened significantly, with the cross currently trading near 225.50. This rally was fueled by the BoE hiking its bank rate to 5.5% in November 2025 to combat the energy-driven inflation we were concerned about.
The dynamic has now shifted considerably heading into the second quarter of 2026. Last week’s UK inflation data showed the Consumer Price Index falling to 3.1%, its lowest level in two years, prompting markets to price in at least one BoE rate cut by year-end. This is a stark reversal from last year when rate hikes were the primary expectation.
Positioning For A Potential Reversal
Meanwhile, the Bank of Japan followed through on the normalization path we anticipated, finally ending its negative interest rate policy in January 2026. After years of a widening rate gap that punished the yen, the BoJ’s new tightening bias contrasts with the BoE’s emerging easing bias. This policy divergence now puts downward pressure on the GBP/JPY cross.
For derivative traders, this suggests the significant upward momentum in GBP/JPY has likely peaked. Buying long-dated put options with strike prices below 220.00 could offer a way to profit from a potential trend reversal over the next few months. This strategy provides a defined risk if the pound’s strength unexpectedly continues.
Alternatively, for those expecting a more gradual decline or range-bound price action, selling call options or establishing bear call spreads could be effective. This allows traders to collect premium while betting that the cross will not break its recent highs near 228.00. The key is to position for fading strength rather than the aggressive buying we saw through much of 2025.
Create your live VT Markets account and start trading now.
Start trading now – Click here to create your real VT Markets account
Written on March 19, 2026 at 8:58 am, by josephine
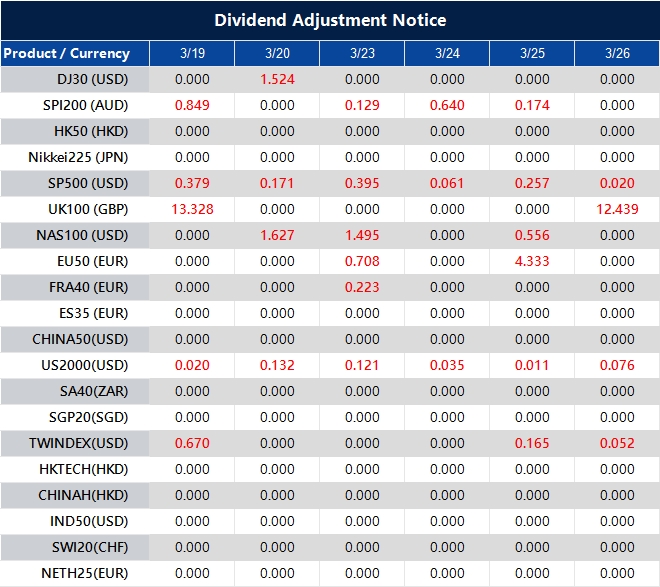
Please note that the dividends of the following products will be adjusted accordingly. Index dividends will be executed separately through a balance statement directly to your trading account, and the comment will be in the following format “Div & Product Name & Net Volume”.
Please refer to the table below for more details:
The above data is for reference only, please refer to the MT4/MT5 software for specific data.
If you’d like more information, please don’t hesitate to contact [email protected].
The US Dollar Index (DXY) traded near 100.10 in Asian hours on Thursday, after rising nearly 0.75% in the prior session. It remained subdued near 100.00 as markets weighed a more hawkish Federal Reserve outlook.
The Fed kept rates unchanged at 3.50%–3.75% at its March meeting on Wednesday. Chair Jerome Powell said inflation should ease gradually, but disinflation could be slower than previously expected.
Powell also said oil price rises linked to the Iran conflict are likely to lift inflation in the near term. The Fed cited uncertainty from the Iran war and warned of upside risks to inflation.
Policymakers indicated rate cuts may be delayed until there is clearer evidence that inflation is easing. Projections still show one rate cut this year and another in 2027, in line with the December outlook.
US producer price data for February showed stronger inflation pressures. Headline PPI rose 0.7% month-on-month, versus 0.5% in January and a 0.3% forecast, the largest rise in seven months.
Headline PPI increased to 3.4% year-on-year from 2.9%, while core PPI rose to 3.9% from 3.5%. Markets next focus on weekly jobless claims.
Looking back at this time in 2025, we saw the Federal Reserve signal a hawkish stance with the US Dollar Index near 100. One year later, the dollar index is now trading significantly higher around 104, as the Fed did not deliver the rate cuts initially projected in 2025. This strength follows a period where the Fed funds rate was pushed to 4.00-4.25% in mid-2025 to combat the persistent inflation we saw.
The inflation fears from last year, partly driven by the Iran conflict which has since stabilized, have shifted. While the latest Consumer Price Index for February 2026 showed a cooling to 2.8% year-over-year, this remains stubbornly above the Fed’s 2% target. This situation creates uncertainty over the timing of the first rate cut, which markets are now pricing for the third quarter.
Adding to the complexity is the resilient labor market, a factor that gives the Fed patience to keep rates elevated. The most recent Non-Farm Payrolls report showed a solid gain of 250,000 jobs, beating expectations and signaling continued economic strength. The unemployment rate also held steady at 3.8%, reinforcing the idea that the economy can handle higher rates for longer.
Given this backdrop, we should consider strategies that benefit from a strong but potentially range-bound dollar in the coming weeks. Selling short-dated puts on the DXY or currency pairs like EUR/USD could be an option, as the strong labor data provides a floor for the dollar. Implied volatility in forex options has been trending lower, suggesting the market expects stability before the next major catalyst.
In the interest rate markets, the persistent “higher for longer” narrative suggests we should remain cautious about aggressive bets on imminent rate cuts. We can see this reflected in Fed funds futures, where the probability of a rate cut at the May 2026 meeting has fallen below 20%. This implies that derivative positions expecting a sharp drop in short-term rates in the next six to eight weeks carry significant risk.
Start trading now – Click here to create your real VT Markets account
Written on March 19, 2026 at 7:59 am, by josephine
GBP/USD edged up to about 1.3290 in early European trading on Thursday, with attention on the UK employment report and the Bank of England rate decision. Gains may be capped by Middle East tensions and a firmer US Dollar.
The Middle East conflict lifted WTI to near $100 a barrel, supporting safe-haven demand for the US Dollar. Bloomberg said Iran and Israel traded strikes on key energy facilities, after an IRGC warning that some Gulf energy sites would be “legitimate targets” following an attack on South Pars gas field facilities.
Technical Picture For Sterling
GBP/USD fell about 0.7% on Wednesday, dropping below 1.3300 and extending a pullback from a late-January high near 1.3870. The pair is now below its key daily moving averages, and recent price action turned lower.
The Fed held rates at 3.50% to 3.75% and kept a projection of one cut in 2026, while the 2026 core inflation forecast rose to 2.7% from 2.5%. US headline PPI rose 0.7% month-on-month versus a 0.3% consensus.
GBP/JPY fell 0.20% on Wednesday and traded at 211.82 after reaching 212.73 earlier in the day. It previously tested 215.00, dipped near 207.00, and has been consolidating in a 210.00–214.00 range while holding above the 50- and 20-day SMAs, with RSI above 50.
Given the pound’s precarious position around 1.3290, the immediate focus should be on the upcoming Bank of England decision. The combination of Middle East tensions pushing oil towards $100 a barrel and a hawkish US Federal Reserve creates significant headwinds for Sterling. This uncertainty suggests that implied volatility in GBP options is likely to increase in the coming days.
Volatility Strategies Ahead Of Boe
We should consider buying volatility ahead of the BoE announcement, as a surprise move could cause a sharp price swing in either direction. Looking back at historical stress periods, we saw the VIX index spike above 35 during the onset of the Ukraine conflict in 2022, which translated to wider swings in currency markets. A similar environment is building now, making strategies like long straddles or strangles on GBP/USD potentially profitable.
The fundamental outlook favors a weaker pound against the dollar, as the Fed’s commitment to a single 2026 rate cut is a powerful signal. With the latest US Core PCE data from February showing inflation holding at 2.8%, the Fed’s hawkish stance is well-supported. We should therefore look at buying GBP/USD put options to position for a break below the recent lows.
In the UK, recent data from the Office for National Statistics showed consumer price inflation remained sticky at 3.1% in February, putting the BoE in a difficult position. This economic backdrop, combined with the Fed’s resolve, reinforces the case for a stronger dollar. Selling GBP/USD futures contracts or using bearish option spreads could capitalize on this growing policy divergence.
The risk-off sentiment is also boosting the Japanese Yen, which is pressuring the GBP/JPY cross despite its technically bullish setup. We saw WTI crude oil prices surge toward $130 a barrel in March 2022 on geopolitical fears, and a sustained move toward $100 now would likely intensify haven flows into the Yen. Hedging long GBP/JPY positions or initiating speculative shorts through put options appears prudent until the conflict de-escalates.
Create your live VT Markets account and start trading now.
Start trading now – Click here to create your real VT Markets account
Written on March 19, 2026 at 7:59 am, by josephine
GBP/USD edged up to about 1.3290 during Thursday’s Asian session and held near that level in early European trade. Attention is on the UK employment report and the Bank of England (BoE) rate decision on Thursday.
Oil rose with Middle East tensions, with WTI near $100 a barrel, supporting the US Dollar as a safe-haven. Bloomberg reported that Iran and Israel traded strikes on key energy facilities after an IRGC warning about targeting energy sites following attacks on South Pars gas field facilities.
Fed Policy And Market Reaction
On Wednesday, the US Federal Reserve kept rates unchanged at 3.50%–3.75%. The Summary of Economic Projections still pointed to one possible rate cut in 2026, while the inflation outlook was described as highly uncertain due to rising energy prices.
The BoE is expected to leave its key rate unchanged at 3.75% at its March meeting. Bank of America economists now forecast two Bank Rate cuts in June and September, delayed from March and June.
UK labour data is also due, with the ILO Unemployment Rate forecast at 5.3% in January versus 5.2% in December. The Pound Sterling dates back to 886 AD and accounts for 12% of FX transactions, about $630 billion a day (2022), with GBP/USD at 11%, GBP/JPY 3%, and EUR/GBP 2%.
With the conflict in the Middle East pushing oil prices towards $100 a barrel, we see implied volatility in currency markets ticking up. For instance, the Cboe Volatility Index (VIX) has jumped to over 20, a sharp rise from the calmer levels we saw at the start of the year. This environment suggests that buying options, such as straddles or strangles on GBP/USD, could be a prudent strategy to profit from expected price swings regardless of direction.
The US Dollar is benefiting from both this geopolitical tension and the Federal Reserve’s firm stance on interest rates. With recent US inflation data for February 2026 coming in stubbornly high at 3.4%, the Fed’s hawkish tone is justified and strengthens the dollar’s appeal. We should therefore consider positioning for continued dollar strength against a basket of other currencies, not just the pound.
Implications For Trading Strategy
Conversely, the outlook for the Pound Sterling appears weak, creating a clear divergence. The Bank of England is expected to hold rates today, but expectations are building for cuts starting in June, a notable shift from the sentiment we saw in late 2025. The forecast that UK unemployment will hit 5.3%, its highest level in nearly five years, further supports a bearish case for the British currency.
This growing gap between a hawkish Fed and a more cautious Bank of England suggests the path of least resistance for GBP/USD is downwards. We believe traders should look at strategies that profit from a fall in the pair, such as buying put options or establishing bear put spreads to limit upfront costs. The current 1.3290 level might represent a good opportunity to initiate such positions.
Looking back, we saw how widening interest rate differentials drove currency trends throughout 2025, making carry trades profitable. As the Fed holds firm while the BoE signals future cuts, the interest rate advantage is tilting back in favour of the US Dollar. This fundamental factor supports holding short GBP/USD positions through futures or forward contracts to capture this differential.
Create your live VT Markets account and start trading now.
Start trading now – Click here to create your real VT Markets account
Written on March 19, 2026 at 7:58 am, by josephine
USD/CHF slipped to about 0.7910 in Asia on Thursday after rising on Wednesday. The move came as the US Dollar eased, while markets still leaned towards fewer Fed rate cuts this year.
The US Dollar Index (DXY) was down 0.14% at about 100.00. CME FedWatch put the probability of the Fed keeping rates at 3.50%–3.75% at 55.2%.
Fed Policy Signal And Market Pricing
On Wednesday, the Fed left rates unchanged for a second meeting in a row. It also indicated policy changes were not suitable given upside inflation risks.
Reuters reported Fed Chair Jerome Powell said it was too early to assess price and economic effects from oil-driven inflation expectations linked to Middle East conflict. He also said the Fed is prepared to act as needed.
The Swiss Franc traded weaker than some peers before the Swiss National Bank decision due at 08:30 GMT. The SNB was expected to keep its policy rate unchanged at 0%.
Market focus remained on whether the SNB could move towards negative rates and whether it might act to limit CHF strength. Earlier this month, the SNB said it was ready to intervene in FX markets to curb rapid and excessive CHF appreciation.
Options Strategy And Rate Divergence
The USD/CHF pair is trading with a firm tone near 0.9150, reflecting a significant policy difference between the Federal Reserve and the Swiss National Bank. This divergence suggests the US Dollar will likely continue to strengthen against the Swiss Franc. Derivative traders should be positioned for further upside in the pair over the coming weeks.
Recent data from the United States supports a strong dollar, as the February 2026 jobs report showed a robust addition of over 250,000 jobs. Furthermore, the latest Consumer Price Index (CPI) reading came in at 3.4%, which is still well above the Fed’s target. This persistent inflation makes it very unlikely the Fed will consider cutting interest rates soon.
Looking back, we saw this trend building throughout 2025 when markets began to abandon hopes for aggressive rate cuts. As of today, the CME FedWatch Tool shows a greater than 90% probability that the Fed will hold its policy rate steady at its next meeting. The current market pricing suggests the earliest a rate cut could even be considered is late in the third quarter of 2026.
Conversely, the Swiss economy is showing much cooler inflation, with the latest figures at just 1.3% year-over-year. This has allowed the Swiss National Bank to take a more dovish path, having already begun to lower its key interest rate. This makes holding the Swiss Franc less attractive compared to the higher-yielding US Dollar.
The SNB also remains very sensitive to the Franc’s strength, as we saw with their explicit warnings back in 2025 about their readiness to intervene in currency markets. Any significant or rapid appreciation of the Franc would likely be met with action from the central bank, putting a natural cap on its strength. This reinforces the bearish outlook for the currency.
Given this environment, buying USD/CHF call options appears to be a prudent strategy. This allows traders to capitalize on the expected upward movement driven by the policy divergence, while strictly limiting downside risk. The positive carry from being long the higher-yielding USD against the CHF provides an additional tailwind for this position.
Create your live VT Markets account and start trading now.
Start trading now – Click here to create your real VT Markets account
Written on March 19, 2026 at 7:58 am, by josephine
EUR/JPY recovered losses and traded near 183.30 in Asian hours on Thursday. It stayed firm as the Japanese Yen weakened after the Bank of Japan kept the short-term rate at 0.75%, in line with expectations.
The decision was made by an 8–1 vote. Board member Hajime Takata proposed raising the short-term rate to 1.0% from 0.75%, saying the price stability target was largely achieved, but the proposal was rejected.
Focus now turns to the European Central Bank’s rate decision later on Thursday. Rising energy prices are adding to global inflation pressure, which complicates the ECB policy outlook.
The ECB is widely expected to keep its “Rate On Deposit Facility” unchanged at 2.0% in March. Market pricing points to a first rate rise by September, with only a 50% chance of another by year-end.
Traders have moved away from rate cut bets and are pricing in two rate rises by the end of 2026, according to Bloomberg. The Bank of Japan targets inflation of around 2% and has used QQE, negative rates, and yield control since 2013.
In March 2024, the BoJ lifted rates, stepping back from ultra-loose policy. Earlier stimulus weakened the Yen, while higher inflation driven by energy prices and wages supported the shift towards tighter policy.
Looking back to this time in 2025, we saw the Bank of Japan hold its rate at 0.75% despite some internal pressure to hike further. The European Central Bank was simultaneously holding its own rate at 2.0%, with markets just beginning to price in future tightening. This set the stage for a year of policy divergence that has played out as we expected.
Since then, the ECB has moved more decisively, raising its deposit rate to 2.50% to combat stubborn inflation, which recent data from Eurostat shows is still at 2.6%. The Bank of Japan has been more gradual, lifting its short-term rate to only 1.25% as it monitors the economy. This policy gap has helped push the EUR/JPY cross up towards the 190.00 level where it trades today.
We are now closely watching the impact of Japan’s spring wage negotiations, with the latest figures showing an average increase of 4.5%, putting more pressure on the BoJ to act. However, Governor Ueda will likely remain cautious, wanting to avoid disrupting the fragile economic recovery. This continued caution from the BoJ should keep the Yen relatively soft in the coming weeks.
In contrast, the ECB’s future decisions remain tightly linked to incoming inflation data, especially with Eurozone unemployment holding at a low 6.4%. Markets are now anticipating at least one more rate hike from the ECB by mid-year. This solidifies the policy divergence that favors a stronger Euro over the Yen.
Given this outlook, we see opportunities in buying EUR/JPY call options with expirations one to three months out. This strategy allows traders to capitalize on potential further upside in the currency pair driven by the rate differential. It also defines the maximum risk on the position, which is prudent given the potential for central bank surprises.
Start trading now – Click here to create your real VT Markets account
Written on March 19, 2026 at 7:01 am, by josephine
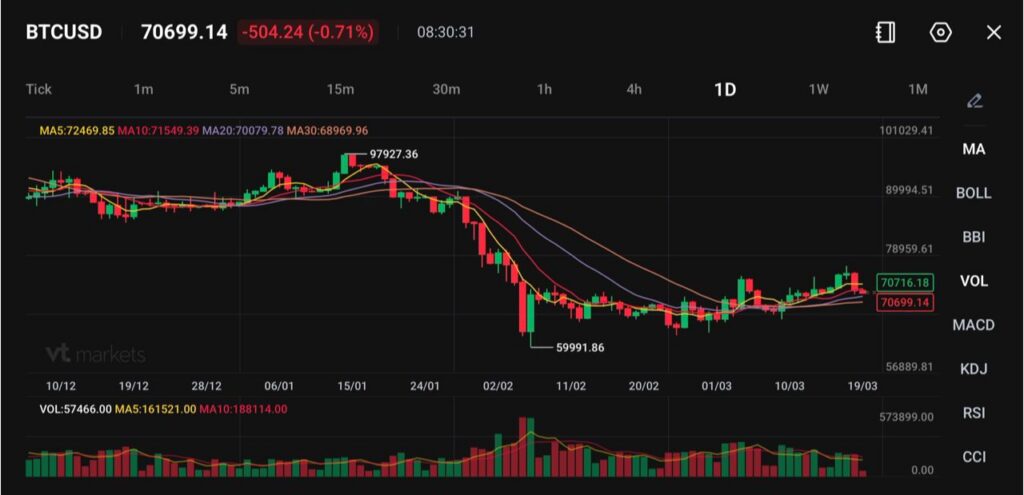
BTCUSD trades near 70,699, down -504 (-0.71%), after falling over 5% in 24 hours.
Over $382 million in long liquidations accelerated downside pressure across crypto markets.
The $70,000 level remains critical support, preventing a deeper move toward $60K.
Bitcoin retreated from weekly highs above $74,000, slipping back toward the $70,000 level as macroeconomic conditions weighed on risk assets.
BTCUSD is currently trading near 70,699, reflecting a broader cooling in momentum after a strong earlier rally. The decline comes as traders reassess expectations for monetary policy following hawkish signals from the Federal Reserve.
Despite the pullback, bulls have managed to defend the $70,000 psychological level, preventing a sharper correction.
Holding above $70,000 could stabilise sentiment, while a break lower may open the door toward the $60,000 region.
Hawkish Fed Signals Weigh on Crypto
The primary catalyst behind the selloff has been renewed concerns over inflation and interest rates.
Stronger-than-expected U.S. PPI data, with core inflation rising to 3.9% YoY, reinforced the view that inflation remains sticky. Federal Reserve Chair Jerome Powell echoed this sentiment, highlighting that it is too early to declare victory over inflation.
With headline PCE at 2.8% and core at 3.0%, both above the Fed’s 2% target, markets are now pricing a more cautious approach to rate cuts.
Higher-for-longer interest rates typically weigh on risk assets like cryptocurrencies by tightening liquidity and reducing speculative demand.
If rate-cut expectations continue to fade, Bitcoin may struggle to regain strong upside momentum.
Liquidations Amplify Downside Move
The decline in Bitcoin was intensified by a wave of liquidations across the crypto market.
Over $382 million in long positions were wiped out within 24 hours, with both Bitcoin and Ethereum accounting for more than $150 million each.
Bitcoin retreated from a six-week high after a broader risk-off move swept across global financial markets amid growing concern of an escalation in the conflict in the Middle East. https://t.co/iTyrDfD9LL
These forced liquidations can accelerate price declines, as leveraged positions are unwound rapidly, adding to selling pressure.
The broader crypto market followed suit, with total market capitalisation dropping before stabilising above $2.5 trillion.
Technical Analysis
Bitcoin (BTCUSD) is trading near 70,699, down around 0.71% on the session, as price struggles to build sustained momentum after rebounding from the ~60,000 low. The broader structure suggests a base-building phase following the sharp correction from the 97,927 peak.
Technically, Bitcoin is currently sitting between key moving averages, reflecting indecision. The 5-day MA (72,469) and 10-day MA (71,549) remain above price and are starting to flatten, acting as near-term resistance. Meanwhile, the 20-day MA (70,079) sits just below current levels, offering immediate support, with the 30-day MA (68,969) reinforcing the broader base.
The recent price action shows higher lows forming since the early February bottom, which is constructive. However, repeated rejection around the 72,000–73,000 zone signals that bulls are not yet in full control.
Volume has also moderated after the heavy sell-off, indicating that selling pressure has eased, but buying conviction remains tentative. This aligns with a consolidation or accumulation phase, rather than a clear trend continuation.
Overall, Bitcoin appears to be range-bound between 70,000 and 73,000 in the near term, with a breakout above resistance needed to confirm bullish continuation. Failure to hold 70,000 could shift sentiment back toward the downside, while a sustained move above 72,500+ would likely reopen upside toward the mid-70,000s and beyond.
Digital Gold Narrative Faces Short-Term Test
Bitcoin’s earlier rally was partly driven by its positioning as “digital gold,” benefiting from geopolitical uncertainty and inflation concerns.
However, the current environment highlights a key divergence. While safe-haven flows support gold, Bitcoin remains more sensitive to liquidity conditions and interest rate expectations.
A 'dividend' for your crypto? Wall Street's newest way to sweeten the deal for ETF holders https://t.co/uAoDAHKUH7
This dynamic means that even in periods of global uncertainty, crypto markets can face pressure if monetary policy remains restrictive.
What Traders Should Watch Next
Bitcoin now sits at a critical juncture, with both macro and technical factors in play. Key drivers include:
Federal Reserve guidance and rate-cut expectations
Inflation data and macroeconomic indicators
Whether BTC can hold above $70,000
Liquidation flows and market positioning
For now, the market appears to be in a healthy consolidation phase, but the next move will depend on whether bulls can defend key support levels amid tightening financial conditions.
Create a live VT Markets account today to access our platform features, including market insights and educational content.
FAQs
Why Did Bitcoin Price Drop Recently? Bitcoin fell due to a combination of hawkish Federal Reserve signals, stronger-than-expected inflation data, and a large wave of liquidations across leveraged positions.
What Did the Federal Reserve Say That Impacted Bitcoin? The Fed signalled a cautious approach to rate cuts, emphasising that inflation remains above target and that policy will stay restrictive for longer.
How Do Interest Rates Affect Bitcoin? Higher interest rates reduce liquidity and make risk assets like Bitcoin less attractive compared to yield-generating investments, often leading to price declines.
What is the Key Support Level for Bitcoin Right Now? The $70,000 level is the main psychological and technical support currently holding the market.
What Happens if Bitcoin Falls Below $70,000? A break below $70,000 could trigger further selling pressure and potentially push prices toward the $60,000 range.
Why Did Liquidations Accelerate the Selloff? Over $382 million in long positions were liquidated, forcing traders to exit positions, which amplified downward momentum.
Is the Crypto Market Still Stable Overall? Yes, despite the drop, total crypto market capitalisation has stabilised above $2.5 trillion, suggesting underlying resilience.
Start trading now – Click here to create your real VT Markets account
Written on March 19, 2026 at 7:01 am, by josephine