On Monday, US stocks extended their losses from the previous week as investors returned from a holiday weekend and prepared for another hectic week of corporate earnings reporting. Several large firms, including United Airlines (UAL), American Express (AXP), Netflix (NFLX), and Tesla (TSLA), released their most recent quarterly earnings reports. After oscillating between gains and losses throughout the session, the S&P 500 edged lower. Dow Jones and Nasdaq Composite both finished lower by 0.11 percent and 0.14 percent, respectively.

According to sources familiar with the subject, Apollo Global Management Inc. is interested in assisting with the financing of a bid for Twitter Inc. in response to Elon Musk’s $43 billion unsolicited offer to take the business private.

Apollo is considering a bid for Twitter and might provide Musk or another bidder, such as private equity company Thoma Bravo LP, with equity or financing to support an offer, the individuals said on condition of anonymity due to the nature of the conversations. According to one of the people, the involvement could take the shape of financing or preferred equity.

Twitter shares gained the most in two weeks on Monday as the social media firm launched a poison pill defense to foil Musk’s proposal to buy the company for $54.20 per share.

According to Bloomberg, Morgan Stanley is advising Musk, while Twitter has engaged the assistance of Goldman Sachs Group Inc. and JPMorgan Chase & Co. as it evaluates how to respond to Musk’s aggressive approach.
Main Pairs Movement

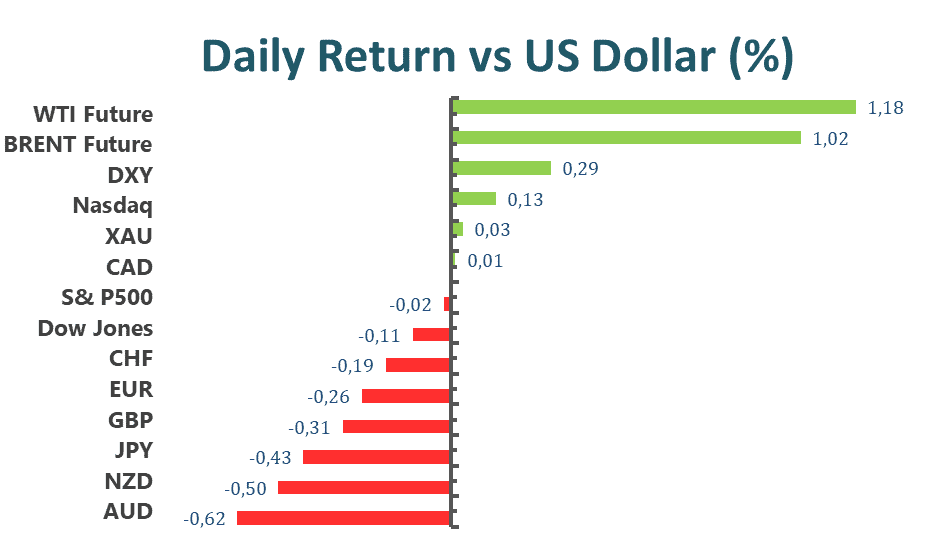
The US dollar held its ground against all of its main G10 peers, as the Dollar Index reached its highest level since April 2020 in the 100.80s. Traders noted expectations for a more aggressive Fed tightening cycle, which is evident in the rise in US rates across the curve, which boosted the greenback on Monday.

EUR/USD fell roughly 0.25 percent to retest the 1.0800 level and is now aiming for last week’s lows near 1.0750. GBP/USD fell roughly 0.4 percent to a little beyond 1.3000 and is also approaching annual lows, which are just below the 1.3000 mark in this case. NZD/USD plummeted almost 0.3 percent, falling below a critical level of support in the shape of the March low of 0.6728 and therefore reaching its lowest level since late February.

The Australian dollar was the poorest performance among the major G10 currencies, with AUD/USD plunging 0.6 percent to one-month lows below the 0.7350 level. The yen also performed poorly against a backdrop of rising US rates, with USD/JPY reaching its highest level since 2002 near 127.00. The loonie was the second-best performer among the G10 currencies, supported by increased oil prices. USD/CAD maintained a narrow range just around 1.2600 and below its 200- and 50-Day Moving Averages.

Commodities advanced for a third consecutive day on Monday. Gold briefly rose to nearly $2,000 per troy ounce but then retreated to more familiar levels by the day’s conclusion, closing 0.27 percent higher. Crude oils also posted modest increases, with WTI up 0.9 percent to $106.90 per barrel and Brent rising 1.38 percent to $112.70.

Technical Analysis

GBPUSD (4-Hour Chart)

GBPUSD edges lower, staying below 1.3050, as the market mood remains cautious on Monday, boosting the greenback to the highest level. From the technical perspective, the decline from last week has brought GBPUSD to bearish territory. GBPUSD continues to lose traction, testing the support at 1.3002. The breakout of the support at 1.3002 will attract more sellers, accelerating the downside toward the next hurdle. In the meantime, the RSI indicator stays near 40, suggesting that the latest recovery attempt was a technical correction and the GBP buyers remain hesitant and cautious.

Resistance: 1.3077, 1.3275
Support: 1.3002


XAUUSD (4-Hour Chart)

Gold extends its rally toward $1,990 per ounce, aiming for $2,000 as the US yields turn south. From the technical perspective, the bulls are in control and taking on fresh highs. The four-hour outlook of gold remains bullish as it continues to trade within the ascending trendline and above the midline of the Bollinger band. In the meantime, the 20 SMA is scaling higher, adding to the upside filter. The RSI indicator has not reached the overbought territory, which indicates a potential bullish momentum that might continue to go forward.

Resistance: 2001
Support: 1975, 1950, 1916


EURUSD (4-Hour Chart)

EURUSD is back under pressure as the US dollar advances to the highest in two years. From the technical aspect, EURUSD’s intraday bias remains downside and under pressure as the price trades below the 20 and 50 SMAs and trades within the lower bounce of the Bollinger band. The bearish momentum is now heading toward the immediate support level at 1.0758; failure to defend the level will lead EURUSD further south, accelerating its downside pressure. The near-term outlook of the EURUSD also exposes the bearish picture; the RSI indicator hovers near 40, suggesting an absence of buyers. The MACD continues to signal within the negative territory, lending supports to bears.

Resistance: 1.0932, 1.1039, 1.1126
Support: 1.0758

Economic Data

CurrencyDataTime (GMT + 8)Forecast
CNYPBoC Loan Prime Rate09:15N/A
CADCore CPI (MoM) (Mar)20:30N/A
USDExisting Home Sales (Mar)22:005.8M
USDCrude Oil Inventories22:300.863M

US equities stopped trading due to the holidays, while Asian stocks look set for a muted open Monday before Chinese economic data that may shed light on the impact of Covid lockdowns. Japan’s equity futures fell, while other markets, including Australia, Hong Kong, and a large portion of Europe, remained closed for Easter. Contracts for the S&P 500 and the Nasdaq 100, which are heavily weighted toward technology, fell.

According to Goldman Sachs Group Inc., the Federal Reserve will face a difficult task in tightening monetary policy sufficiently to contain inflation without triggering a US recession during the next two years. The Fed’s primary challenge is to close the wage gap and slow wage growth to a level consistent with its 2% inflation target by tightening financial conditions sufficiently to reduce job openings without sharply increasing unemployment, Chief Economist Jan Hatzius wrote in a research report published on Sunday.

Achieving a so-called gentle landing may be difficult, as historically big drops in the gap have occurred exclusively during recessions in the United States. “At face value, these historical tendencies indicate that the Fed confronts a difficult path to a smooth landing,” Hatzius said. A recession is not a foregone conclusion, Hatzius noted, because the Fed will benefit from post-Covid-19 normalizations in labor supply and durable goods prices. There are more instances of countries in the Group of 10 advanced economies – which includes Belgium, Canada, France, Germany, Italy, Japan, the Netherlands, Sweden, Switzerland, and the United Kingdom – that have successfully implemented a gentle landing, he said.

Main Pairs Movement

The economic data released this week in the United States were highlighted by the highest monthly increase in the Consumer Price Index (CPI) since September 2005. Households are feeling the pinch as a result of soaring prices for necessities, as evidenced by this week’s retail sales figures. However, underneath the surface, there are signs that pandemic-related inflation is beginning to ease.

Recent UK economic figures followed the global trend toward greater inflation and slower growth. The March CPI data release in the United Kingdom revealed that inflation pressures increased even further last month. Headline CPI is now at a 30-year high, quickening more than expected to 7% YoY.

Greenback won over most of its major rivals last week. The Euro pair closed the week 0.62 % lower at 1.0808, while Cable managed to climb 0.68% in the same period, last seen at 1.3055. The Japanese Yen depreciated by 1.67%, at 126.35 against the US dollar, while its Chinese peer stayed almost sidelined in value. Commodity-linked currencies were also limped during last week’s trading, with USD/CAD up 0.40% to 1.2572, and AUD/USD down 0.51% to 0.7458.

Technical Analysis

GBPUSD (4-Hour Chart)

GBPUSD steadies in a tight range above 1.3050 after the ECB’s policy decision yesterday. From the technical view of point, GBPUSD’s bears seem to face corrective action on the four-hour chart. The currency pair has been corrected to a near 50- period Simple Moving Average and now is providing an optimal opportunity for the buyers as the MACD turns positive, lending some support to bulls. At the same time, the RSI indicator continues to hover around the midline, suggesting the directionlessness of the price. Failure to defend the current support level will turn the currency pair to the downside, heading further south toward 1.2974.

Resistance: 1.3120, 1.3165, 1.3211
Support: 1.3064, 1.2974

AUDUSD (4-Hour Chart)

AUDUSD does not move significantly in a sleepy session on Friday; however, the downside looks ahead as the demand for the safe-haven dollar continues to gain traction. From the technical perspective, the outlook of AUDUSD looks downside since early April as the support level at 0.7471 was broken. And now, the bearish double top formation reconfirms AUDUSD’s bears. As the RSI has not reached the oversold territory and is within the negative area, AUDUSD has room to decline further south toward the next support at 0.7372. The bulls seem to lack momentum unless the pair climbs back above 0.7471.

Resistance: 0.7432, 0.7471, 0.7536
Support: 0.7372, 0.7277

EURUSD (4-Hour Chart)

EURUSD recovers above 1.0800 after suffering the heavy slump from Thursday. With the market moves subdued on Easter Friday, EURUSD edges slightly higher. From the technical aspect, the intraday bias continues to be bearish for EURUSD as the pair still trades below the 20 and 50 Simple Moving Averages. At the time of writing, despite EURUSD moving slightly higher on Friday, it faces the immediate support at 1.0758 and 1.0800, the psychological support; in case both levels turn into resistances, the pair can test 6- month lows if the levels fail to defend.

Resistance: 1.0932, 1.1039, 1.1126
Support: 1.0758

Economic Data

CurrencyDataTime (GMT + 8)Forecast
CNYGDP (YoY) (Q1)10:004.4%
CNYIndustrial Production (YoY) (Mar)10:004.5%

VT Markets Notification of Server Upgrade

Dear Client,

As part of our commitment to provide the best reliability and service to our clients, the trading hours of certain products will be adjusted as follows due to the maintenance.

Available trading hours:

2022/04/16 18:00 – 24:00 (Server time)
2022/04/17 00:00 – 24:00 (Server time)

Please be reminded that the following aspects might be affected during this maintenance period:

1. The functions of client portal operations might be disabled during this period.

2. There might be a gap between the original price and the price after maintenance. Pending orders, Stop Loss, and Take Profit settings within the gap will be filled at the market price after maintenance activity ends.

3. The quotations of products will be paused. Clients may not be able to open new positions or close the held positions.

No action is required by our client. Your service will be back online after the maintenance is completed.

Thank you for your patience and understanding about this important initiative.

If you’d like more information, please don’t hesitate to contact [email protected].

U.S. stocks fell Thursday to cap another losing week on Wall Street as investors digested a series of bank earnings and reeled from more red-hot CPI numbers. The S&P 500 and tech-heavy Nasdaq Composite each settled at four-week lows, recording declines of 1.2% and 2.2%, respectively. The Dow Jones Industrial Average fell 0.3 percent following a brief rise earlier in the morning. Meanwhile, Treasury yields climbed higher, with the 10-year benchmark marking its biggest one-week jump to hit 2.8%, the highest level since December 2018.

According to sources familiar with the subject, Twitter Inc.’s board of directors is considering adopting a measure that would shield the company against hostile acquisition offers in response to billionaire Elon Musk’s unsolicited offer to take the company private.

One of the options under consideration is adopting a poison pill, known as a shareholder rights plan, said the people, who asked not to be identified as discussing private deliberations. The poison pill could be announced as early as tomorrow by Twitter. Another possibility is to assert that the offer is excessively low, as one individual has stated.

Tesla Inc.’s CEO proposed $54.20 per share in cash for Twitter on Thursday, valuing the social media business at $43 billion. Musk, who stated that this was his “final and best” bid, had already amassed a stake in Twitter of more than 9% earlier this year. Twitter’s board of directors met Thursday to discuss Musk’s proposal and evaluate whether it was in the company’s and all of its shareholders’ best interests. The corporation did not respond to a request for comment on the offer or the board’s approach.

A poison pill defensive tactic permits current shareholders to purchase additional shares at a discount, therefore reducing the hostile party’s ownership interest. Poison pills are frequently used by corporations facing activist investors or hostile takeover attempts.

Main Pairs Movement

The dollar recovered some of its recent gains ahead of the close as speculative investors booked profits ahead of the Good Friday holiday when the majority of financial markets will be closed.

Following the European Central Bank’s dovish monetary policy announcement, the Euro pair fell to 1.0765, its lowest level in two years. The ECB held rates steady, as expected, and reiterated its intention to stop its bond-buying program in the third quarter of this year. April’s monthly net purchases will total €40 billion, May’s will total €30 billion, and June’s will total €20 billion.

Cable ended the day near 1.3070, down for the day but well off intraday lows. On the other hand, commodity-linked currencies closed the day near their daily lows versus the dollar. The Australian dollar is trading around 0.7410, while the Canadian dollar is hovering around 1.2615. The USD/JPY pair ended the day at about 125.90.

Gold fell 0.22 percent on the day to $1,973.40 per troy ounce. On Thursday, when the Russian oil embargo took effect, crude oils ended in the green for the third consecutive session. Concerns about inflation propelled US government bond yields to multi-year highs. The 10-year Treasury note yield peaked at 2.835 percent and is now trading at 2.82 percent.

Technical Analysis

GBPUSD (4-Hour Chart)

GBPUSD falls hard toward 1.3000 on renewed US dollar strength, boosted by the ECB’s dovish speech and rising US bond yields. From the technical perspective, the outlook of GBPUSD turns to the downside as it falls back to the descending trendline and below the 20 Simple Moving Average. At the time of writing, the British pound attempts to defend its support level at 1.3064; failure to defend this level would re-confirm GBPUSD’s bearish momentum toward 1.2974. The RSI indicator on the four-hour chart stays slightly above the midline, implying that GBPUSD might still have rooms to move further south. On the flip side, GBPUSD needs to climb back above the resistance level at 1.3120 to reclaim a positive stance.

Resistance:  1.3120, 1.3165, 1.3211

Support:  1.3064, 1.2974

XAUUSD (4-Hour Chart)

Gold gives up some ground on Thursday amid the resurgence of the US dollar’s demand. From the technical aspect, the four-hour chart for gold shows that it continues to trade above the midline of the Bollinger band, suggesting that gold stays in the bullish mood. The RSI indicator has slightly turned lower, but it still hovers and develops within the positive levels, indicating prevalent buying interests. On the upside, if gold eventually can break through the resistance at $1975, it will re-confirm the upside momentum, accelerating toward the next hurdle at $2001.

Resistance: 2001

Support: 1975, 1950, 1916

EURUSD (4-Hour Chart)

EURUSD slides to fresh two-year lows below 1.0800 as the ECB leaves its policy rates unchanged. From the technical perspective, the intraday bias remains bearish since EURUSD continues to trade within the descending trendline and below the 20 and 50 Simple Moving Averages. In the meantime, the RSI indicator remains below the midline, suggesting the absence of buying interests; the MACD continues to edge into the negative territory, lending supports to bears. At the moment, 1.0758 would be the support pivot for the pair, failure to defend the level would accelerate the bearish momentum.

Resistance: 1.0932, 1.1039, 1.1126

Support: 1.0758

Economic Data

CurrencyDataTime (GMT + 8)Forecast
AllHoliday: Good FridayN/AN/A

VT Markets The Adjustment Of Weekly Dividend Notification

Dear Client,

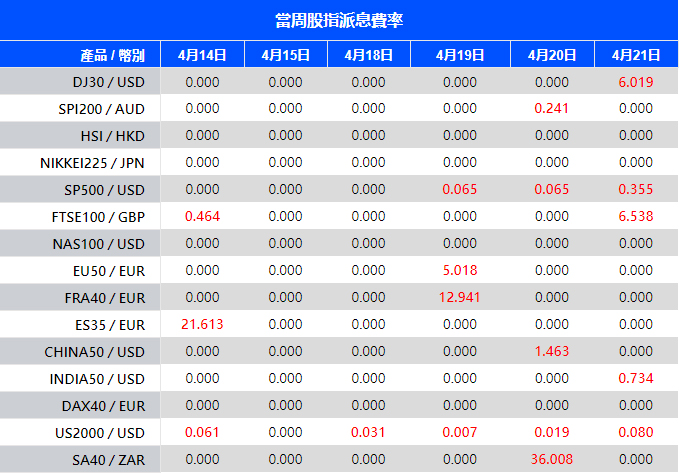
Warmly reminds you that the component stocks in the stock index spot generate dividends. When dividends are distributed, VT Markets will make dividends and deductions for the clients who hold the trading products after the close of the day before the ex-dividend date.

Indices dividends will not be paid/charged as an inclusion along with the swap component. It will be executed separately through a balance statement directly to your trading account, the comment for which will be in the following format “Div & Product Name & Net Volume ”.

Please note the specific adjustments as follows:

Note: The above data is for reference only, the actual execution date may be changed, please refer to the MT4/MT5 software for details.

If you’d like more information, please don’t hesitate to contact [email protected].

On Wednesday, US stocks climbed as investors digested a series of carefully anticipated quarterly reports and continued to absorb a scorching reading on US inflation. The S&P 500 index gained more than 1%, snapping a three-day losing trend. The Nasdaq Composite excelled and gained 2% as technology stocks rallied and Treasury yields across the curve fell. Early Wednesday morning, investors received several quarterly reports from several significant US firms and stock index components. These included JPMorgan Chase (JPM), the largest bank in the United States in terms of assets, Delta Air Lines (DAL), and Bed, Bath & Beyond (BBB) (BBBY).

Inflation is on the rise, central banks are on the move, and earnings season has here. To top it off, stock traders must contend with the market-roiling prospect of a monthly options expiry worth more than $2 trillion.

Approximately $495 billion in single-stock derivatives are expected to expire Thursday, followed by $980 billion in S&P 500-linked contracts and $170 billion in options tied to the State Street fund that tracks the S&P 500, according to estimates from Goldman Sachs Group Inc.’s Rocky Fishman. Volumes of this nature have been a cause of volatility throughout the last year.

While nothing is certain in markets, indexes have historically declined on days when contracts are closed out. This time, it comes as equities endure yet another round of volatility, with the S&P 500 recording only four positive days since the month began.

Main Pairs Movement

Inflation, central banks, and the Eastern European crisis remained at the center of the market’s attention, weighing on sentiment. The latest UK CPI increased to a three-decade high of 7%, while the US CPI increased by 8.5 percent year on year, both figures above expectations.

The Bank of Canada boosted benchmark interest rates by 50 basis points to 1.00 percent and also revealed intentions to begin shrinking its balance sheet on April 25, citing an increased risk of forecasts of rising inflation becoming entrenched. Earlier that day, the RBNZ increased the official cash rate by 50 basis points to 1.5 percent. Today, the European Central Bank will make its monetary policy announcement.

For the time being, Germany has opposed the EU’s ban on Russian oil, while Moscow has announced that US and NATO vehicles bringing weaponry to Ukraine would be deemed valid military targets.

Euro/dollar is trading near 1.0880, while the cable is barely above the 1.3100 level. Australian trades in a range around 0.7440, while the Loonie closed in the red at 1.2565. USD/JPY hit a new multi-year high of 126.31.

Gold prices continue their upward trend, trading around a new multi-week high of $1,981.57 per troy ounce. Risk-off emotions in general, along with the dollar’s decline during the American session, kept the metal bid intact throughout the day. Crude oil prices continued to rise, reaching a high of $103.50 per barrel for WTI and $108.40 per barrel for Brent.

Technical Analysis

GBPUSD (4-Hour Chart)

GBPUSD trades near an intraday high of 1.3100 as market players drop the US dollar. Market players bet on the BOE’s monetary policy meeting next week. From the technical perspective, GBPUSD’s intraday bias punctuates the bearish tone as it successfully up-breaks the 20 Simple Moving Average and the midline of the Bollinger band. At the same time, the upside momentum also breaches the descending trend line on the four-hour chart. However, to attract bulls, GBPUSD needs to close its intraday price above 1.3098 to fully reclaim its bullish momentum. As the RSI has not reached the overbought condition, GBPUSD still has room to extend further north.

Resistance:  1.3136, 1.3174

Support:  1.3098, 1.305, 1.2974

XAUUSD (4-Hour Chart)

Gold continues to climb, trading near a fresh multi-week high of $1981.57, alongside the US dollar’s weakness on Wednesday. From the technical aspect, gold maintains its bullish bias, continuing to favor the upside. On the four-hour chart, gold has breached the immediate hurdle at $1975, showing some upside strength. At the same time, gold sustainably trades above the 20 Simple Moving Average and trades within the upper bounce of the Bollinger band, suggesting absent selling interest at the time being. Gold’s positive move is expected to go on as the RSI has not fully reached the overbought territory, giving room for gold to extend further north toward $2001.

Resistance: 2001

Support: 1975, 1950, 1916

USDCAD (4-Hour Chart)

The Canadian dollar gains traction against the US dollar following the announcement from the Bank of Canada Governor Tiff Macklem that the BOC raises the interest rate to 1% in response to the inflationary pressure. USDCAD slides toward its support at 1.259 after the BOC raises 50 bps on its interest rate. From the four-hour chart, the near-term outlook of USDCAD turns downside, piercing below the midline of Bollinger Band. Failure to defend the 1.2590- 1.2600 level will attract some fresh sellings toward the next support at 1.2543. As the RSI is well above the oversold territory, USDCAD has plenty of room to move further south.

Resistance: 1.2700

Support: 1.2590, 1.2543, 1.2460

Economic Data

CurrencyDataTime (GMT + 8)Forecast
AUDEmployment Change (Mar)09:3040K
EURDeposit Facility Rate (Apr)19:45-0.5%
EURECB Marginal Lending Facility19:450.25%
EURECB Monetary Policy Statement19:45N/A
EURECB Interest Rate Decision (Apr)19:450%
USDCore Retail Sales (MoM) (Mar)20:301%
USDInitial Jobless Claims20:30171K
USDRetail Sales (MoM) (Mar)20:300.6%
EURECB Press Conference20:30N/A

U.S. stocks reversed earlier gains in the final hour of trading Tuesday amid fresh worries about the latest US CPI print that showed inflation in March further accelerated to a new 40-year high. S&P 500 edged 0.3% lower to 4397.35, and Dow Jones gave up an intraday climb to cap trading roughly 90 points, or 0.26%, lower to 34219.89. Nasdaq Composite faltered after an earlier advance, declining 0.3% to 13371.57.

On a once-obscure corner of Wall Street, a pattern of predictive and possibly extremely lucrative trading has developed – and US authorities are suspicious. The scene is the world of special-purpose acquisition companies, or SPACs, the shell organizations that have inundated markets in recent years in order to obtain capital from investors and then look for businesses to acquire. The instrument is a stock warrant, which entitles holders to purchase shares at a fixed future price. SPACs are notorious for issuing a large number of warrants.

The unusual trading pattern begins when someone purchases large quantities of a SPAC’s warrants, boosting the daily trading volume by 10, 20, or even 60 times normal levels. Within a few weeks, word spreads that the SPAC has identified a business to acquire, frequently driving warrant prices skyward. According to a Bloomberg examination of over 300 mergers disclosed since late 2018, such warrant trading spikes occur in around one out of every four SPAC transactions.

According to persons familiar with the case, the US Securities and Exchange Commission is now investigating warrant trades that occurred prior to deals to determine whether they were made unlawfully based on inside information. The SEC may conduct additional investigations as it sifts through additional complaints of well-timed bets reported by market surveillance systems such as the Financial Industry Regulatory Authority.

Main Pairs Movement

The US dollar lost strength ahead of the announcement of US inflation data but recovered considerably later in the day to close unevenly. It is stronger versus the common currency, with EUR/USD trading near 1.0830, not far from the year low of 1.0805, and GBP/USD battling to stay above 1.3000, despite positive UK job data.

Commodity-linked currencies traded side by side with their American counterparts for the majority of the day, erasing some gains before the close as Wall Street struggled to hold onto early gains. The Australian dollar is trading near 0.7450, while the USD/CAD currency pair is trading at 1.2640.

On Tuesday, gold reached a new multi-week high of $1,978.59 per troy ounce but has since fallen to approximately $1,965. Crude oil prices also increased dramatically, with WTI trading above $100.00 and Brent trading at $105.50 a barrel following OPEC’s reduction of both this year’s oil demand growth and supply estimate. Oil saw a brief reversal following Iran’s supreme leader’s statement that nuclear discussions are “doing well.” US government bond yields spiked ahead of the release of US data, before reversing course. The 10-year US Treasury note yield peaked at 2.836 percent and is currently trading at 2.72 percent.

Technical Analysis

AUDUSD (4- Hour Chart)

The Aussie snaps four days of consecutive losses against the US dollar, up 0.85% during the US session, following the mixed US inflation data. From the technical perspective, the overnight move-up brings AUD from a bearish to a neutral stance. The break-out of the resistance at 0.7432 and 0.7471 triggers some fresh buyings for AUDUSD. The acceptance above the next resistance at 0.7536 would boost AUDUSD to the upside. As the RSI reading is still far from overbought, AUDUSD has room to extend further north; at the same time, the MACD has turned positive, lending supports to bulls. On the flip side, if the currency pair cannot close its four-hour chart above 0.7471, then it might trigger some selling pressure.

Resistance: 0.7471, 0.7536, 0.7640, 0.7700

Support: 0.7432, 0.7300, 0.7277

XAUUSD (4- Hour Chart)

Gold spikes to a fresh multi-week high, above $1970. The bullion is boosted by the US CPI, which accelerates to 8.5%, triggering the risk sentiment that views gold as a hedge against the inflationary pressure. From the technical perspective, the four-hour outlook of gold turns upside following the breakthrough of the resistance at $1959. At the same time, the bulls are favorable as the resistance at $1959 is seen as a defensive level for bears, and gold trades well above the 20 Simple Moving Average. The RSI indicator has not yet reached the overbought territory, providing an opportunity for gold to extend further north, challenging the next hurdle at $1980, followed by $2001.

Resistance: 1980, 2001

Support: 1959, 1934, 1890

USDCAD (4- Hour Chart)

USDCAD drops sharply from three-week highs amid the US inflation data and the upsurge of crude oil prices. From the technical perspective, USDCAD remains positive bias on the four-hour chart as it continues to trade within the upper bounce of Bollinger Band. The support pivot at 1.26 becomes a defensive level for the currency pair; failure to hold above 1.26, will lead USDCAD to the negative territory. At the time of writing, the price action of the pair is directionless as the RSI sits at the midline, lacking fresh buyings or sellings. Further price action eyes on monetary decision-making from the Bank of Canada on Wednesday.

Resistance: 1.2700

Support: 1.2600, 1.2460

Economic Data

CurrencyDataTime (GMT + 8)Forecast
NZDRBNZ Interest Rate Decision10:001.25%
NZDRBNZ Rate Statement10:00N/A
GBPCPI (YoY) (Mar)14:006.7%
USDPPI (MoM) (Mar)20:301.1%
CADBoC Monetary Policy Report22:00N/A
CADBoC Interest Rate Decision22:001.00%
USDCrude Oil Inventories22:301.367M
CADBOC Press Conference23:00N/A

U.S. equities slipped Monday as investors shifted attention to the upcoming earnings season and a heavy economic calendar this week as the US Fed is ready to speed up its moves to fight inflation. The S&P 500 lost 1.69% on top of its last week’s losses. Nasdaq plummeted over 2% as big techs encountered fresh selling pressure. Dow Jones dropped the least, only down 11.19% thanks to its defensive industrial components.

The feel-good days for global markets at the end of March seem over. Everything from stocks to bonds is tumbling — even oil has pulled back from near records – in a concerted cross-asset selloff with shades of the rate-spurred rout of October 2018.

Blame it on a Fed focused on constraining policy to tamp down the worst inflation in four decades, even if that affects economic growth. Unlike four years ago, when Chair Jerome Powell faced market upheaval that would finally force him to change policy, investors in recent weeks have been treated to one Fed official after another guaranteeing higher and higher rates.

With monetary support swiftly diminishing and recession chances growing, investors are hunkering down. Companies resilient to an economic downturn such as health care are back in favor, as well as cash and dividend-paying companies. Meanwhile, demand for hedging is creeping up in the options market.

“The common factor in each situation is the fear of recession, which has overtaken the conventional effect of rising interest rates,” said Robert DeLucia, senior economic adviser at Empower, a retirement services company. “We are seeing a stampede into defensive companies and an aversion to economically sensitive stocks.”

Main Pairs Movement

At the start of the week, attitudes were negative, with the US dollar initially weakening but then regaining strength against its key rivals. Yields increased in reaction to concerns about soaring inflation and the Federal Reserve’s forceful response. Recession is audible, as investors are scared away by prior yield curve inversions, which are thought to be a precursor to economic recession. The 10-year Treasury note yield peaked at 2.793 percent, while the 2-year note yield reached 2.594 percent.

The EUR/USD and GBP/USD currencies concluded the day at 1.0880 and 1.3020, respectively. The weakest performances were commodity-linked currencies, with AUD/USD falling to the 0.7410 price zone and USD/CAD rising to 1.2636. Demand for safety pushed the USD/CHF pair lower, to around 0.9300. However, rising US government bond yields aided the USD/JPY to a new multi-year high of 125.76, where it is currently trading a few pips below the previous high.

In terms of commodities, gold continues to hover around $1,950 per troy ounce, clinging to Monday gains. Crude oil prices fell substantially on Monday, with WTI closing at $95.17 and Brent at $99.35. Cryptocurrencies are also declining, with the benchmark bitcoin going below the vital $40,000 threshold and Ethereum falling below the important $3,000 mark.

Technical Analysis

AUDUSD (4-Hour Chart)

AUDUSD continues to decline following a higher China CPI at 1.5%. From the technical perspective, the four-hour outlook of AUDUSD turns downside as the currency pair breaks its support pivot at 0.7432. However, as the RSI indicator has reached the oversold territory, any meaningful pullback might attract fresh buying near the 0.7400 mark. In the meantime, AUDUSD also trades in the lower band of Bollinger Band, prospecting a retreat from the bottom. Failure to find a decent pullback will bring the pair to the next psychological support at 0.7300, followed by 0.7277.

Resistance:  0.7432, 0.7471, 0.7536, 0.7640, 0.7700

Support:  0.7300, 0.7277

XAUUSD (4-Hour Chart)

Gold extends daily rally as high as $1960, boosted by the souring market mood amid recession fears and tensions between Russia and Ukraine. From the technical perspective, the four-hour outlook of gold turns upside following the breakout of the consolidated phase and the sustainably trade above the 20 Simple Moving Average. In order to sustain its bullish tone, gold needs to find an acceptable level above the immediate hurdle at $1959, 38.2% of the Fib. Retracement. On the flip side, the immediate support is pegged near $1934; failure to defend the level could negate prospects for any further near-term appreciating price action.

Resistance: 1959, 1980, 2001

Support: 1934, 1890

EURUSD (4-Hour Chart)

EURUSD loses traction amid the broad US dollar strength, boosted by the risk sentiment and the rising Treasury bonds. From a technical point, EURUSD is facing stiff resistance at 1.0969. EURUSD remains under selling pressure and downside as it continues to trade below the 20 Simple Moving Average and trade aligning the lower bound of the Bollinger band. At the time of writing, EURUSD consolidates in the range of 1.0969 and 1.0806 with directionless strength as the RSI reading falls on the midline. To the upside, the pair needs to find an acceptable level above the immediate resistance at 1.0969 in order to attract some fresh buying.

Resistance: 1.0969, 1.1069, 101150

Support: 1.0806

Economic Data

CurrencyDataTime (GMT + 8)Forecast
GBPAverage Earnings Index +Bonus (Feb)14:005.4%
GBPClaimant Count Change (Mar)14:00 
EURGerman ZEW Economic Sentiment (Apr)17:00-48
USDCore CPI (MoM) (Mar)20:300.5%

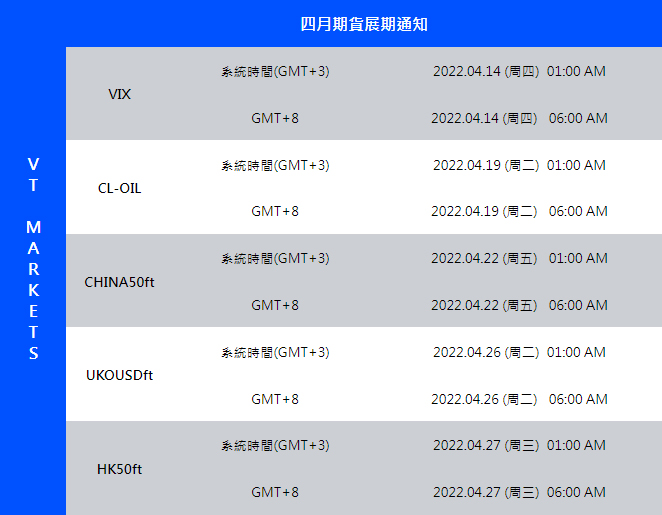
VT Markets April futures rollover announcement

Dear Client,

New contracts will automatically rolled-over as follows:

Please note:
•The rollover will be automatic, and any existing open positions will remain open.
•Positions that are open on the expiration date will be adjusted via a rollover charge or credit to reflect the price difference between the expiring and new contracts.
•To avoid CFD rollovers, clients can choose to close any open CFD positions prior to the expiration date.
•Clients should ensure that take profits and stop losses are adjusted before this rollover occurs.

If you’d like more information, please don’t hesitate to contact [email protected].

On Friday, US equities were mixed, with large technology companies posting the worst performance, while energy companies posted the best gains. Market participants are now closely monitoring the US Federal Reserve’s next moves. The S&P 500 finished roughly 0.3 percent lower after attempting a comeback to snap a three-week winning streak, while the Dow recovered from earlier losses to climb 140 points, or 0.4 percent, higher. The Nasdaq Composite Index fell 1.3 percent as underperformance in technology stocks kept the index in the red for the duration of the session.

Loretta Mester, chair of the Cleveland Fed, expressed confidence that the United States will avoid recession as the Federal Reserve tightens policy, though inflation will likely remain above 2% into next year. “I believe that bringing inflation down will take some time,” Mester said on CBS’s “Face the Nation,” referring to rising energy and commodity prices. “Thus, I believe inflation will remain above 2% this year and even next year, but on a downward trajectory.”

China’s efforts to eradicate Covid-19 also contribute, Mester, stated. “Certainly, the Chinese lockdown will exacerbate the supply chain problems we already have,” she said. “As a result, prices are being pushed upward.”

Fed officials increased interest rates by a quarter-point last month to a target range of 0.25 percent to 0.5 percent and indicated they expect rates to reach 1.9 percent by the end of 2022 and 2.8 percent by the end of next year, according to their median forecast.

Main Pairs Movement

In an otherwise calm week of data, Wednesday’s release of the FOMC minutes stirred things up as they showed committee members agreeing that elevated inflation and the tight labor market warrant balance sheet reduction start soon. With more certainty that the Fed will embark on a faster wind-down this cycle, the yield curve generally steepened, notably with the 2s/10s spread turning positive.

Greenback outperformed all its major rivals last week. The EUR/USD pair closed the week 1.50% lower at 1.0877, while GBP/USD was down 0.68% at the same period of time, last seen at 1.3025. The Japanese Yen depreciated by 1.49%, at 124.34 against the US dollar, while its Chinese peer stayed sidelined in value. Commodity-linked currencies were also limped during last week’s trading, with USD/CAD up 0.40% to 1.2572, and AUD/USD down 0.51% to 0.7458.
As to commodities, Gold climbed 1.18% to $1,947.68 a troy ounce, while crude oils closed the week in the red, with WTI closing lower by 1.61% at $97.76, and Brent at $102.32, down 1.99%.

Technical Analysis

AUDUSD (4- Hour Chart)

AUDUSD holds lower ground below the 0.7500 level despite upbeat RBA FSR as the US dollar index advances to 100 for the first time in almost two years, boosted by the prospect of a more hawkish Federal Reserve. From the technical perspective, the overnight strong move down validated a near-term bearish breakout through the support level at 0.7471. The downward break-through triggers bearish traders. At the time of writing, the next immediate support at 0.7432 seems to hold the defensive land; failure to defend 0.7432 will accelerate the downside momentum toward the psychological support at 0.7300. From the RSI indicator, the reading continues to hover within the negative territory; at the same time, a negative MACD shows that AUDUSD is in the negative stance on the four-hour chart.

Resistance: 0.7471, 0.7536, 0.7640, 0.7700
Support: 0.7432, 0.7300 


USDCAD (4- Hour Chart)

USDCAD edges lower, intending on testing its support level at 1.2600, with the latest decent Canadian employment figures. From the technical aspect, the four-hour outlook of USDCAD looks neutral at the time of writing, since the currency pair is hovering around the support level. The acceptance above 1.2600 would attract more buying interests, boosting USDCAD further north toward the next hurdle at 1.2700. On the flip side, failure to defend the 1.2600 level would support USDCAD’s bearish stance. Looking ahead, more dynamic fluctuations will be expected to happen next week as the US is going to release some key tier data.

Resistance: 1.2700
Support: 1.2600, 1.2463


EURUSD (4- Hour Chart)

EURUSD dropped on Friday amid the strong demand for the US dollar. From the technical perspective, the outlook of the EURUSD continues to align with the bearish stance, trading within the descending trend line since late March. On the four-hour chart, the RSI stays nearly 35, having a difficult time making a steady upward correction. In the meantime, the MACD continues to fall heavily in the negative territory, suggesting a bearish outlook for EURUSD. If the US dollar keeps up its strong demand, then EURUSD is looking to challenge the next immediate resistance at 1.0806.

Resistance: 1.0969, 1.1069, 101150
Support: 1.0806

Economic Data

CurrencyDataTime (GMT + 8)Forecast
GBPGDP (YoY)14:00 
GBPGDP (MoM)14:00 
GBPManufacturing Production (MoM) (Feb)14:000.3%
GBPMonthly GDP 3M/3M Change14:00 
Back To Top
server

Hello there 👋

How can I help you?

Chat with our team instantly

Live Chat

Start a live conversation through...

  • Telegram
    hold On hold
  • Coming Soon...

Hello there 👋

How can I help you?

telegram

Scan the QR code with your smartphone to start a chat with us, or click here.

Don’t have the Telegram App or Desktop installed? Use Web Telegram instead.

QR code