US stock rebounded through trade on Thursday, as Wall Street jumped on hopes Fed can stick the soft economic landing. Two of the Federal Reserve’s most hawkish policymakers pushed back against fears of a recession as monetary settings tighten. Governor Christopher Waller and St. Louis Fed President James Bullard supported the need for restrictive policy to curb price pressures but argued the US can still avoid a contraction.
The possibility of $220 billion of infrastructure stimulus in China also helped ease escalating recession concerns and injected a dash of optimism. Meanwhile, elevated commodity prices including metals and oil and potentially shoring up the Chinese growth outlook.
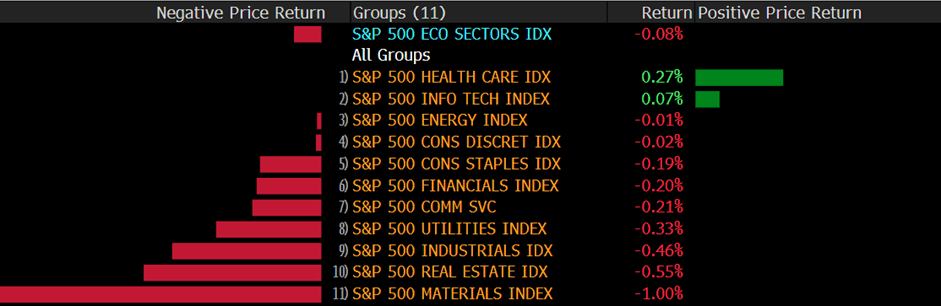
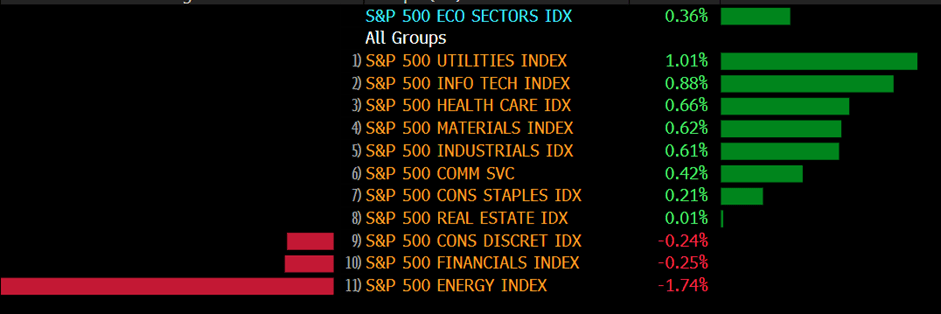
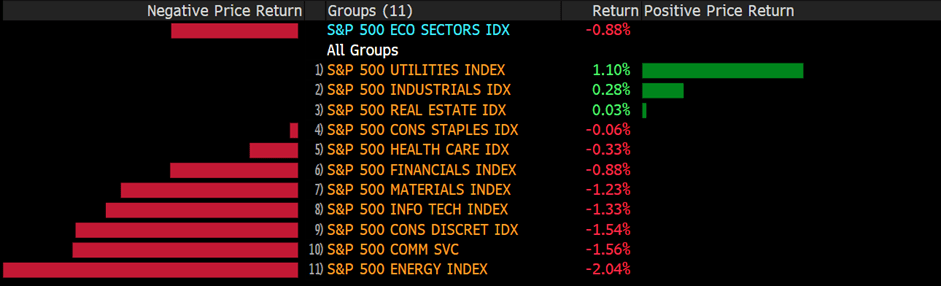
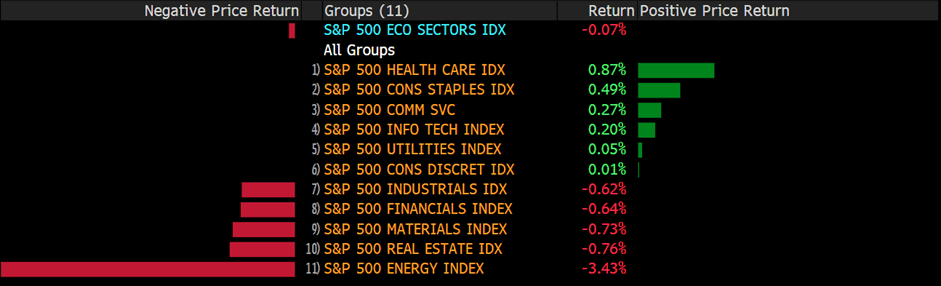
The benchmarks, S&P 500 and Nasdaq 100 both rose on Thursday. S&P 500 futures fell 0.1% as of 7:12 a.m. in Tokyo. The S&P 500 is up 1.5% daily. Nasdaq 100 futures fell 0.2% The Nasdaq 100 advanced with a 2.16% gain for the day. Ten out of eleven sectors went positive as market sentiment improved. The energy sector outperformed, S&P 500 ENERGY INDEX is the best among all groups.
Meanwhile, Nikkei 225 futures rose 0.4%, S&P/ASX 200 futures climbed 0.7%, Hang Seng futures increased 1.2%

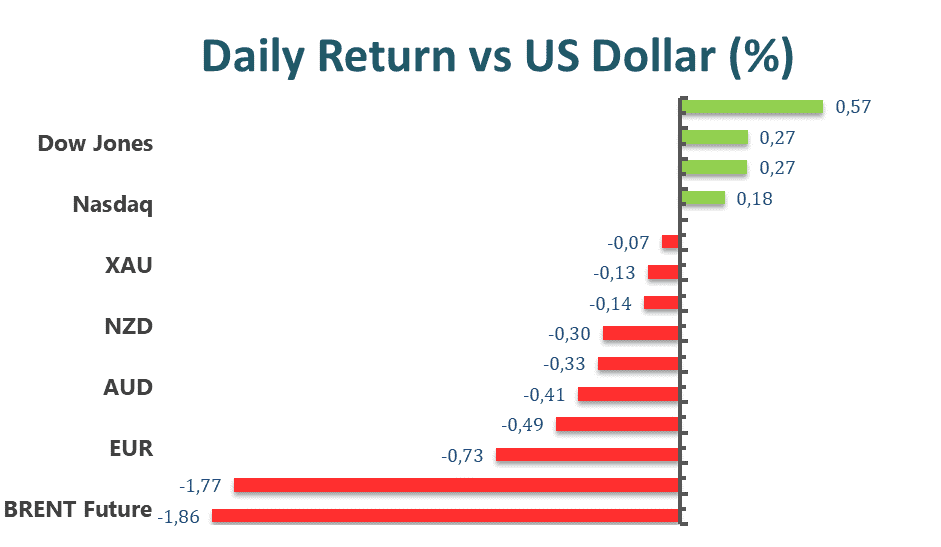
Main Pairs Movement
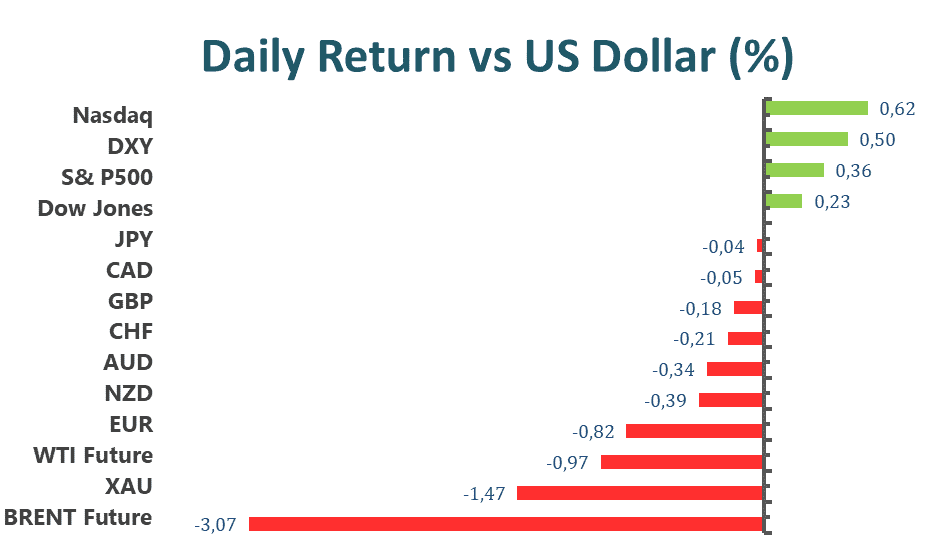
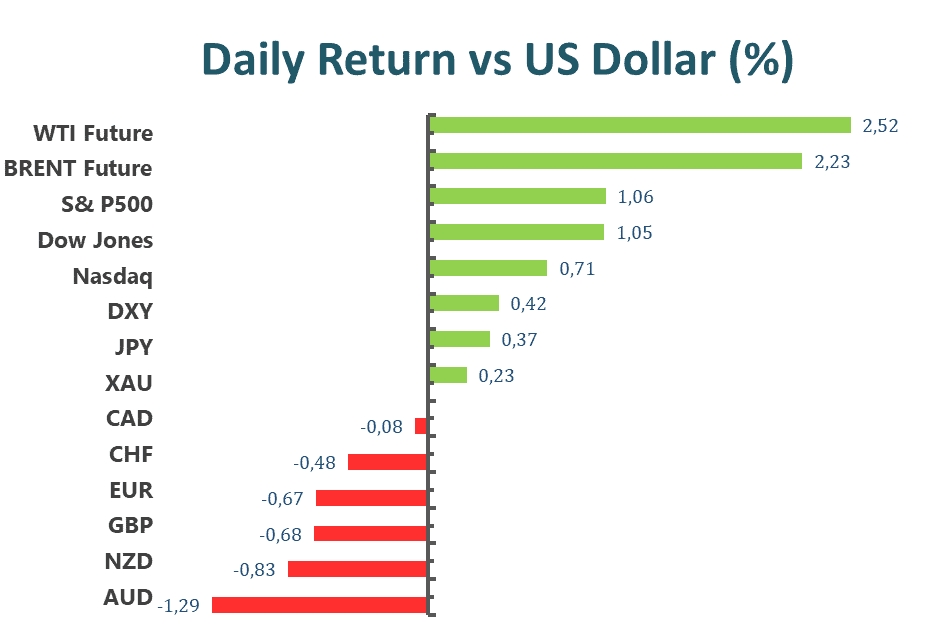
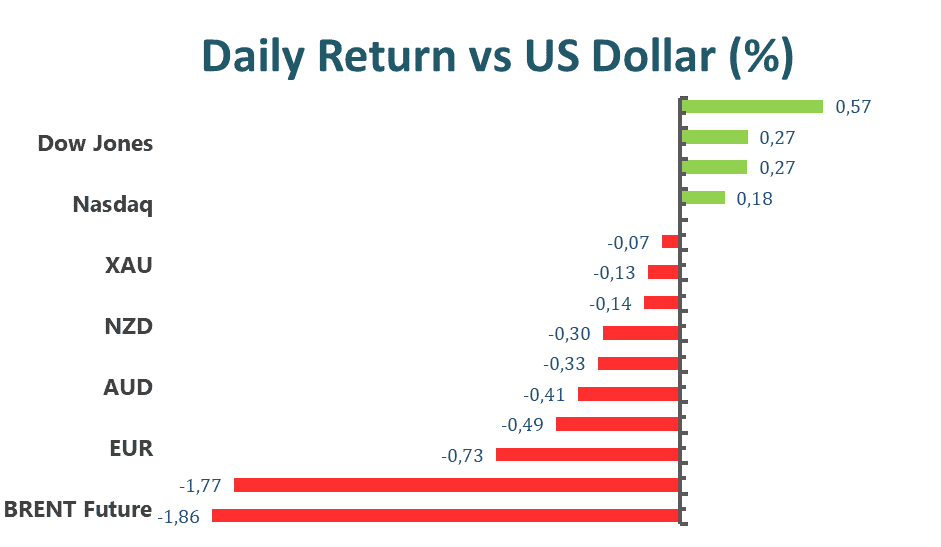
The US dollar snapped a four-day winning streak to a more than one-month high, closing slightly low at -0.03%, as improved risk sentiment forced the USD off recent highs. Commodity currencies led gains through trade on Thursday. The CAD, NOK, NZD and AUD all moved higher.
The AUD/USD rebounded through trade on Thursday, bouncing from lows approaching 0.6750. Reports said that China is considering introducing a $220 billion bond program designed to fund infrastructure investment through H2 helped ease escalating recession concerns, elevating commodity prices, therefore making the AUDUSD pair more attractive.
The GBP/USD was in a bullish momentum and soared over 0.81%. The pound rose after Boris Johnson announced his intention to resign as British prime minister, easing the political chaos in the UK.
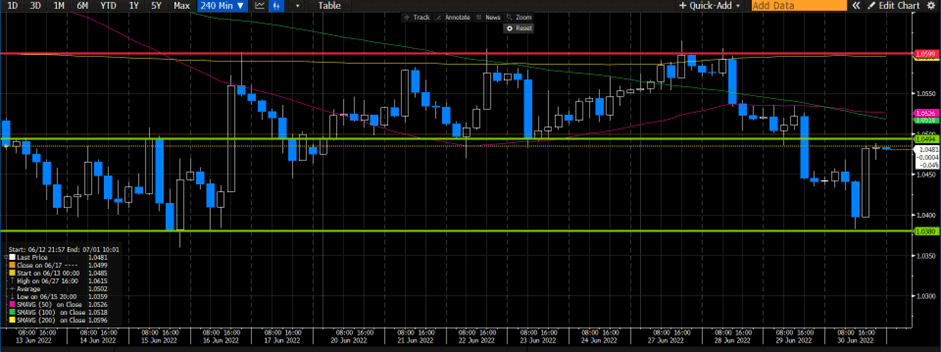
Meanwhile, EUR/USD slumped slightly yesterday. The pair was down 0.22% for the day. European gas futures rose another 6% overnight, marking the highest level since March. Further elevation in energy costs and decline in consumers’ purchasing power is pushing Europe toward recession and a cycle of stagflation.
Technical Analysis
AUDUSD (4-Hour Chart)
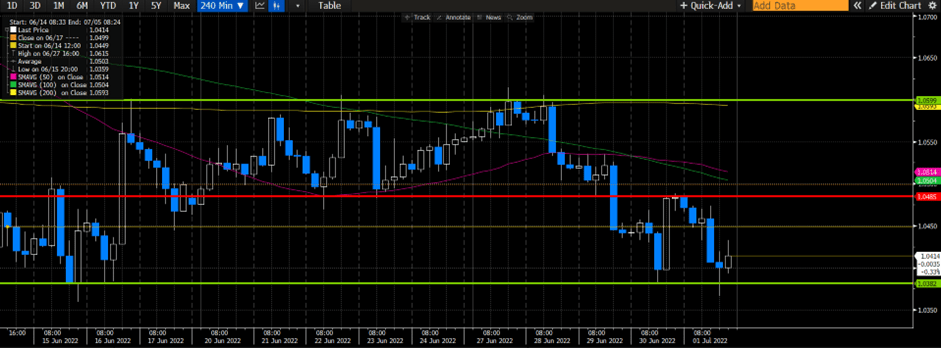
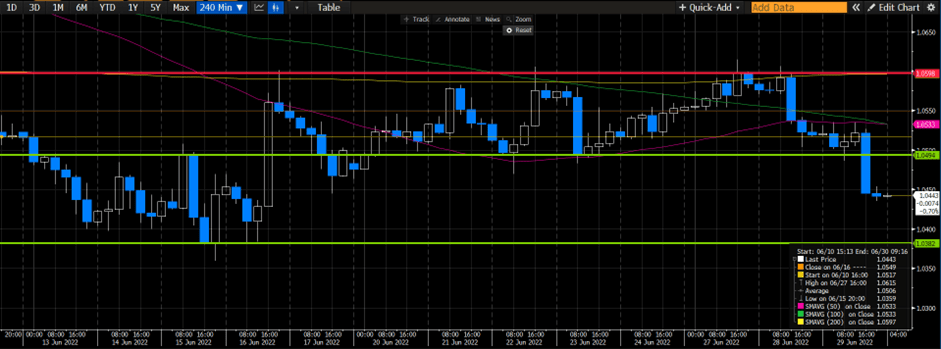
AUDUSD edges higher at the time of writing, showing resilience near 0.6762; however, the descending trend line continues to cap the recovery from a two-year low. On the four-hour chart, the latest recovery might be corrective as the bearish trend line has acted as a strong resistance according to experience. AUDUSD needs to advance above the bearish trend line to reclaim its bullish momentum in the near term. With the combination of factors, a bullish double-bottom formation, a bullish MACD, and a non-overbought RSI indicator might be able to lift the currency pair higher. On the flip side, if the immediate support of 0.6762 fails to defend, then the pair is expected to see an acceleration toward the south.
Resistance: 0.6926, 0.7028, 0.7110
Support: 0.6762
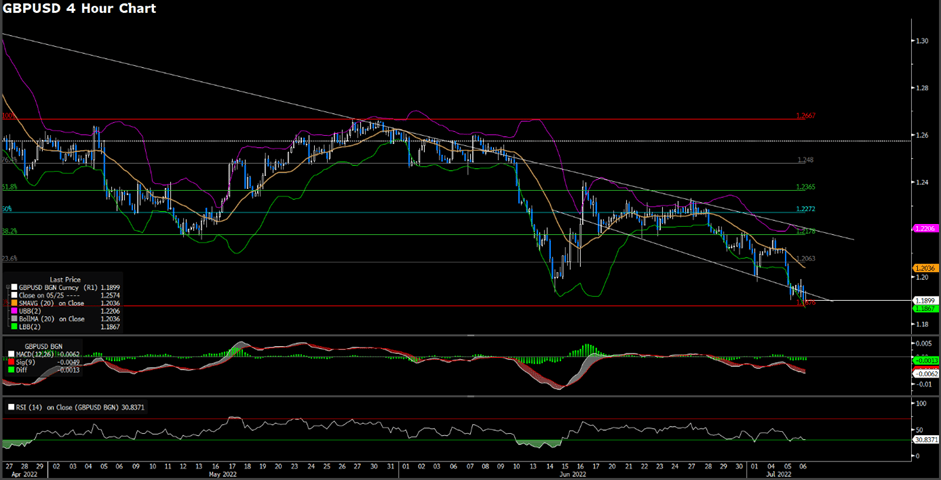
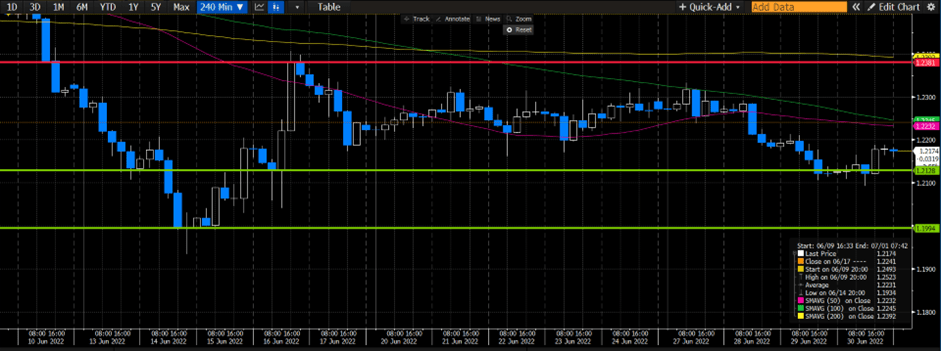
GBPUSD (4-Hour Chart)
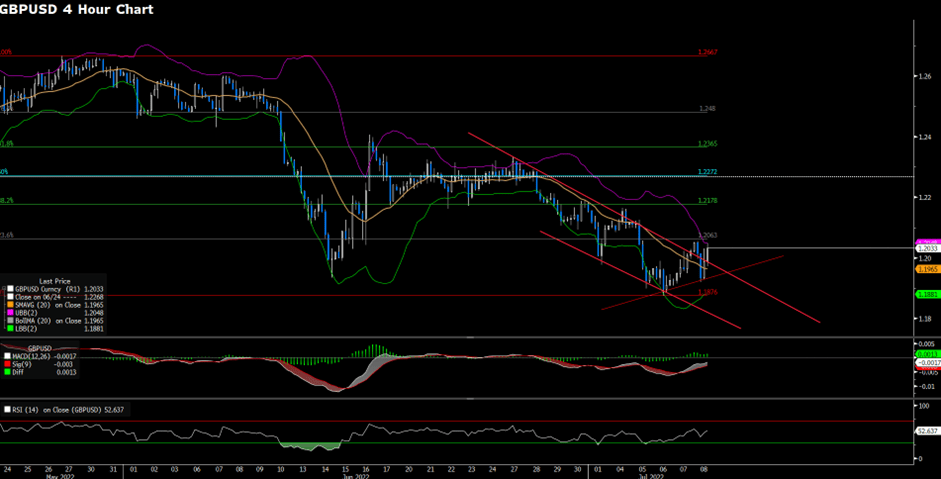
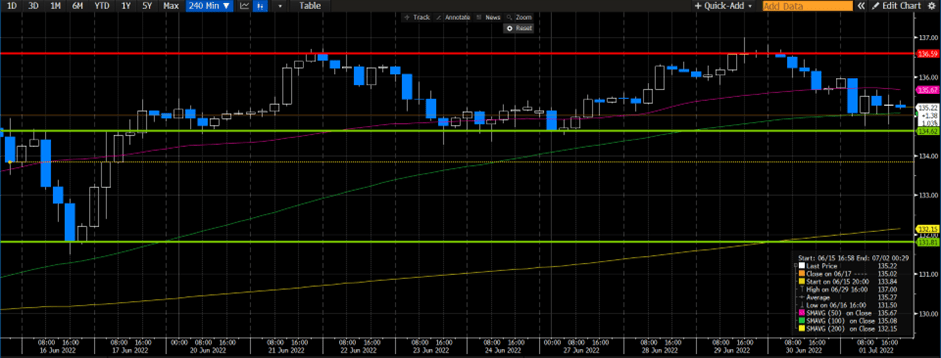
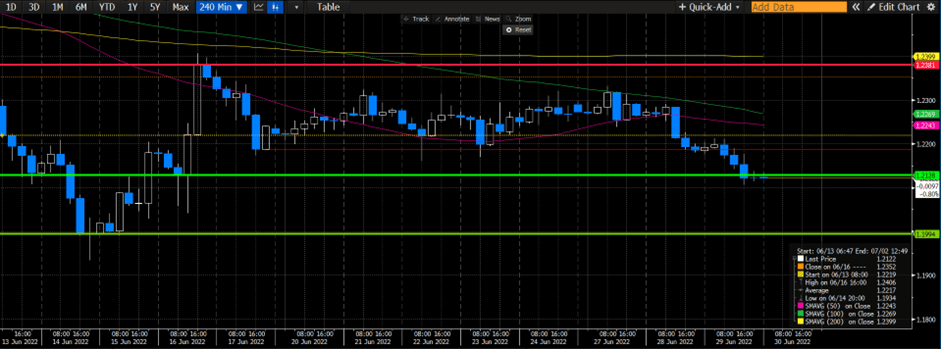
GBPUSD has reversed its direction, climbing above 1.2000 amid the news that British Prime Minister Boris Johnson is planning to announce his resignation. Technical speaking, the mood of GBPUSD turns upside in the near- term despite still falling within the bearish channel. Both the MACD and the RSI indicator have shown some signals that bullish traders are reflecting the positive impact. The acceptance of 1.2163 would bring GBPUSD back to positive territory. On the flip side, if GBPUSD cannot continue its upside momentum, falling below the bearish channel and the support of 1.1876, then GBPUSD would move further south.
Resistance: 1.2063, 1.2178, 1.2272
Support: 1.1876
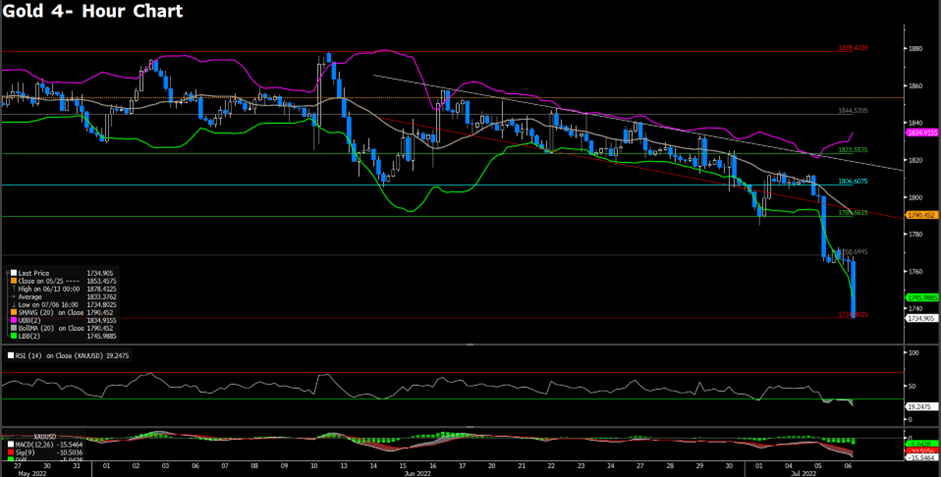
Gold (4-Hour Chart)
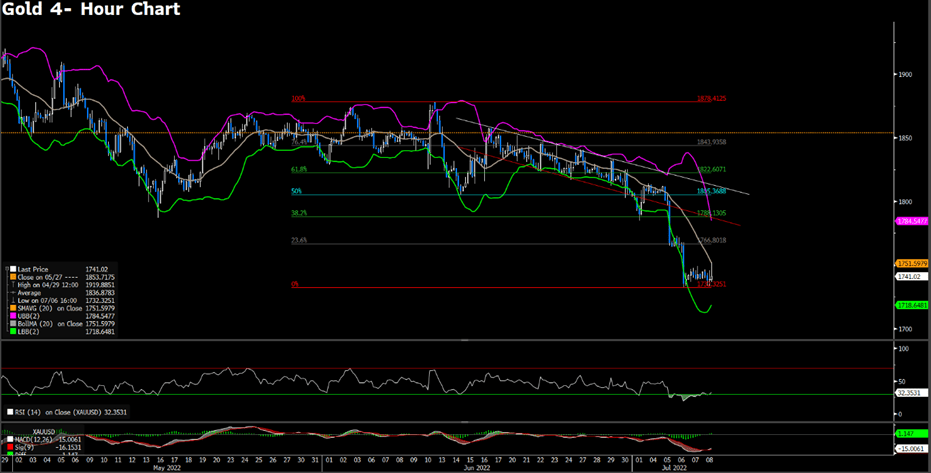
Gold hovers above $1732, attempting to recover from yesterday’s slump. From the technical aspect, the outlook of gold remains bearish on the four-hour chart as it continues to fall below the bearish trend; in the meantime, an inverted flag has signalled a continuation of bearish momentum. At this stage, gold might attract some dip- buyers as the RSI has reached the oversold territory, suggesting a potential rebound. However, the bearish momentum is still in charge as the bearish MACD continues to lend support to bears.
Resistance: 1766.80, 1788.13, 1805.36
Support: 1732.32
Economic Data
| Currency | Data | Time (GMT + 8) | Forecast | |
| EUR | ECB President Lagarde Speaks | 19:55 | N/A | |
| USD | Nonfarm Payrolls (Jun) | 20:30 | 268K | |
| USD | Unemployment Rate (Jun) | 20:30 | 3.6% | |
| CAD | Employment Change (Jun) | 20:30 | 23.5K |