US stock surged on Friday, rebounding back and recovering some of the ground it lost at the end of a dizzying week as investors reduced their bets on a bigger rate hike by the Fed in July. Federal Reserve Governor Christopher Waller and St. Louis Fed President Jim Bullard, who are the two most hawkish FOMC members, said that they were not in favour of the bigger rate hike at the upcoming meeting in July. Therefore, markets are pricing in nearly 75 basis points of Fed tightening this month and down from a full-point bet earlier this week. However, the concerns about a potential recession remained as a 75 bps rate hike is still an aggressive boost for the economy. In the Eurozone, the ongoing fears over disruption to the euro-zone economy from energy supply constraints and fragmentation risks might keep weighing on investors’ sentiment, which is unlikely to ease in the coming weeks.
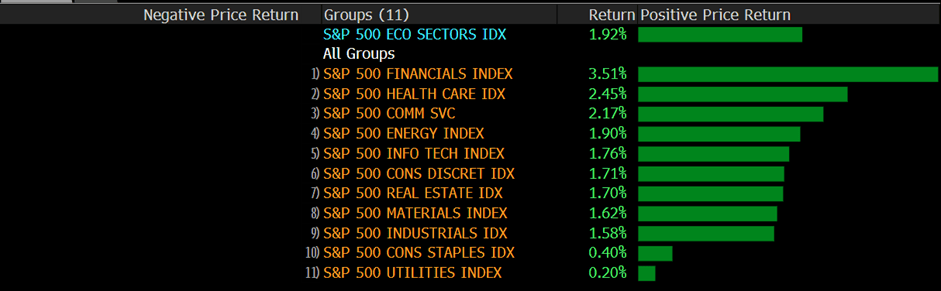
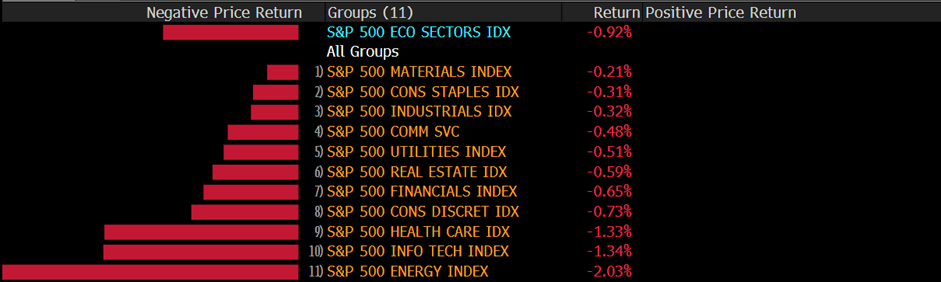
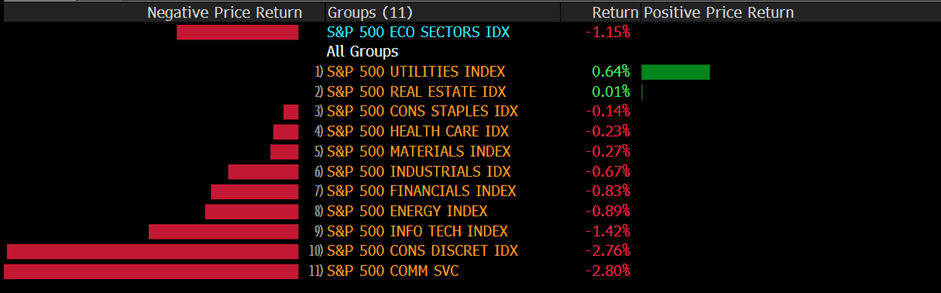
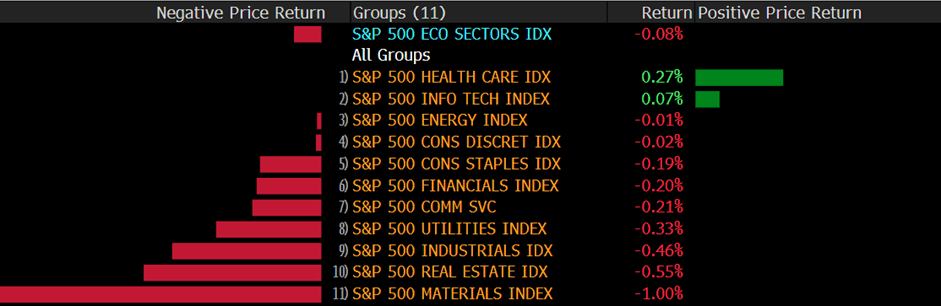
The benchmarks, S&P 500 and Nasdaq 100 both advanced on Friday as the less hawkish stance from Fed officials and positive US retail sales data both lend support to the market mood. The S&P 500 was up 1.9% daily and the Nasdaq 100 also advanced with a 1.8% gain for the day. All eleven sectors stayed in positive territory as the financials and the health care sectors are the best performing among all groups, rising 3.51% and 2.45%, respectively. The Dow Jones Industrial Average meanwhile climbed the most with a 2.1% gain on Friday and the MSCI World index rose 1.6%.

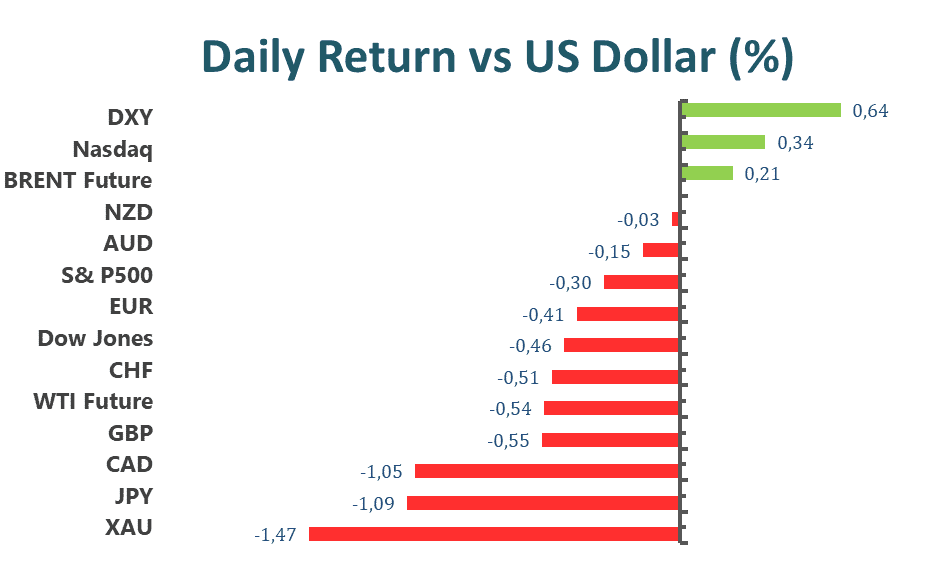
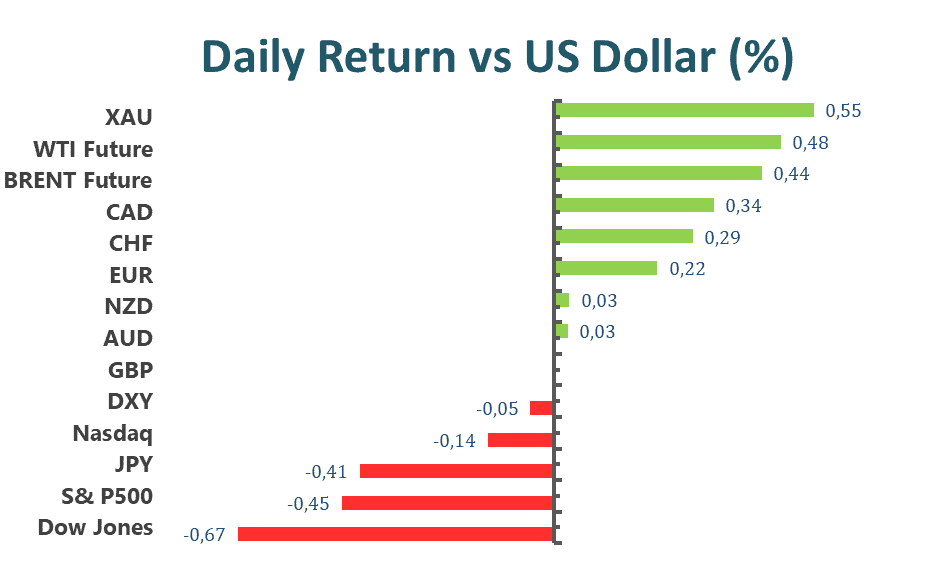
Main Pairs Movement
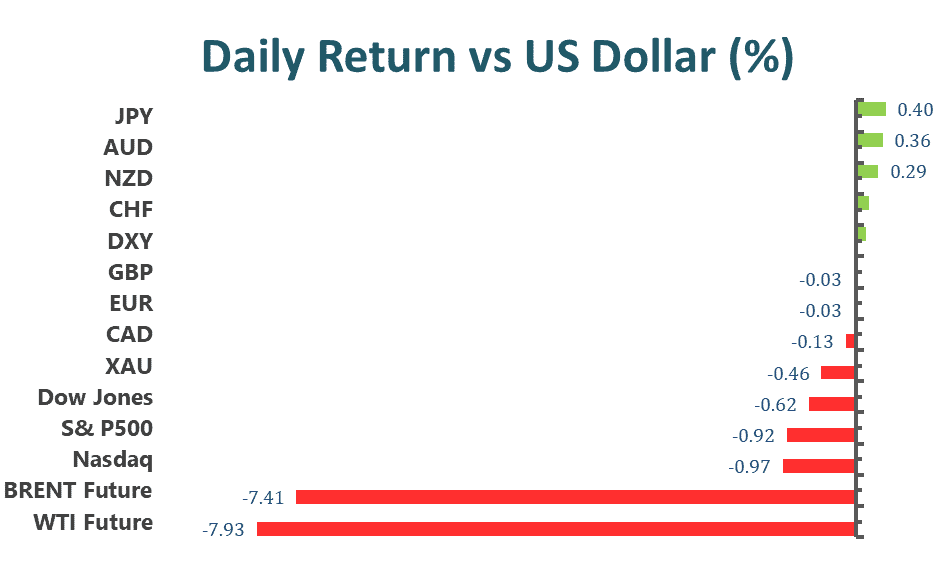
The US dollar declined on Friday, extending the previous day’s retracement slide from a two-decade high and edged lower on the last day of the week. The DXY index remained under bearish momentum during the first half of the day, dropping to a daily low below 108 level in the US trading session. Retail Sales in the US increased by 1% in June, which was better than the market’s expectation of a 0.8% rise but failed to lift the greenback higher.
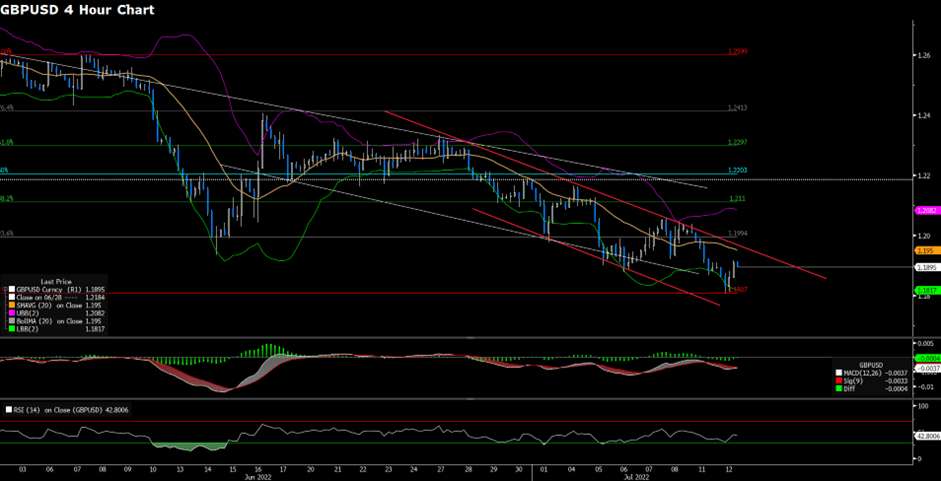
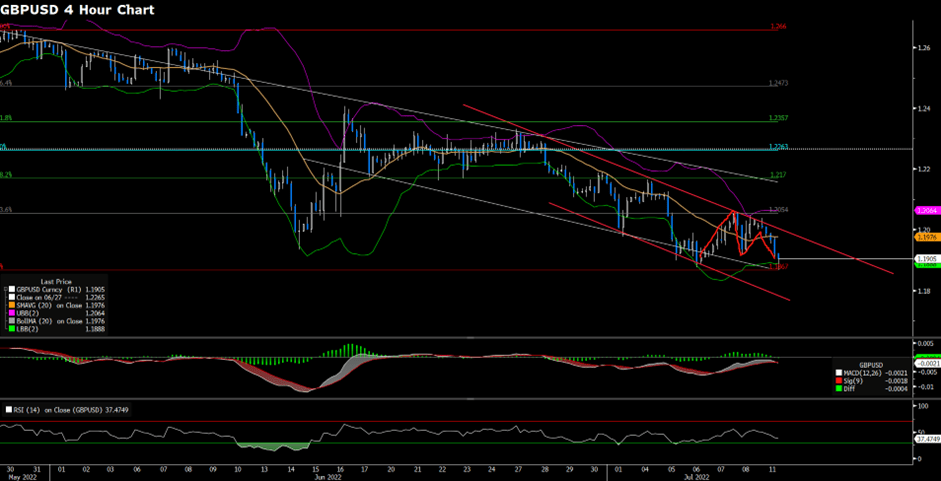
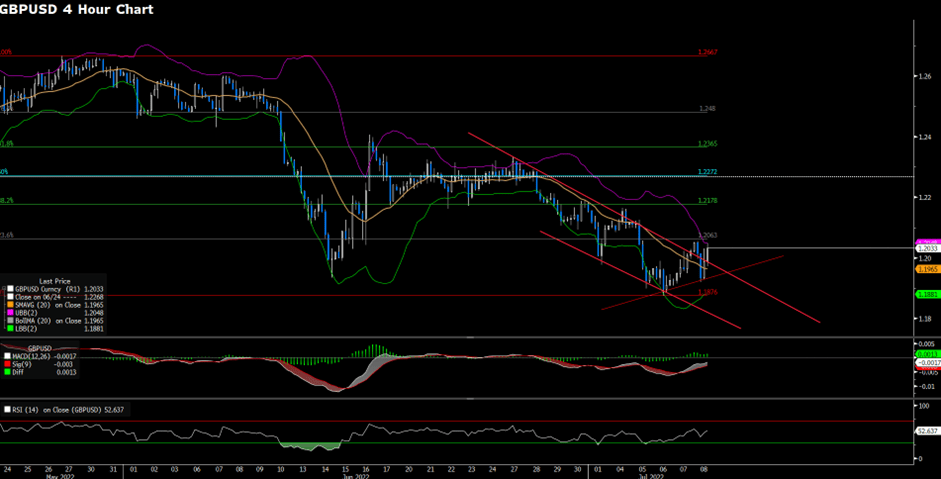
GBP/USD advanced with a 0.38% gain on Friday amid the risk-on market mood across the board. However, the UK political uncertainty and Brexit woes might overshadow the prospects for a further tightening by the Bank of England and undermine the cable. The GBP/USD dropped to a daily low below 1.181 level, but regained upside traction and extended its daily gains. Meanwhile, EUR/USD witnessed heavy buying and refreshed its daily high above the 1.009 level to trim its weekly losses in the US session. The pair was up almost 0.72% for the day.
Gold declined with a 0.16% loss for the day after dropping to a daily low below the $1700 mark in the early US trading session, as the less hawkish stance from Fed officials continued weighing on the US dollar and offered some support to the dollar-denominated gold. Meanwhile, WTI oil preserved its upside traction and moved higher to the $98 area during the US session. But fears of a potential recession have raised concerns about the fuel demand outlook.
Technical Analysis
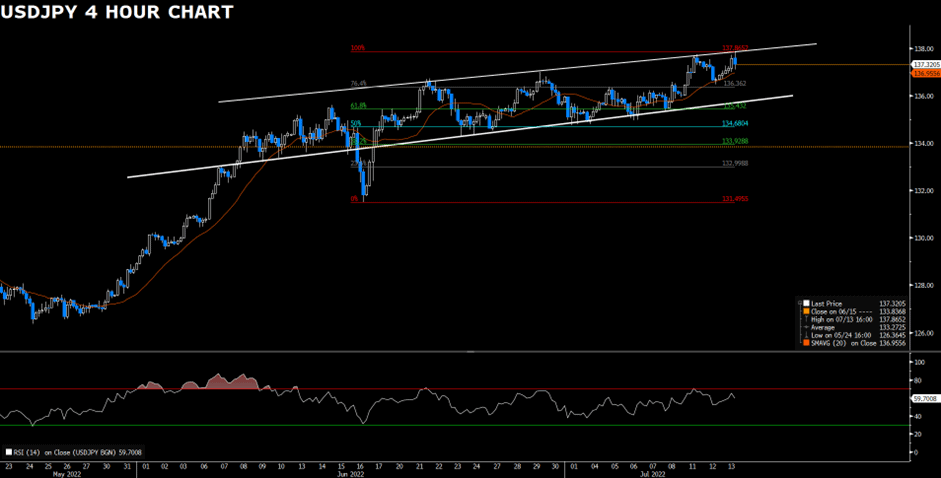
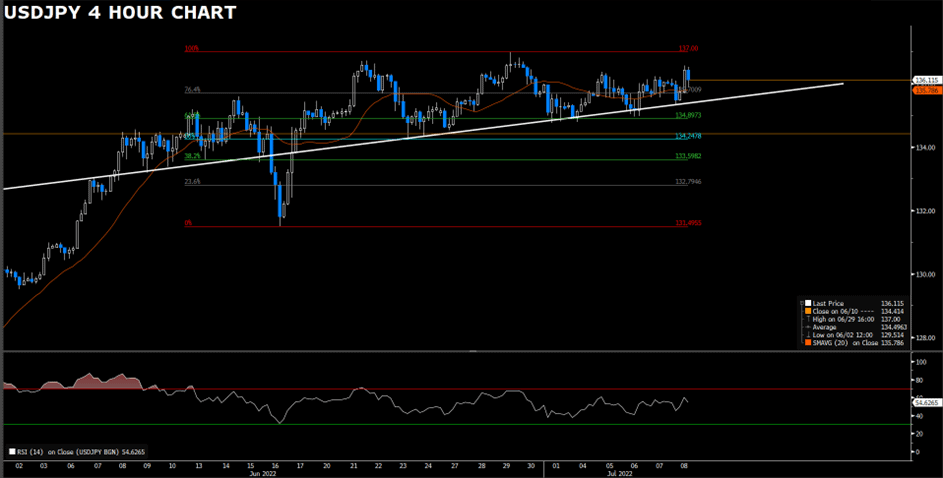
USDJPY (4-Hour Chart)
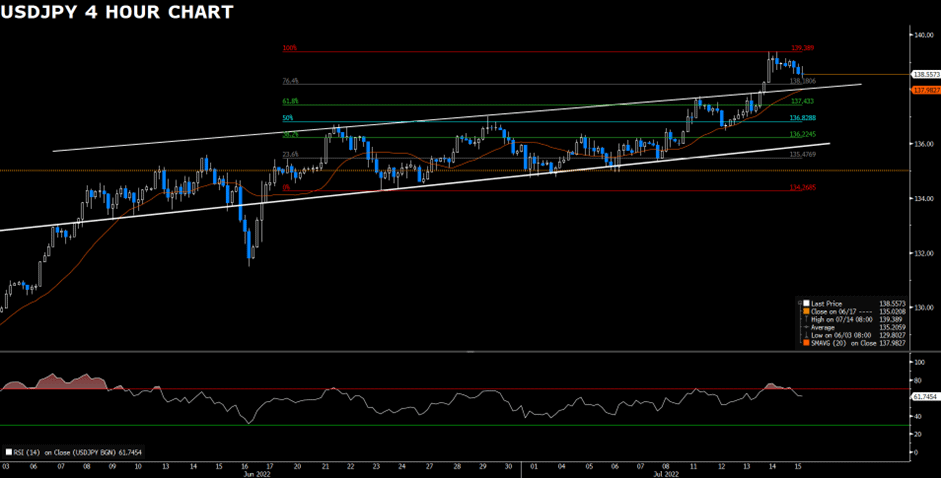
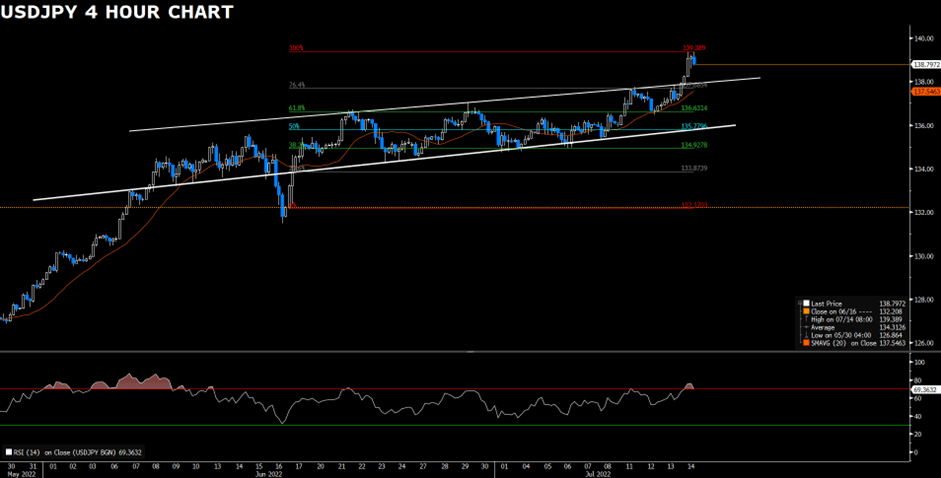
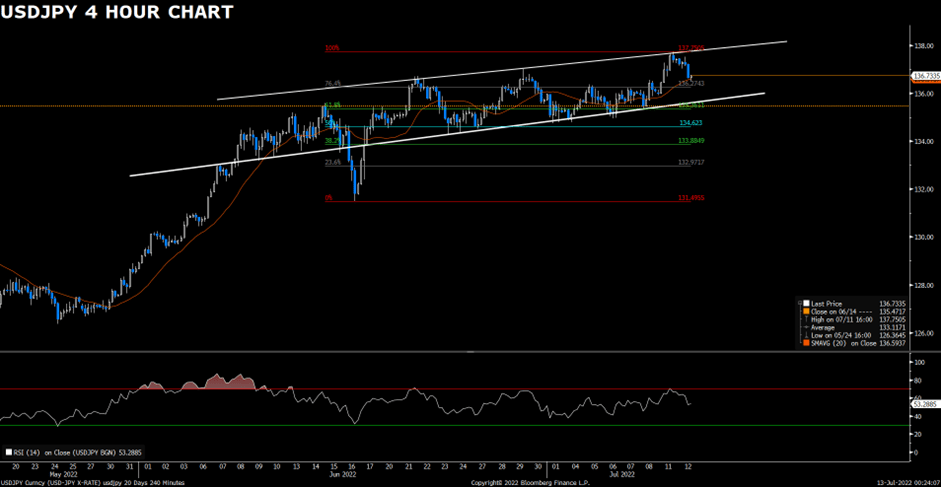
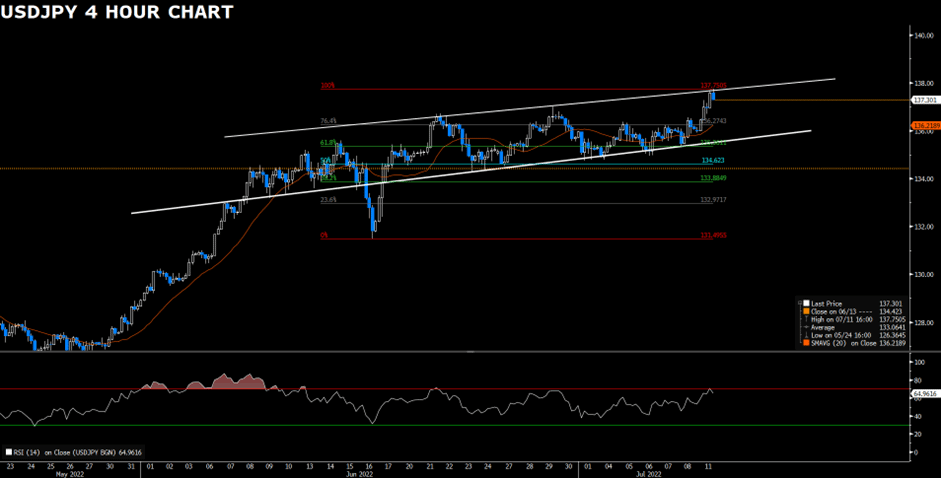
USDJPY consolidates the biggest daily gains in a month following the US Retail Sales and Michigan Consumer report. Technical speaking, USDJPY trades in the range of 138.18(76.4% of the Fib. Retracement) and 139.38(100% of the Fib. Retracement.) USDJPY witnesses some profit taking after contesting the resistance level of 139.38, the highest in 21 years. The corrective pullback erodes a part of the previous day’s strong gain. The intraday bias remains strongly bullish as the pair continues to trade above the ascending channel and above the 20 Simple Moving Average. On the downside, the breakout of the immediate support of 138.18 and the 20 Simple Moving Average would pressure USDJPY’s buyers, attracting some follow-through sellers. However, as long as USDJPY can trade above 136.22, the overall momentum remains upside.
Resistance: 139.38
Support: 137.88, 136.63, 135.77
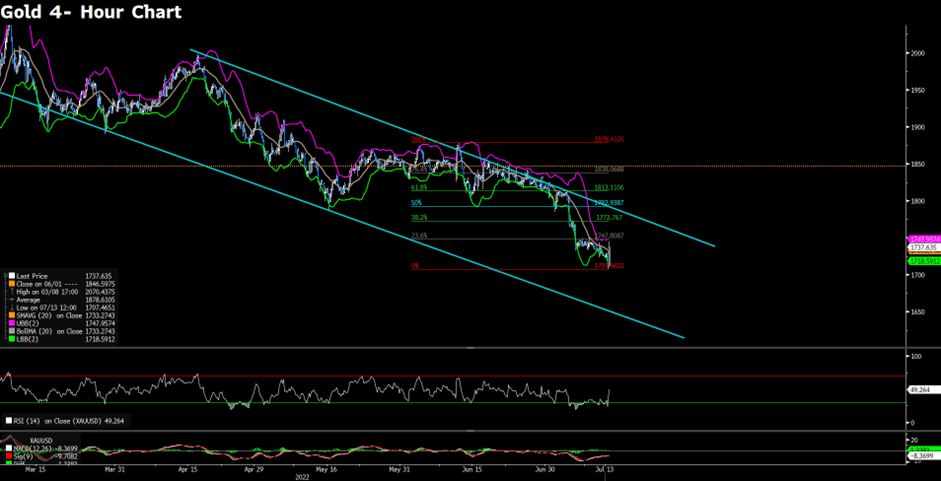
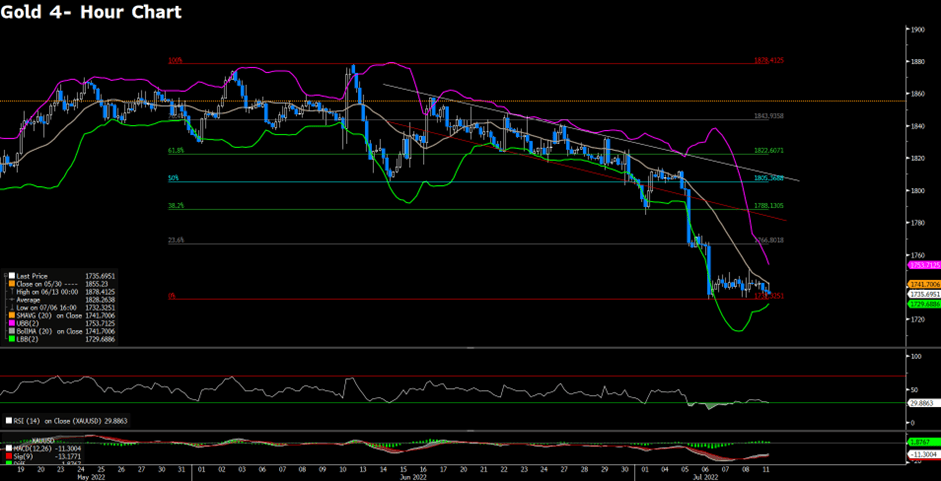
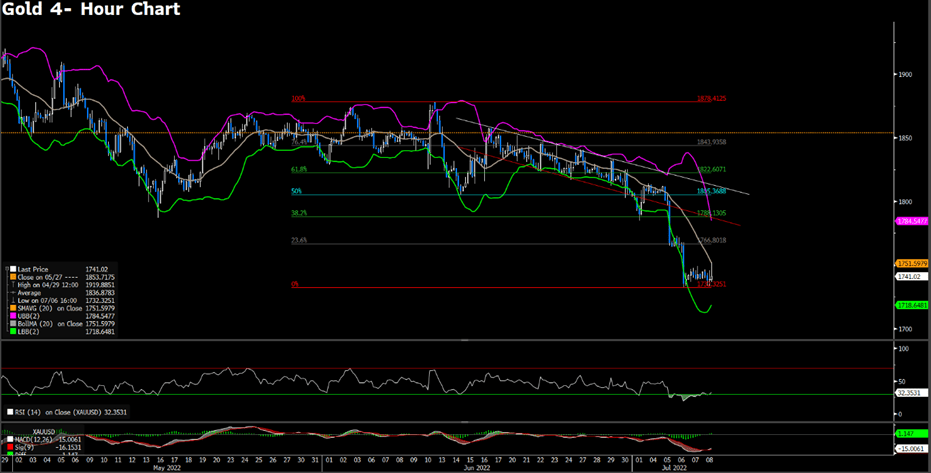
XAUUSD (4-Hour Chart)
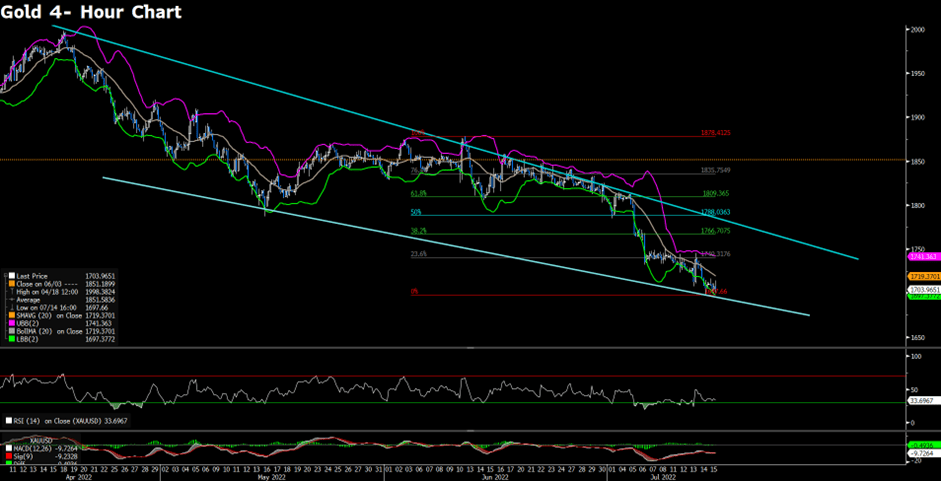
Gold steadies above $1,700 during the American session as falling US Treasury yields help limit further losses on gold. From the technical perspective, the intraday outlook of gold stays negative. Still, the psychological support of $1,700 seems to warrant some caution for bearish traders before positioning for any further drop. That being said, if the support fails to defend, then it is expected to see an accelerated decline in gold. On the contrary, gold needs to climb above $1,788 to declare its upside momentum on the four-hour chart. As the RSI indicator and the MACD remain hovering in the negative territory, the downward trajectory could further get extended.
Resistance: 1740.31, 1766.70, 1788.03
Support: 1697.66
EURUSD (4-Hour Chart)
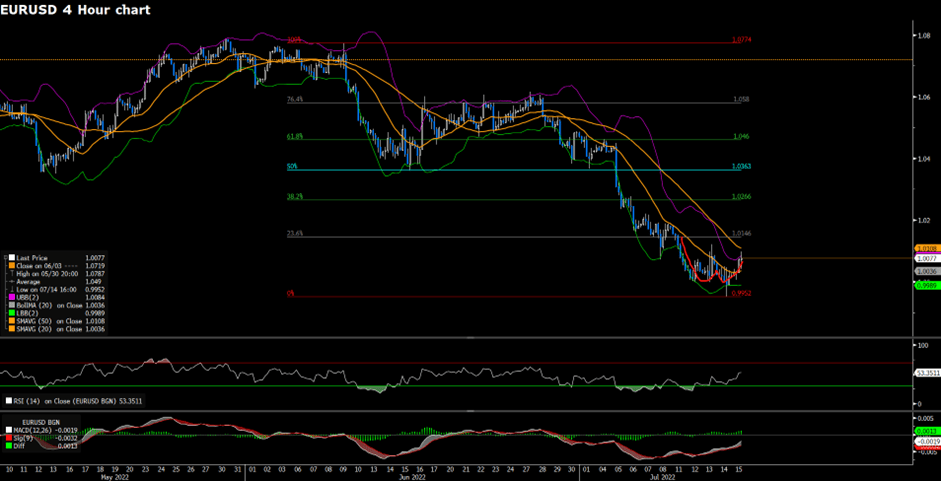
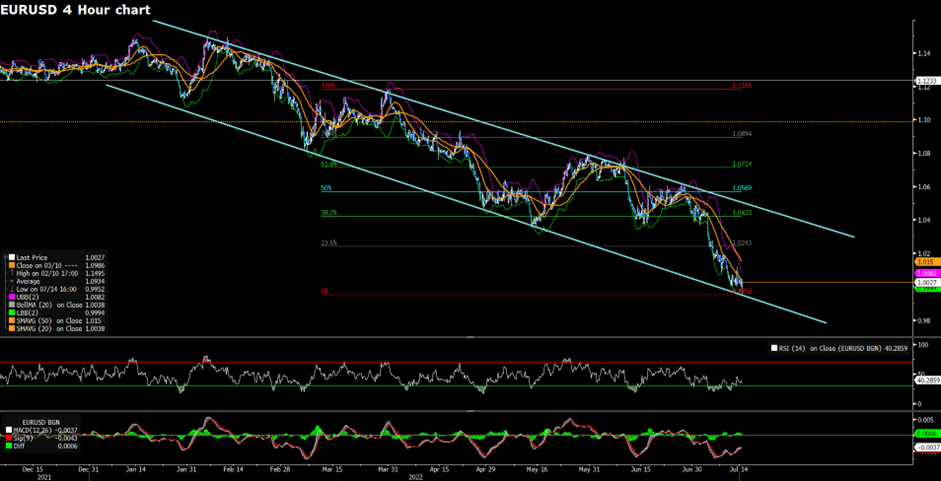
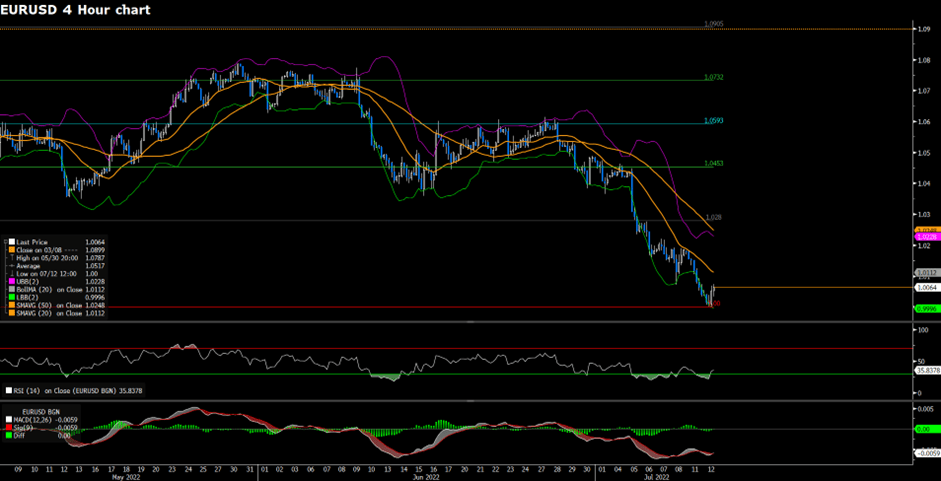
EURUSD extends its rebound above 1.0050 during the American session on Friday. The euro-dollar eases some selling pressure as the bet on a 100 bps interest rate hike from the Fed declines. From the technical perspective, EURUSD is moving outside the descending regression on the four-hour chart. EURUSD looks to build some upside momentum following the trading pattern of double-bottom. At the time of writing, EURUSD is expected to contest the resistance of 1.0146. In the meantime, the RSI indicator on the four-hour chart has surpassed the midline, suggesting that buyers are gradually back in the game.
Resistance: 1.0146, 1.0266, 1.0363
Support: 1.0000, 0.9952
Economic Data
| Currency | Data | Time (GMT + 8) | Forecast |
| JPY | Japan – Marine Day | All Day | None |
| NZD | CPI (QoQ) (Q2) | 06:45 | 1.5% |