USD/JPY traded around 158.70 on Tuesday, up 0.16%, as the US Dollar stayed supported by risk aversion amid geopolitical and economic uncertainty. The US Dollar Index held near 99.30 after easing from 99.50, with Middle East tensions supporting demand for safe-haven assets.
US preliminary S&P Global PMI data for March showed slower activity. The Composite PMI fell to 51.4 from 51.9, the lowest in 11 months, Services slipped to 51.1 from 51.7, and Manufacturing rose to 52.4 from 51.6.
Fed Expectations Shift
Market pricing has shifted towards the Federal Reserve keeping interest rates unchanged through the year, after earlier expectations for cuts. This comes as data point to slower growth alongside rising inflation pressures.
In Japan, February CPI rose 1.3% year-on-year, down from 1.5%, and core inflation eased to 1.6%. The Yen stayed relatively stable, while attention remains on wage trends and policy direction.
USD/JPY traded just below 159.00 without a clear direction, with a possible Bank of Japan rate rise at the 28 April meeting in focus. The pair reflects differing policy expectations between the US and Japan.
Looking back to this time in 2025, we were watching the tension in USD/JPY as it hovered below 159.00. The US dollar was strong due to risk aversion, but we also saw the potential for a Bank of Japan rate hike in April 2025. This divergence kept the pair in a tight range as we weighed a hawkish Fed against a potentially less dovish BoJ.
Outlook For Dollar Yen
The stagflation fears we noted in the US last year did materialize to some extent, forcing the Federal Reserve to keep interest rates elevated through all of 2025 and into this year. The latest US inflation data for February 2026 came in at 3.1%, which is still well above the Fed’s target and supports continued dollar strength. This policy divergence has widened significantly, pushing the pair well past the levels seen last year.
On the other hand, the Bank of Japan’s tightening cycle that was anticipated in spring 2025 has been extremely cautious. While a small rate hike did occur, the latest Tankan survey for Q1 2026 shows business sentiment is weakening, reducing the odds of further aggressive hikes. This confirms the yen has lost a key pillar of support that we thought might emerge last year.
Given that the fundamental driver of interest rate differentials is now even more in the dollar’s favor, we see continued upside pressure on USD/JPY from its current level around 162.50. Derivative traders should consider positioning for further yen weakness in the coming weeks. Buying call options on USD/JPY offers a way to profit from a potential move higher while defining risk.
Specifically, we should look at purchasing out-of-the-money calls with May 2026 expiry dates, targeting a strike price around 164.00. Implied volatility has been relatively contained, making long option strategies attractive from a cost perspective. This allows us to position for the next leg up as the policy divergence between the US and Japan continues to be the dominant market theme.
Create your live VT Markets account and start trading now.
Start trading now – Click here to create your real VT Markets account
Written on March 24, 2026 at 11:01 pm, by josephine
Gold traded quietly on Tuesday and struggled to extend Monday’s rebound, as markets assessed Middle East developments amid mixed messages from the US and Iran. XAU/USD was near $4,425 after bouncing from an intraday low of $4,306.
On Monday, President Donald Trump delayed planned strikes on Iranian energy sites for five days, citing constructive discussions, which helped Gold rebound from year-to-date lows near $4,098. Iranian officials later denied that talks were taking place, which limited follow-through.
Us Data And Fed Expectations
US data showed softer activity in March, with the S&P Global PMI easing to 51.4 from 51.9, an 11-month low. Services fell to 51.1 from 51.7, also an 11-month low, while manufacturing rose to 52.4 from 51.6.
With the Strait of Hormuz effectively closed, prices have been influenced by oil-driven inflation risks and expectations of higher rates. Markets now expect the Fed to keep rates unchanged through 2026.
Higher Treasury yields and a supported US Dollar have weighed on non-yielding Gold, while elevated oil prices have also supported the Dollar. Broad selling to raise liquidity has pressured global equities and Gold.
Technically, Gold remains below declining 50- and 100-period SMAs on the 4-hour chart, with RSI at 39. MACD has improved, but resistance sits at $4,450-$4,500, then $4,795 and $4,983, while support is $4,300 and $4,098.
Looking Back At The 2025 Low
Looking back, we remember the sharp rebound in gold from its 2025 lows near $4,098, which was driven by conflicting signals on US-Iran negotiations. That period of uncertainty created significant volatility as the market struggled for direction. The failure to find a quick resolution ultimately set the stage for the trends we are seeing today.
The oil-driven inflation fears from that time proved to be well-founded, as the prolonged disruption in the Strait of Hormuz caused Brent crude to average over $115 per barrel in the final quarter of 2025. This directly fed into stubbornly high inflation figures through the start of this year. The latest US Consumer Price Index report for February 2026 showed headline inflation at 3.7%, still well above the Federal Reserve’s target.
As a result, the market’s repricing of interest rate expectations, which began in 2025, has become our reality. We have seen the Fed hold rates steady at its first two meetings of 2026, with futures markets now pricing in less than a 20% chance of a rate cut before the fourth quarter. This has anchored the 10-year Treasury yield above 4.6%, maintaining significant pressure on non-yielding gold.
For those of us trading derivatives, this means implied volatility in gold options may rise on any geopolitical headlines, but the underlying price driver remains the high cost of holding the metal. Strategies that benefit from a range-bound or slowly declining price, such as selling out-of-the-money call options, continue to be relevant. The strong US Dollar, with the DXY index currently holding near 106.20, provides an additional headwind that supports this view.
From a technical standpoint, the resistance levels identified last year around the $4,500 mark proved to be a formidable ceiling. We have since seen prices grind lower, and as of today, gold is trading near $4,120. The key support level to watch in the coming weeks remains that critical 2025 low of $4,098.
Create your live VT Markets account and start trading now.
Start trading now – Click here to create your real VT Markets account
Written on March 24, 2026 at 11:00 pm, by josephine
EUR/USD reduced earlier falls on Tuesday as the US Dollar eased after the latest S&P Global PMI data. The pair traded near 1.1590, down about 0.20%, after an intraday low of 1.1567.
The US Dollar Index (DXY) was near 99.30 after slipping from around 99.50. The PMI updates were the first since the escalation of the Middle East conflict and showed slower activity in both the Eurozone and the United States.
Key Pmi Highlights
In the US, the Composite PMI fell to 51.4 from 51.9 and the Services PMI dropped to 51.1 from 51.7, both at an 11-month low. Manufacturing PMI rose to 52.4 from 51.6.
In the Eurozone, the Composite PMI declined to 50.5 from 51.9, a 10-month low, while Services PMI eased to 50.1 from 51.9. Manufacturing PMI increased to 51.4 from 50.8, the highest level in nearly four years.
Markets have shifted rate expectations amid Middle East tensions, with the Fed now expected to hold rates through 2026. Two ECB rate rises are fully priced in, and ECB’s Martins Kazaks said rises may be needed if inflation spreads from energy.
We remember seeing those PMI reports back in late 2025, which signaled trouble for both the US and Europe. The data pointed to a clear risk of stagflation, especially with the conflict in the Middle East causing energy prices to spike. This was the moment the outlook for central banks began to change dramatically.
Central Bank Divergence
The market’s forecast for central bank divergence proved correct, with the European Central Bank hiking rates twice since then, bringing its main rate to 5.00%. Meanwhile, the Federal Reserve has held firm, keeping its benchmark rate steady in the 5.25-5.50% range. This policy split has been the primary driver for the euro’s strength, pushing the EUR/USD from below 1.16 to its current level around 1.1850.
Given this backdrop, options strategies that benefit from a continued, but perhaps slowing, rise in EUR/USD seem prudent. We’ve seen implied volatility in the pair increase from around 6% in mid-2025 to over 9% by January 2026, and it remains elevated. Selling out-of-the-money puts on the euro could be a way to collect premium, assuming the ECB’s hawkish stance provides a floor for the currency.
Looking ahead, the key is to watch inflation data on both sides of the Atlantic. Recent Eurozone HICP inflation cooled slightly to 3.8% in February, which might make the ECB hesitant to signal more hikes. Any hint from Fed officials that they are becoming concerned about the strong dollar could also quickly reverse the trend.
The interest rate differential between Europe and the US has narrowed significantly, which continues to support the euro. Traders should consider using futures to express a view on the direction of this spread itself. This allows for a more direct play on monetary policy divergence without being fully exposed to the spot currency’s daily noise.
Create your live VT Markets account and start trading now.
Start trading now – Click here to create your real VT Markets account
Written on March 24, 2026 at 11:00 pm, by josephine
Sterling is down 0.2% against the US dollar and is trading near 1.34 after rebounding from mid‑March lows. Recent price moves have been contained, with the pair consolidating in a narrow band.
UK PMI readings were mixed, with manufacturing slightly stronger and services slightly weaker. Both indices remain just above the neutral 50 level, indicating mild expansion.
BoE Speech In Focus
Markets are focused on a speech by Bank of England Chief Economist Huw Pill at 9:30am ET. Rate pricing has shifted, with expectations now at just over 60 bps of tightening by December.
Technical measures show the daily RSI just below 50 after moving up from oversold levels. Near-term resistance is seen at 1.3450, with a short-term range between 1.3350 and 1.3450.
Price action is described as having confirmed a bullish reversal and an upward trend from the 13 March lows. Geopolitical developments are a main near-term driver for the pound.
We remember this time last year when the Pound was holding a range around 1.34 against the Dollar, with markets pricing in further interest rate hikes. Today, the situation has reversed, with rate cuts now being the primary focus for the Bank of England. This fundamental shift requires a completely different approach to the market.
Options Volatility And Strategy
Current UK inflation has finally cooled, with the latest CPI figure for February 2026 coming in at 2.3%, much closer to the Bank’s target. However, this has come at the cost of economic growth, which was a stagnant 0.1% in the last quarter of 2025. This weak backdrop makes it difficult for the BoE to justify holding rates at their current levels for much longer.
Given the expectation of policy divergence with the US, derivative traders should consider strategies that benefit from a weaker Pound. Buying GBP/USD put options with expirations in the second quarter offers a way to position for a decline towards the 1.29 level seen late last year. This strategy allows traders to define their maximum risk while maintaining exposure to downside moves.
The shift in central bank guidance has also pushed implied volatility higher in the sterling options market. One-month implied volatility on GBP/USD is now hovering near 8.5%, up from the sub-7% levels we saw for much of 2025. This suggests traders could use strategies like long straddles or strangles around key BoE meeting dates to trade the expected price swings.
In contrast to the UK’s sluggish performance, recent data from the US shows more resilience, with the latest non-farm payrolls report in February 2026 adding a solid 195,000 jobs. This economic outperformance supports a stronger dollar, reinforcing the bearish case for the GBP/USD pair. This divergence is the key theme that was not present this time last year.
Create your live VT Markets account and start trading now.
Start trading now – Click here to create your real VT Markets account
Written on March 24, 2026 at 10:59 pm, by josephine
Deutsche Bank said the Iran conflict could test the petrodollar system and the US Dollar’s role as the world’s reserve currency. It said changes in Middle East oil trade, sanctions, and alternative payment systems could reduce Dollar use in trade and savings over time.
The bank said pressure on the petrodollar system existed before the conflict, as most Middle East oil is now sold to Asia rather than the US. It said oil from Russia and Iran has been traded outside Dollar channels due to sanctions, and that Saudi Arabia has localised defence and trialled non-dollar payment systems such as Project mBridge.
Risks To The Petrodollar Structure
It said the conflict may strain US-backed protection for Gulf infrastructure and maritime routes used for oil shipments. It added that damage to Gulf economies could lead to a sell-down of foreign asset savings.
The bank noted reports that ships passing through the Strait of Hormuz may be allowed through in exchange for oil payments in yuan. It said this could support a shift from petrodollar use towards use of the yuan in oil trade.
The article said it was created with an Artificial Intelligence tool and reviewed by an editor.
The long-term legacy of the Iran conflict is testing the foundations of the petrodollar regime. We are watching for downstream effects on the dollar’s use in global trade and savings. This situation has the potential to fundamentally alter the dollar’s role as the world’s primary reserve currency.
Portfolio Positioning And Market Hedges
These pressures were building even before the recent escalations we saw throughout 2025. Data released for the first quarter of 2026 shows that non-dollar oil trades, primarily in yuan, now account for over 20% of global volume, a sharp increase from just 12% at the start of last year. This trend is accelerating as most Middle East oil now flows to Asia, not the US.
For the coming weeks, we should consider positioning for higher currency volatility, specifically in the USD/CNY pair. Buying long-dated put options on the dollar against a basket of Asian currencies could serve as an effective hedge against this structural shift. The VIX currency index for the yuan has already climbed 5% this month, indicating the market is starting to price in these risks.
The direct challenge to maritime security in the Strait of Hormuz remains a critical factor for oil prices. We should look at buying out-of-the-money call options on Brent crude futures to protect against sudden supply shocks. This strategy is prudent given the 10% price spike we witnessed during the shipping interruptions in the final quarter of 2025.
A world that is becoming more self-sufficient in defense and energy will likely hold fewer USD reserves. Recent reports from February 2026 show several central banks have continued to increase their gold holdings at the expense of U.S. Treasuries for the sixth consecutive month. This suggests we should anticipate greater volatility in US interest rates, making options on Treasury futures an attractive play.
Create your live VT Markets account and start trading now.
Start trading now – Click here to create your real VT Markets account
Written on March 24, 2026 at 10:59 pm, by josephine
The ECB Watchers’ Conference is set to feature Christine Lagarde, Philip Lane, Olli Rehn and Robert Holzmann discussing geopolitical risks and euro area monetary policy. The ECB is expected to reiterate that it is ready to act, but needs more time to assess risks, and that the Governing Council is in a stronger position than in 2022.
March PMIs showed diverging trends in France and Germany. France’s services PMI fell to 48.3 (TDS/mkt: 49.0), signalling a faster contraction as demand weakened amid geopolitical uncertainty and pre-election caution.
France Germany PMI Divergence
Germany’s manufacturing PMI rose to 51.7 (TDS: 49.0; mkt: 49.5), the strongest production growth in over four years. This improvement was linked to increased orders tied to the Middle East conflict and stockpiling.
Input costs rose in both countries, largely due to energy and materials. Firms in neither economy had yet passed these costs through to consumers.
Employment conditions weakened in both France and Germany. Jobs were cut faster and hiring slowed, while business sentiment deteriorated amid uncertainty linked to the Iran conflict.
The European Central Bank remains in a holding pattern, signalling it needs more time before making policy moves. This implies short-dated rate volatility (such as on Euribor options) may be overpriced in the near term, and with the deposit rate at 3.50% the market’s expectation for a summer rate cut is being tempered by this cautious messaging.
Cross Market Relative Value
The divergence between Europe’s two largest economies presents a relative value opportunity. A potential approach is positioning for German outperformance via DAX call options while pairing with CAC 40 puts, aiming to isolate French weakness from broader European beta.
Rising input costs, driven by Brent back above $95 a barrel, remain a key pipeline risk that has not yet shown up in consumer inflation. The February 2026 HICP reading of 2.8% suggests inflation is still sticky, and any evidence of cost pass-through could force the ECB’s hand later this year; PPI prints are a key leading indicator to monitor.
Worsening business sentiment tied to the Iran conflict argues for downside protection. Given the sharp policy pivots seen in 2022 (as a reminder when looking back from 2025), out-of-the-money Euro Stoxx 50 puts could provide a relatively cost-effective hedge against a broader risk-off move driven by geopolitical escalation.
Create your live VT Markets account and start trading now.
Start trading now – Click here to create your real VT Markets account
Written on March 24, 2026 at 10:59 pm, by josephine
Bank of England Chief Economist Huw Pill said the BoE is ready to act against inflationary pressures linked to developments in the Middle East war. The remarks were included in a BoE text released on Tuesday.
He said uncertainty cannot be used as a reason to delay action. He added that policy makers should set out clearly how they will pursue price stability.
Bank Of England Signals Higher For Longer
Pill said the BoE is prepared to respond if needed to limit any lasting new inflationary pressures. He also said risks to price stability are rising due to events in the Gulf.
He said there is a need for caution in how monetary policy is conducted. The comments focused on delivering price stability over the medium term.
Given these hawkish signals, we see the Bank of England is preparing to keep interest rates elevated to combat inflation driven by the Middle East war. Traders should anticipate that the possibility of UK rate cuts in the near future has significantly decreased. This is a direct response to rising geopolitical risk and its impact on prices.
This stance is reinforced by recent events, as Brent crude oil has already climbed to nearly $98 a barrel following renewed shipping disruptions in the Strait of Hormuz. The latest UK inflation figures for February 2026 also surprised us, coming in at 2.8% when a fall to 2.4% was expected. Pill’s warning suggests the Bank sees this energy-driven price pressure as a lasting threat.
Trade Implications For Rates Fx And Risk Assets
In the coming weeks, we should consider selling SONIA futures contracts, a direct bet against the rate cuts that the market had been pricing in. Before this, the curve implied at least two 25-basis-point cuts by the end of 2026. This repricing away from cuts will likely be the dominant theme in UK rates.
This policy shift should provide support for the British Pound, making long positions attractive. We can express this view by buying call options on GBP/USD, as higher-for-longer interest rates will likely strengthen the currency against its peers. The “fog of uncertainty” mentioned will also push up implied volatility on Sterling currency pairs.
For equities, this is a clear headwind, as higher borrowing costs pressure company earnings. Buying put options on the FTSE 100 index would be a prudent way to hedge against a potential market downturn. We expect rate-sensitive sectors like real estate and utilities to underperform in this environment.
We saw a similar pattern back in early 2025 when an unexpected surge in energy prices forced the Bank to postpone its easing cycle for two quarters. That period showed us the Bank will prioritize fighting energy-led inflation over supporting short-term growth. It appears we are seeing a repeat of that playbook now.
Create your live VT Markets account and start trading now.
Start trading now – Click here to create your real VT Markets account
Written on March 24, 2026 at 10:58 pm, by josephine
USD/CAD was little changed, with the pair pushing its recent range but failing to hold above the mid‑1.37s. The Canadian Dollar stayed below an estimated fair value near 1.3402, while USD strength above the mid‑1.37 area was described as marginal and short‑lived.
Oil prices and Canada’s terms of trade were cited as supporting the CAD, alongside narrower spreads. Markets were also weighing Bank of Canada tightening risks, after the BoC kept the policy rate unchanged last week and signalled a “wait and see” approach linked to the Gulf situation.
Technical Picture And Key Levels
Technical conditions for the CAD were described as largely unchanged. The mid‑1.37 zone was referenced as a resistance area, with support noted at 1.3690/00.
The piece states it was produced with the help of an AI tool and reviewed by an editor.
We are seeing the USD/CAD pair continue to push against resistance in the mid-1.37s, but these moves are failing to hold. Any gains above this area appear short-lived, suggesting selling interest is building. This creates a well-defined cap on the market for the near future.
The Canadian dollar’s strength is being supported by fundamentals, especially with WTI crude oil prices stabilizing above $85 per barrel this month. Meanwhile, with recent data showing Canadian inflation holding at 2.8% in February, the Bank of Canada remains in a cautious “wait and see” mode. This reduces the chance of imminent rate cuts that would weaken the currency.
Trade Setup And Risk Triggers
The pair is currently trading significantly above what we estimate to be its fair value, which is closer to 1.3400. We saw a similar pattern for much of 2025, where rallies above the 1.3800 level were consistently met with selling pressure. This historical action strengthens our belief that the current resistance is significant.
Given this strong ceiling, rallies toward the 1.3750-1.3800 zone should be viewed as selling opportunities. Options strategies that profit from the pair failing to break higher, such as selling call spreads with strike prices above 1.3750, would be appropriate. These positions can capitalize on the pair either falling or simply staying within its current range.
Immediate support sits around the 1.3690 to 1.3700 area. A decisive break below this level could accelerate a move lower. Traders could therefore use a break of this support as a signal to initiate bearish positions, such as buying puts, targeting a move towards the 1.35s.
Create your live VT Markets account and start trading now.
Start trading now – Click here to create your real VT Markets account
Written on March 24, 2026 at 10:58 pm, by josephine
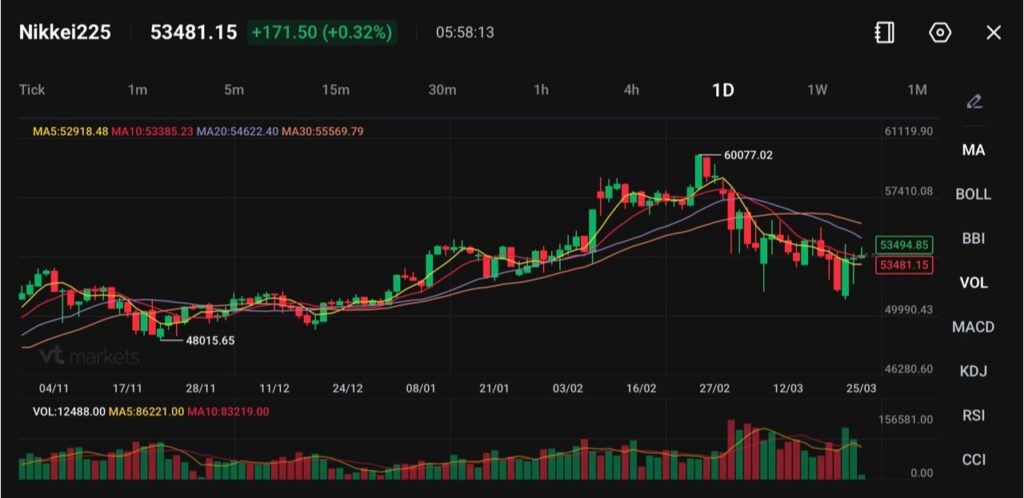
Nikkei 225 rises 2.93% to 53,784.43, with Topix up 2.5% to 3,648.78.
Oil price pullback boosts sentiment in energy-dependent Japan.
Gains led by Tokio Marine (+9.8%), SoftBank (+8%), and AI-linked stocks.
Japan’s Nikkei 225 rallied strongly on Wednesday, advancing 2.93% to 53,784.43, as markets responded to a drop in oil prices and signs that geopolitical tensions may ease.
The broader Topix index also climbed 2.5% to 3,648.78, reflecting widespread buying across sectors.
The move marks a sharp rebound after recent volatility, as traders reacted to improved sentiment following a decline in crude prices.
The rally may continue if oil prices remain contained, though geopolitical uncertainty could cap gains.
Oil Prices Drive Market Direction
The Nikkei’s rebound is closely tied to movements in oil. As an economy heavily reliant on imported energy, Japan is particularly sensitive to changes in crude prices.
The recent drop in oil prices provided relief, easing concerns around inflation and corporate cost pressures.
Strategists point to this as a key trigger for the rally, as lower energy costs improve earnings outlooks and support broader market sentiment.
However, the situation remains fluid. Any renewed spike in oil prices could quickly reverse gains.
Sustained declines in oil would support equities, while renewed supply disruptions may pressure the index again.
Geopolitical Signals Offer Tentative Relief
Market optimism was also supported by comments suggesting progress toward a potential resolution in the Middle East conflict.
While no concrete agreement has been reached, even the perception of a possible de-escalation has been enough to lift risk sentiment.
At the same time, traders remain aware that tensions are ongoing, with conflicting signals continuing to drive volatility.
This creates a fragile environment where markets can shift quickly based on headlines.
Broad-Based Gains Across The Market
The rally in the Nikkei was broad, with 211 stocks advancing compared to just 14 decliners, highlighting strong participation.
Leading the gains was Tokio Marine Holdings, which surged 9.8% after Berkshire Hathaway disclosed a stake, boosting confidence in the insurer.
Berkshire Hathaway will invest $1.8 billion in insurer Tokio Marine, marking a significant increase in the US conglomerate’s exposure to the Japanese market https://t.co/LD64sJrwZq
Furukawa Electric rose 8.7%, while SoftBank Group gained 8%, both benefiting from continued momentum in artificial intelligence investment themes.
These sectors have become key drivers of market performance, reflecting global demand for AI infrastructure.
Technical Analysis
Nikkei 225 is trading near 53,481, up around 0.32%, showing a tentative rebound after the sharp sell-off from the 60,077 peak. The recent price action suggests the index is attempting to stabilise, but the broader structure still reflects short-term bearish pressure.
Technically, the index remains below key moving averages, which continue to cap upside attempts. The 5-day MA (52,918) is now turning higher and offering near-term support, while the 10-day (53,385) sits just above current price and is acting as immediate resistance. Further overhead, the 20-day (54,622) and 30-day (55,569) remain downward sloping, reinforcing the corrective phase.
Key levels to watch:
Support:52,500 → 50,000 → 48,000
Resistance:53,800 → 54,600 → 55,500
The index has formed a short-term higher low, which is constructive for a potential bounce. However, price is still trading within a broader lower high structure, meaning the recovery remains fragile unless resistance levels are reclaimed.
A break above 53,800 could open a move toward 54,600, where the 20-day average sits. Reclaiming that level would be the first sign of improving momentum. On the downside, failure to hold above 52,500 could reintroduce selling pressure and expose the 50,000 region.
Overall, the Nikkei appears to be in a corrective consolidation after a strong rally, with early signs of stabilisation but no confirmed trend reversal yet. The next directional move will likely depend on whether the index can push back above the 54,000–55,000 zone or loses support and resumes its decline.
What Traders Should Watch Next
The Nikkei’s direction will remain closely linked to external factors. Key areas to monitor include:
Why Did the Nikkei 225 Rise Today? The Nikkei rose as oil prices fell and optimism grew around a potential easing of Middle East tensions, improving sentiment for energy-dependent economies like Japan.
How Much Did the Nikkei Gain? The Nikkei 225 climbed 2.93% to 53,784.43, while the broader Topix index rose 2.5% to 3,648.78.
Why Are Oil Prices Important for Japan’s Stock Market? Japan relies heavily on imported energy. Lower oil prices reduce costs for businesses and ease inflation pressure, which supports equities.
Which Stocks Led the Nikkei Rally? Tokio Marine Holdings surged 9.8%, while Furukawa Electric rose 8.7% and SoftBank Group gained 8%, driven by strong demand for AI-related investments.
Why Did Tokio Marine Shares Jump? Tokio Marine rallied after Berkshire Hathaway disclosed a stake, boosting investor confidence and driving strong buying interest.
Why Are AI Stocks Supporting the Nikkei? Companies like SoftBank and Furukawa Electric are benefiting from continued investment in artificial intelligence, which remains a key growth theme in global markets.
Start trading now – Click here to create your real VT Markets account
Written on March 24, 2026 at 9:27 pm, by josephine
AUD/USD fell sharply on Tuesday and traded near 0.6950, as risk aversion lifted demand for safe-haven assets, including the US Dollar. Geopolitical tensions in the Middle East drove sentiment.
US President Donald Trump announced a five-day delay linked to a deadline involving the Strait of Hormuz, while referring to constructive discussions with Tehran. Iranian officials denied negotiations, and fresh Israeli strikes on Tehran added uncertainty.
Risk Sentiment And The Dollar
The US Dollar strengthened against major peers, while risk-sensitive currencies such as the Australian Dollar weakened. Markets reduced risk exposure as conflict concerns grew.
In the US, preliminary S&P Global data were mixed. Manufacturing PMI rose to 52.4 in March from 51.6 in February, while Services PMI eased to 51.1 from 51.7.
The US Composite PMI fell to 51.4, the lowest since April last year. It marked a second consecutive month of slower growth.
Australian preliminary S&P Global data weakened in March, with the Composite PMI falling to 47 after eighteen months of expansion. The decline was led by a sharp drop in services activity.
Australia Data And RBA Focus
The Reserve Bank of Australia raised its policy rate to 4.10%, but the Australian Dollar remained under pressure. Attention shifts to Australia’s inflation data due on Wednesday.
We are seeing a familiar pattern unfold, reminding us of the situation back in March 2025. Last year, a similar combination of geopolitical risk and a flight to safety drove the US Dollar higher, putting significant pressure on the Australian dollar. This dynamic pushed the AUD/USD pair down toward the 0.6950 level as traders unwound risk exposure.
Today, with AUD/USD trading significantly lower around 0.6580, the environment is comparable, though the specific geopolitical pressures may differ. Market volatility has been ticking up, with the VIX index recently climbing from 14 to over 17, reflecting a growing unease among investors. This renewed sense of caution is once again channeling funds into the US Dollar as a primary safe-haven asset.
The US economy continues to show resilience, much like the mixed but still expansionary picture we saw in 2025. The most recent S&P Global Flash US Composite PMI registered a solid 52.2, reinforcing the view that the Federal Reserve has little reason to cut rates aggressively. This relative economic strength makes holding US Dollars attractive, providing a yield advantage over other currencies.
Australia’s economic footing, while not in the sharp contraction seen this time last year, is less certain. With the RBA holding its cash rate at 4.35% and inflation still persistent at 3.4%, the central bank is in a difficult position. The weakness in its key trading partner, China, continues to weigh on the Aussie’s long-term outlook, making it vulnerable during global risk-off periods.
For derivative traders, this environment suggests that betting on increased price swings is a prudent strategy. Buying AUD/USD options, such as straddles or strangles, allows one to profit from a significant move in either direction without having to predict the exact outcome of geopolitical events. This is a way to trade the elevated uncertainty itself.
Given the strong underlying demand for the US Dollar, bearish positions on the AUD/USD pair remain compelling. Traders could consider buying put options to capitalize on further downside while strictly defining their maximum risk. The break of the 0.6600 support level last month signals that a test of 0.6500 could be imminent if risk aversion continues.
Looking ahead, the upcoming US Personal Consumption Expenditures (PCE) inflation data will be a critical driver for the US Dollar. A higher-than-expected reading would reinforce the “higher for longer” interest rate narrative and likely send the AUD/USD lower. Traders should therefore be positioned for a potential spike in volatility around that release next week.
Create your live VT Markets account and start trading now.
Start trading now – Click here to create your real VT Markets account
Written on March 24, 2026 at 8:59 pm, by josephine