
Key Takeaways
- In 2026, gold often dips during market fear as institutions sell their most liquid assets to raise quick cash.
- The dollar remains a primary short-term headwind, suppressing gold prices as global capital flows into dollar-denominated safety.
- Large-scale players view sharp pullbacks as strategic accumulation points rather than a signal to exit the market.
- Sustained high energy costs and oil prices are reintroducing long-term inflation issues that fundamentally support gold.
- Central banks are consistently shifting reserves away from fiat currencies, maintaining a strong foundation for a $5,000 reset.
The $5,000 Reset: Is Gold’s 2026 Rally Just Getting Started?
Gold‘s price action in 2026 has been somewhat erratic and left many confused. While the macro environment of geopolitical tensions and slowing global growth suggests further upside, gold has unexpectedly dipped during risk-off moments. Understanding this requires looking past short-term noise to the structural reset currently in progress.
Why Gold Falls in Risk-Off Moments
Traditionally, gold thrives when fear and uncertainty enter the markets. However, in recent months, sharp selloffs in risk assets have not always translated into immediate gold strength. This comes from liquidity dynamics rather than a breakdown in gold’s safe-haven role.
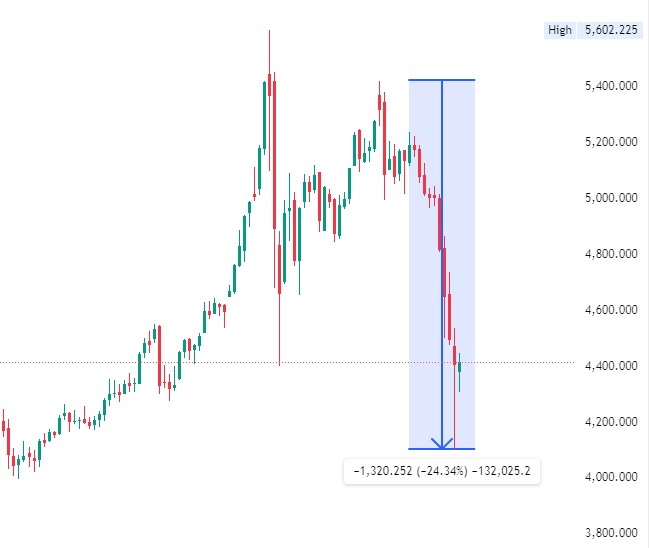
When markets turn risk-off abruptly, institutions often look for liquidity. This means selling what they can, not necessarily what they want to. Gold is one of the most liquid global assets and one that is easy to liquidate and therefore becomes a source of quick cash. In these moments, it becomes more of a funding tool than a hedge or store of value.
Additionally, the threat of margin calls across equities and derivatives increase and this means larger players need to unwind positions across the board. Gold gets caught in this cross-asset liquidation cycle which results in short-term downside pressure, even if the environment is fundamentally bullish for gold.
For retail investors, this creates confusion as it deviates from the norms as to what they are told to expect. But the reality is that the first phase of fear is often liquidation, not accumulation.
The USD and the Fiscal Time Bomb
The USD remains a dominant short-term variable, as global demand for safety often flows into dollar-denominated assets first, tightening liquidity and suppressing gold prices. However, this strength is often temporary. Once the initial liquidity squeeze passes, institutions often rotate back into gold as a strategic hedge against monetary instability and currency debasement.
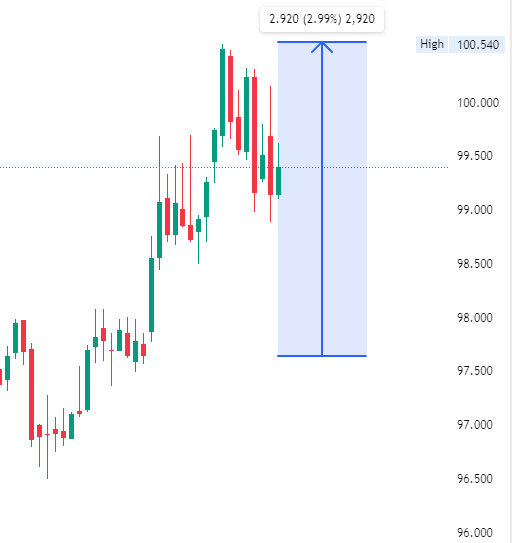
While the USD offers immediate safety, the long-term fiscal pressures across major economies limit the ability of policymakers to maintain tight monetary conditions indefinitely. This creates a fiscal environment where gold eventually outperforms fiat currencies as a core strategic asset.
Institutional Targets vs Retail Fears
One of the clearest divides in the gold market now is between institutional positioning and retail sentiment.
Retail investors react emotionally to price volatility. Sharp pullbacks create fear, leading many to exit positions prematurely as they feel that the rally is over.
Institutions, on the other hand, operate with longer time horizons and allocation strategies. They see dips as opportunities to accumulate at better levels rather than a signal of failure. They take a view on the wider macro-outlook, taking into consideration real interest rates, central bank policy, and long-term inflation expectations.
Institutions do not see volatility as a threat but just part of the market cycle.
Oil as a Leading Inflation Indicator
Whilst oil and gold are both commodities, the main drivers of each are significantly different.
Oil is closely tied to economic activity and supply-demand dynamics, whereas gold is driven by monetary conditions and investor psychology.
Where there is some correlation is through inflation. Rising oil prices can contribute to higher inflation expectations, which in turn supports gold. When energy costs surge, central banks face increased pressure, often leading to policy shifts that favour gold over time.
Before the conflict in the Middle East, periods of declining oil prices had signalled weakening global demand, triggering risk-off sentiment, which, as mentioned, can initially weigh on gold due to liquidity-driven selling.
Sustained higher prices in oil, which we have seen since the War started, can reintroduce the inflation issue for Central Banks, which in the long-term could support gold.
So, whilst oil does not drive gold directly, it does significantly influence the macro backdrop, which impacts gold prices.
Is 2026 Still the Year of the Bull?
Is 2026 still the year of the bull? Despite volatility, the case for a $5,000 reset is supported by central banks shifting away from fiat reliance and the persistent erosion of real returns. Current dips appear to be part of a liquidation cycle and a reset that allows the market to build a stronger foundation.
The 2026 Investor Playbook
- Ignore the Liquidation Noise: Recognise that initial price drops during crises often force sales, not a loss of value.
- Watch Real Rates: Inflation expectations continue to erode real returns, making gold’s lack of yield irrelevant compared to the loss of purchasing power in fiat.
- Follow the Institutions: Treat sharp pullbacks as strategic accumulation points, mirroring the behaviour of central banks and professional allocators.
Gold is no longer just a defensive asset; it is becoming increasingly strategic in an unpredictable world. Beneath the surface of 2026 volatility, the structural drivers for gold’s performance remain firmly in place.
The Big Questions
1) Why is gold falling during recent risk-off moments?
Gold is currently functioning as a primary source of institutional liquidity rather than a standard hedge. When markets turn volatile abruptly, institutions sell gold because it is easy to liquidate to raise quick cash or meet margin calls across other asset classes. This initial phase of market fear often triggers liquidation before the traditional accumulation phase begins.
2) How does the US Dollar influence gold prices in 2026?
The USD remains a dominant variable that typically pressures gold lower by making it more expensive for non-dollar buyers. Throughout 2026, global demand for safety has favoured dollar-denominated assets, which tightens liquidity and suppresses gold prices even when market uncertainty is high.
3) What is the difference between institutional and retail gold strategies?
Retail investors often react emotionally to price volatility and may exit positions prematurely during sharp pullbacks. In contrast, institutions operate with longer time horizons, viewing these dips as strategic opportunities to accumulate gold based on macro factors like real interest rates and central bank policy.
4) How do oil prices impact the gold market?
While driven by different fundamentals, oil influences gold through inflation expectations. Rising energy costs increase the pressure on central banks, often leading to policy shifts that favour gold as a long-term store of value.
5) Is the structural bull case for gold still intact?
The broader outlook for gold remains positive as central banks continue to accumulate the metal to reduce reliance on fiat currencies. Persistent fiscal pressures and eroding real interest rates across major economies support the case for non-yielding strategic assets despite short-term price fluctuations.
Start trading now – Click here to create your real VT Markets account


