Japan’s retail trade month-on-month (MoM) rose to 1.3% in March.
It had been -2% in the previous reading.
Implications For Bank Of Japan Policy
The strong rebound in Japan’s retail sales suggests consumer confidence is returning, directly fueling expectations for sustained inflation. This beat is significant because it provides the Bank of Japan with more evidence that domestic demand is firming up. We believe this data point alone could shift the central bank’s tone to be more hawkish in its upcoming meetings.
For currency traders, this strengthens the case for a more valuable Yen in the near term. A key strategy would be to use options to bet on the USD/JPY pair falling below the 155 level, a psychological support point that has been tested several times this year. As of late April 2026, volatility in this pair has been increasing, and this data will likely amplify those moves.
This positive economic signal also impacts interest rate derivatives, as it increases the probability of another BoJ rate hike before the end of the year. Traders should consider positions that benefit from rising Japanese government bond yields, such as shorting JGB futures. Current market pricing shows only a 30% chance of a rate hike by September, and this data could cause a rapid repricing of those odds.
On the equity side, the situation is more complex for the Nikkei 225 index. While strong domestic sales are good for retail-focused companies, the resulting stronger Yen hurts Japan’s major exporters. Therefore, we could see traders using options to hedge their Nikkei exposure, perhaps by buying put options to protect against a potential downturn driven by currency headwinds.
This consumer strength is a notable shift from the more tepid spending patterns we observed throughout 2025. That previous weakness was a primary reason for the BoJ’s cautious stance last year. This new data suggests the wage increases seen during the spring “shunto” negotiations are finally translating into actual spending.
To ensure fair trading conditions and manage market volatility during major economic announcements and special market conditions, VT Markets will apply temporary leverage adjustments on certain trading products during specific news periods and market opening/closing.
These adjustments are designed to protect clients from abnormal market fluctuations, sudden liquidity changes, and extreme price movements that may occur during high-impact events or reduced market liquidity periods.
1. Products Affected
The temporary leverage adjustment may apply to the following products:
• Forex
• Gold
• Silver
• Oil
• Indices
• Commodities (including XPT and XPD)
2. Adjusted Leverage During News Releases and Market Opening/Closing
During the specified period, maximum leverage will be adjusted as follows:
Forex: 200
Gold: 100
Silver: 50
Oil: 10
Indices: 50
Commodities: 5
Please note that each product with leverage already below the above will not be affected.
3. News Events That Can Trigger the Adjustment
Leverage adjustments may be applied during major economic announcements including:
• FOMC Interest Rate Decisions
• CPI (Consumer Price Index)
• GDP
• PMI / NMI
• PPI
• Retail Sales
• Non-Farm Payroll (NFP)
• ADP Employment Data
• Crude Oil Inventories
The above data is for reference only. Other significant macroeconomic releases from major economies may also be included.
Please refer to the table below for details of the upcoming events and affected instruments:
All dates and times are stated in GMT+3 (MT4/MT5 server time).
4. Affected Period of News Releases and Market Opening/Closing
Temporary leverage adjustments apply during the following periods:
Economic News Period
• 15 minutes before the announcement
• 5 minutes after the announcement
Market Opening / Closing Period
• 3 hours before the weekly market closing (Friday)
• 30 minutes before daily market closing (Monday – Thursday)
Additional Conditions (Effective from 27 April 2026):
• If the following day is a full-day Gold market holiday, the Friday rule will also apply
→ Leverage will be reduced 3 hours before market close
• If the previous day is a full-day Gold market holiday, the Monday rule will also apply
→ Leverage will be reduced 30 minutes after market open for Gold, Silver, Oil, Forex, NAS100, SP500, DJ30, US2000
After the above period ends, leverage will automatically return to the original leverage.
5. Important Rules
• The adjustment only affects new positions open during the adjustment period
• Positions opened before the adjustment period will not be affected
• Once the adjustment period ends, original leverage will resume automatically
We strongly encourage clients to take these temporary leverage adjustments into account when planning trading strategies during high-impact economic events or special market conditions.
If you have any questions, please contact our support team: [email protected].
Japan’s industrial production in March fell by 0.5% month on month. The market forecast was a 1.1% rise.
The outcome was 1.6 percentage points below the forecast. This indicates output declined rather than increased during the month.
Implications For Monetary Policy And The Yen
This unexpected drop in March’s industrial output signals a clear slowdown in the Japanese economy. The data makes it highly unlikely the Bank of Japan will consider tightening its policy in the near future. We should therefore anticipate continued pressure on the yen, strengthening the case for long positions in currency pairs like USD/JPY and EUR/JPY.
Looking deeper, the interest rate differential remains the key driver, with the Bank of Japan’s rate near 0.1% while the US Federal Reserve holds steady around 4.75%. This significant gap has been fueling the yen’s weakness for over a year, pushing USD/JPY past the 162 mark just last week. This fresh sign of economic weakness suggests traders should consider buying USD/JPY call options, targeting the 165 level in the coming months.
For equity traders, this weak domestic data presents a familiar opportunity for the Nikkei 225. A weaker yen directly inflates the overseas earnings of Japan’s major exporters, a powerful catalyst for the index. We saw this pattern throughout 2025, when the Nikkei surged to record highs despite sluggish internal growth, and this report suggests the trend will continue.
Therefore, buying Nikkei 225 futures or call spreads seems like a logical response. The currency tailwind should outweigh concerns about the domestic economy for large-cap exporters in the automotive and electronics sectors. We can also look at selling put options on these export-oriented companies, as the weak yen provides a strong floor for their valuations.
WTI, the US crude oil benchmark, traded near $104.90 in early Asian hours on Thursday. Prices rose as the US maintained a naval blockade of Iranian ports and the UAE announced it will leave OPEC.
On Wednesday, US President Donald Trump said the blockade would continue until a deal is reached with Tehran on Iran’s nuclear programme, according to Bloomberg. Iran warned of “unprecedented military action” if US blockading of Iran-linked vessels continues.
Uae Exit And Iran Blockade
The UAE said it will exit OPEC on 1 May. The announcement on Tuesday followed weeks of missile and drone attacks on the UAE attributed to Iran, which is also an OPEC member.
The report linked the move to an “unprecedented energy crisis” connected to the Iran war. The developments added to tensions between the US and Iran, supporting higher WTI prices.
With WTI crude holding strong above $100, we see the lasting impact of the geopolitical turmoil that defined last year. The US naval blockade of Iran and the UAE’s departure from OPEC in 2025 have embedded a significant risk premium into the market. Derivative traders should therefore anticipate continued volatility and an upward bias in pricing for the near future.
The market’s nervousness is reflected in options pricing, with the CBOE Crude Oil Volatility Index (OVX) recently hitting 55, a level not seen since the initial price shocks of 2025. This high implied volatility suggests that buying outright call options will be expensive. We believe traders should consider strategies like bull call spreads to bet on further upside while mitigating the high premium costs.
Positioning For Continued Volatility
Recent supply data reinforces this bullish outlook, as last week’s EIA report showed a commercial crude inventory draw of 3.8 million barrels, nearly double the consensus forecast. This indicates that the disruption to global supply chains from the blockade is already tightening the US market significantly. We expect this trend to continue, making short positions exceptionally risky in the coming weeks.
We’ve also noted the spread between Brent crude and WTI has widened to over $8, its highest level in nearly two years. The conflict is disproportionately affecting the Brent benchmark, which is more exposed to seaborne trade disruptions from the Middle East. This makes a long Brent, short WTI spread trade an effective way to isolate and profit from the specific geopolitical risk.
Given that diplomatic channels between the US and Iran remain frozen, the odds of a sudden military escalation or further supply shock are high. We advise traders to position for sharp, upward price movements over the next several weeks. Any price dips caused by unrelated macroeconomic news should be viewed as opportunities to add to long positions.
GBP/USD fell from the 1.355 area on Wednesday, hitting about 1.3460 after 18:00 GMT and closing near 1.3480. Moves followed a Trump post at just after 08:00 GMT that helped push Brent above $110/bbl, the Fed holding at 3.5% to 3.75% with its most divided vote since 1992, and a rise in the 10-year US yield above 4.4%.
Thursday brings the BoE decision at 11:00 GMT with minutes, reports and the vote split, followed by Andrew Bailey at 11:30 GMT. At 12:30 GMT, the US releases March PCE, Q1 advance GDP, the Q1 Employment Cost Index and jobless claims, with Chicago PMI at 13:45 GMT.
Key Events And Market Focus
BoE consensus is a hold at 3.75% with an 8-1 vote, while markets price about 60 basis points of tightening by year-end. A Reuters poll found 17 of 22 economists rate UK stagflation risk as high or very high.
US forecasts are PCE 3.5% YoY (2.8% prior), core PCE 3.2% (3.0% prior), Q1 GDP 2.3% annualised (0.5% prior), and Employment Cost Index 0.8%. Friday includes ISM Manufacturing PMI at 14:00 GMT (53) and Prices Paid (80), plus Huw Pill at 11:15 GMT.
GBP/USD trades near 1.3481, with 15-minute resistance at 1.3526; daily EMAs sit at 1.3441 (50-day) and 1.3384 (200-day). The pair has ranged from about 1.33 to 1.36, after 1.316 in early April and above 1.357 mid-month.
We saw a similar trap for GBP/USD around this time in 2025, when a divided Federal Reserve and UK stagflation fears squeezed the pair. That period was defined by an oil shock and a hawkish Fed Chair Powell, which pushed the dollar higher. Now, on April 30, 2026, the fundamental conflict remains the same, with both central banks stuck between persistent inflation and slowing growth.
The situation for the Bank of England is particularly difficult, much like it was last year. The latest UK Consumer Price Index (CPI) data released last week showed headline inflation is still stubbornly high at 3.1%, well above the 2% target. Compounding this, the Q1 2026 GDP figures showed the economy grew by a mere 0.2%, confirming that the risk of stagflation we saw developing in 2025 is now a reality.
Volatility And Trade Setup
On the other side of the Atlantic, the Federal Reserve is also in a bind, which is providing underlying support for the US dollar. Core Personal Consumption Expenditures (PCE), the Fed’s preferred inflation gauge, came in at 2.9% for March, a level that prevents any serious discussion of rate cuts. This persistent inflation has pushed the yield on the 10-year US Treasury back up to 4.6%, attracting capital and strengthening the dollar.
This environment suggests that volatility in GBP/USD will remain elevated, creating opportunities for options traders. Implied volatility for one-month options is currently elevated at 9.2%, reflecting the market’s uncertainty ahead of next week’s US employment data. A strategy of buying straddles or strangles could prove effective, aiming to profit from a large price move in either direction rather than betting on a specific trend.
Looking ahead, the upcoming US Non-Farm Payrolls report next Friday will be the next major catalyst. Another strong jobs number would reinforce the “higher for longer” narrative from the Fed, likely pushing GBP/USD to test its recent lows around 1.2450. History shows that from 2023 through 2025, strong US labor market data consistently preceded periods of significant dollar strength.
The pair is currently trading in a tight range, caught between its 50-day moving average at 1.2550 and support near 1.2480. Much like the setup in 2025, the market is coiled for a breakout, and the path of least resistance appears lower given the dollar’s yield advantage. A decisive break below the 200-day moving average at 1.2420 would signal that the period of range-bound trading is over.
Brent crude for June rose $5.27, or 4.5%, to $123.30 a barrel at 0347 GMT after gaining 6.1% in the previous session.
WTI futures for June rose $2.42, or 2.3%, to $109.30 a barrel after climbing 7% in the previous session.
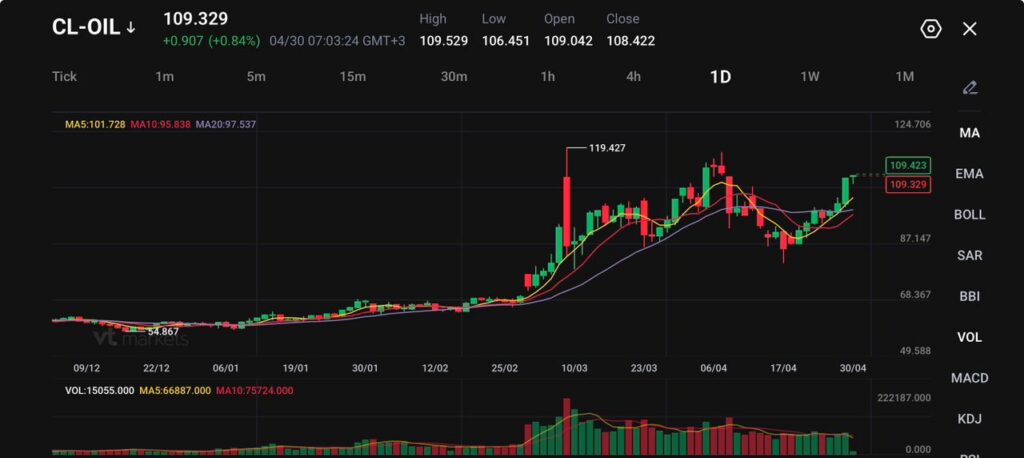
CL-OIL traded at 109.329, up 0.907 points, or 0.84%, with buyers holding price above the 5-day, 10-day, and 20-day moving averages.
OPEC+ is likely to agree a small increase of around 188,000 barrels per day in output quotas on Sunday.
Oil prices rose again on Thursday as the market moved from pricing a prolonged blockade to pricing possible military action. Reports said US President Donald Trump is due to receive a briefing on plans for a series of military strikes on Iran, intending to push Tehran back into talks over its nuclear programme.
Brent crude futures for June rose $5.27, or 4.5%, to $123.30 a barrel as of 0347 GMT after gaining 6.1% in the previous session. The June contract, which has risen for a ninth day, expires on Thursday. The more active July contract traded at $113.10, up $2.66, or 2.4%, after gaining 5.8% in the previous session.
Brent oil rose above $122 a barrel, a wartime high, on concerns the US may resume attacks against Iran, which will likely draw a swift response from Tehran and plunge the Middle East back into turmoil. Read more: https://t.co/hpIpZgktEC
US West Texas Intermediate futures for June climbed $2.42, or 2.3%, to $109.30 a barrel after rising 7% in the previous session. WTI has now climbed in eight of the last nine sessions. Both Brent and WTI are on track for their fourth month of gains.
The message is clear. Traders are no longer treating the Iran conflict as a short-term shock. They are now pricing a longer energy disruption, a deeper supply squeeze, and a higher risk that the ceasefire fails to become a settlement.
Hormuz Closure Keeps The Market Tight
The US and Israel began air strikes on Iran on February 28. Iran then retaliated by closing off almost all shipping through the Strait of Hormuz, one of the world’s key energy chokepoints. The ceasefire has paused active combat, but it has not reopened the strait. The US has also imposed a blockade on Iranian ports.
The IEA says the Strait of Hormuz handles a large share of global energy trade, including almost 20% of global LNG flows in 2025. That makes the closure a major problem for refiners, shippers, utilities, and governments trying to limit fuel inflation.
The IEA says the war in the Middle East has caused the biggest energy crisis in history. Jitania Kandhari of Morgan Stanley told Reuters the closure of the Strait of Hormuz could reshape the global energy map and China could be the unexpected winner https://t.co/kTNU1tCVoOpic.twitter.com/jsFpq6aenE
The talks remain stuck. The US wants Iran’s alleged nuclear weapons programme on the table. Iran wants some control over the strait, reparations for war damage, and relief from sanctions. Until either side moves, the market is likely to keep a high risk premium in Brent and WTI.
ING analysts said the oil market has moved from over-optimism to the reality of the supply disruption in the Persian Gulf. That shift matters because the market had been hoping the ceasefire would lead to faster relief. Instead, traders now see a longer period of blocked flows and tighter inventories.
A Months-Long Blockade Raises The Inflation Threat
Trump spoke on Wednesday with oil companies about how to reduce the impact of a possible months-long US blockade, according to a White House official. Reuters reported that the discussion involved major energy companies and focused on oil production, shipments, natural gas, and oil futures.
That tells the market two things. First, Washington is preparing for the conflict to last longer. Second, the White House knows oil prices are now a domestic inflation risk.
Higher crude prices feed into transport, shipping, power, petrochemicals, and food costs. If oil stays near $110 to $120, central banks may have less room to cut rates. That can support the US dollar, pressure equities, and raise the cost base for companies exposed to fuel and logistics.
The cautious forecast is that oil-linked inflation risk will stay active while Hormuz remains largely closed. A softer price move may need real signs of shipping recovery, not only diplomatic language.
OPEC+ Relief Looks Too Small For Now
OPEC+ is likely to agree a small increase of around 188,000 barrels per day in output quotas on Sunday. The meeting comes just after the United Arab Emirates’ withdrawal from OPEC, effective May 1.
In normal conditions, a supply increase would cap prices. This time, the market may treat it as too small. The scale of disruption around Hormuz and the Persian Gulf has reduced exports from major producers, while the UAE’s exit could weaken the group’s ability to control prices over time.
Analysts also argue the UAE’s extra freedom to raise output after exports restart may not change market fundamentals this year. Wood Mackenzie analysts said Gulf countries, including the UAE, will take months to return to pre-war production volumes.
That means OPEC+ may slow the rally, but it is unlikely to reverse it unless shipping routes reopen. The cautious forecast is that a 188,000-barrel-per-day quota increase will look symbolic if Hormuz remains constrained and military risk rises.
Technical Analysis Shows Buyers Still In Control
CL-OIL is trading near 109.30, extending its recovery and pushing back toward the upper end of the recent range after rebounding from the mid-April pullback. Price action shows buyers stepping back in with conviction, with the market now approaching levels that previously acted as a supply zone.
From a technical standpoint, momentum has turned firmly bullish in the near term. Price is holding above the 5-day (101.72) and 10-day (95.83) moving averages, both sloping higher and providing strong dynamic support. The 20-day (97.53) sits well below current price, reinforcing the strength of the rebound and suggesting the broader trend remains constructive despite earlier volatility.
Key levels to watch:
Support: 101.70 → 97.50 → 95.80
Resistance: 110.00 → 115.90 → 119.40
Price is now testing the 110.00 resistance zone, a key psychological level and an area where prior rallies have struggled to hold. A clean break and sustained move above this level could open the path toward 115.90, with further upside potential back toward the 119.40 high if momentum accelerates.
On the downside, 101.70 is acting as immediate support, aligning with short-term trend structure. A break below this level would weaken the current recovery and expose 97.50, though that would still sit within a broader bullish framework unless selling pressure intensifies further.
Overall, oil is reasserting its upward momentum after a corrective phase, with the 110 level now acting as the key inflexion point for whether the next leg higher can develop.
Market Implications
The oil rally now has a wider market force. If crude holds above $109 and Brent stays near the $120 area, inflation expectations may rise again. That can keep central banks cautious, support the dollar, and weigh on rate-sensitive equity sectors.
Energy shares may continue to attract buyers, but airlines, transport firms, consumer names, and manufacturers may face pressure from higher input costs. Emerging markets that import fuel may also feel strain through weaker trade balances and softer currencies.
The cautious forecast favours a bullish but volatile oil market while CL-OIL holds above 101.728. A move through 109.529 would keep 119.427 in focus. A fall below 106.451 may trigger short-term profit-taking, but the broader supply-risk premium is likely to stay in place while Hormuz remains shut and the US weighs military options.
Learn more about trading Energies on VT Markets here.
Trader Questions
Why Are Oil Prices Rising Again?
Oil prices are rising because markets are pricing a higher risk of military escalation against Iran.
Reports said US President Donald Trump is due to receive a briefing on possible military strikes on Iran, aimed at breaking the deadlock in negotiations over Iran’s nuclear programme. This has raised fears of deeper supply disruption in the Middle East.
How Much Did Brent And WTI Rise?
Brent crude futures for June rose $5.27, or 4.5%, to $123.30 a barrel as of 0347 GMT, after gaining 6.1% in the previous session.
The more active July Brent contract traded at $113.10, up $2.66, or 2.4%, after rising 5.8% in the previous session. US WTI futures for June rose $2.42, or 2.3%, to $109.30 a barrel, after climbing 7% in the previous session.
Why Is The Strait Of Hormuz Important For Oil?
The Strait of Hormuz is one of the world’s most important energy chokepoints.
Iran closed off almost all shipping through the strait after the US and Israel began air strikes on Iran on February 28. That has disrupted Middle East energy exports and kept a strong risk premium in oil prices.
Why Is Oil Rising Despite The Ceasefire?
Oil is rising because the ceasefire has paused active combat, but it has not ended the conflict or reopened the Strait of Hormuz.
The US has also imposed a blockade on Iranian ports. Talks remain deadlocked, with the US demanding discussion of Iran’s alleged nuclear weapons programme, while Iran wants control over the strait, reparations, and sanctions relief.
What Does A Months-Long US Blockade Mean For Oil?
A months-long US blockade could keep Iranian exports restricted and prolong shipping disruption across the region.
Trump spoke with oil companies about how to reduce the impact of a possible months-long blockade. That suggests Washington is preparing for a longer conflict, which may keep supply risk high and support oil prices.
Start trading now – Click here to create your real VT Markets account
Written on April 30, 2026 at 5:19 am, by josephine
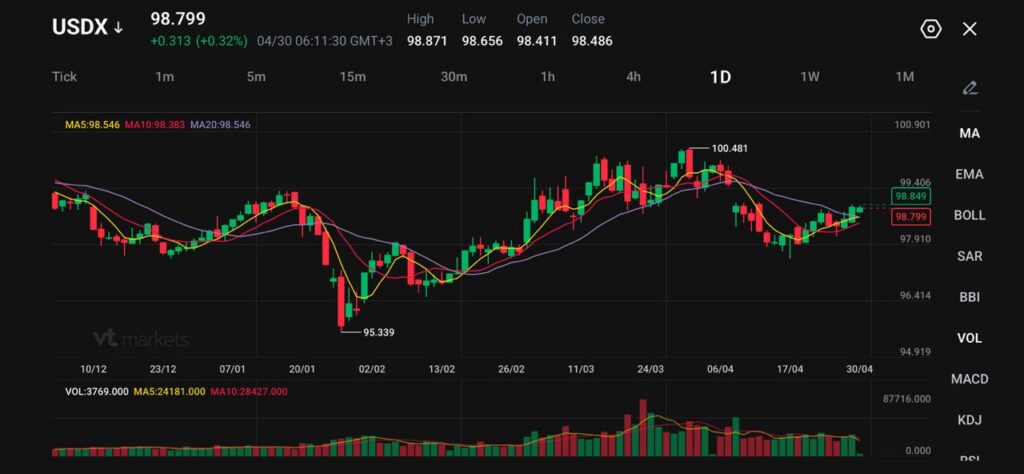
USDX traded at 98.799, up 0.313 points, or 0.32%, after reaching a session high of 98.871.
The Federal Reserve kept its policy rate unchanged at 3.50% to 3.75%, but four policymakers dissented from the decision.
Markets have fully priced out Fed rate cuts for this year and have started assigning odds to a possible hike in 2027.
The dollar index hovered near 99 on Thursday, holding recent gains after the Federal Reserve kept rates unchanged but delivered a more hawkish signal than markets had expected. The Fed left its benchmark rate at 3.50% to 3.75%, while four officials dissented.
That was the highest number of dissents since 1992, showing that the policy debate inside the Fed has become more divided as inflation risks rise.
The Federal Reserve held its benchmark interest rate steady on Wednesday amid uncertainty over when the conflict in the Middle East will be resolved. https://t.co/qGeVVL88Cgpic.twitter.com/5Jnu1bSEAp
The split matters for the dollar. One policymaker wanted a 25 basis point cut, while three opposed language that still pointed toward a possible easing bias. That tells markets the centre of gravity inside the Fed may be shifting away from cuts and toward a more neutral or even hawkish stance.
This has reshaped rate expectations. Markets have now fully priced out Fed rate cuts for this year and have started assigning odds to a possible hike in 2027. That gives the dollar a firmer base, especially when oil prices and geopolitical risk keep inflation concerns alive.
Iran Risk Adds A Safe-Haven Bid
The dollar also drew support from elevated tension in the Middle East. President Donald Trump said the US would maintain its naval blockade on Iran until a nuclear agreement is reached, while Tehran accused Washington of trying to force Iran into submission through economic pressure.
The United States expressed confidence that peace talks with Iran would go ahead in Pakistan and a senior Iranian official said Tehran was considering joining, but significant hurdles and uncertainty remained as the end of a ceasefire approached https://t.co/ErI17ffqGu
Reports also said Trump had pushed ahead with a prolonged blockade strategy after rejecting Iran’s latest proposal, which had delayed nuclear talks until shipping issues were settled.
This keeps the dollar supported through two channels. First, geopolitical stress tends to lift demand for liquid safe-haven assets. Second, the blockade keeps pressure on oil and energy costs, which can make the Fed more cautious about easing.
That mix favours the dollar over currencies tied to weaker growth or high energy-import costs. It also makes the next move in oil important for USDX. If energy prices stay elevated, the dollar may continue to draw support from inflation hedging and defensive flows.
ECB And BoE Decisions Could Shift The FX Balance
Attention now turns to the European Central Bank and the Bank of England later in the day. The ECB has a monetary policy meeting on 30 April, with its decision scheduled for 14:15 CET and a press conference later in the afternoon.
Bank of England deputy governor Sarah Breeden warns of a private credit crunch akin to the one suffered by the banking sector, but plays down the prospect of a financial crisis https://t.co/YNi0XZ4hEh
The Bank of England is also due to publish its April Monetary Policy Summary and minutes on 30 April. Its current Bank Rate stands at 3.75%, with the latest inflation rate listed at 3.3% against the 2% target.
These decisions matter because the dollar has already gained from the Fed’s hawkish tilt. If the ECB or BoE sound more cautious than the Fed, USDX could push higher. If they lean hawkish enough to support the euro or pound, the dollar’s rally may stall near resistance.
Technical Analysis
USDX is trading near 98.80, attempting to stabilise after a recent pullback from the 100.48 high, with price now edging higher within a developing short-term recovery phase. The broader structure still reflects a range-bound environment, but the latest price action suggests buyers are trying to regain control after the mid-April weakness.
From a technical standpoint, momentum is gradually improving but not yet decisive. Price is holding just above the 5-day (98.55) and 10-day (98.38) moving averages, both beginning to turn higher and offering immediate support. The 20-day (98.54) sits tightly clustered around current levels, reinforcing the idea that the market is at a pivot zone rather than in a clean trend.
Key levels to watch:
Support: 98.55 → 97.90 → 96.40
Resistance: 99.40 → 100.50 → 101.00
Price is now pushing toward 99.40 resistance, a level that has capped recent recovery attempts. A sustained break above this zone could open a move back toward the 100.50 high, where stronger selling pressure previously emerged. Follow-through beyond that would be needed to confirm a broader bullish continuation.
On the downside, 98.55 is acting as immediate support. A break below this level would weaken the recovery structure and expose 97.90, with a deeper retracement possible if downside momentum builds again.
Overall, USDX is trying to base after a pullback, with price action compressing around key moving averages. The near-term direction will likely depend on whether buyers can reclaim the 99.40 zone or if sellers step back in to reassert control below it.
Market Implications
A firmer dollar can pressure commodities, emerging-market currencies, and risk assets. Gold may struggle if USDX extends above 99.406, especially if yields stay firm. Oil remains more complex, because supply risk can keep crude supported even when the dollar rises.
For equities, the message is mixed. A stronger dollar and fewer rate-cut hopes can pressure growth stocks and multinational earnings. At the same time, the dollar may stay bid if traders seek safety from Iran-linked risk.
The cautious forecast favours a firm USDX range while price holds above 98.546 and 98.383. A clean break above 98.871 would support a move toward 99.406. A close above 99.406 could reopen the path toward 100.481. If the ECB or BoE lean hawkish, or if Iran headlines improve, the dollar may lose momentum and retest 98.383 before 97.910.
The dollar index is holding near 99 because the Federal Reserve kept rates unchanged but sounded more hawkish on inflation.
USDX traded at 98.799, up 0.313 points, or 0.32%, after reaching a session high of 98.871.
What Did The Federal Reserve Do?
The Federal Reserve kept its policy rate unchanged, as markets expected.
The key shift came from the tone. Four policymakers dissented from the decision, arguing the Fed should no longer signal a bias toward easing. That showed rising internal division over the policy outlook.
Why Did The Fed Sound More Hawkish?
The Fed sounded more hawkish because inflation concerns have grown, partly due to higher oil prices and the Iran conflict.
If energy prices stay high, transport and production costs can rise. That makes it harder for inflation to fall and gives the Fed less room to cut rates.
Are Markets Still Expecting Fed Rate Cuts This Year?
No. Markets have fully priced out Fed rate cuts for this year.
Traders are also starting to assign odds to a possible rate hike in 2027. That shift has supported the dollar because higher-for-longer rates tend to make the currency more attractive.
How Is The Iran Conflict Supporting The Dollar?
The Iran conflict is supporting the dollar through safe-haven demand and inflation risk.
President Donald Trump said the US would maintain its naval blockade on Iran until a nuclear agreement is reached. Tehran accused Washington of trying to force Iran into submission through economic pressure. This keeps geopolitical risk high and supports demand for the dollar.
Start trading now – Click here to create your real VT Markets account
Written on April 30, 2026 at 5:18 am, by josephine
US President Donald Trump said the United States will keep its naval blockade of Iran until it reaches a deal with Tehran on Iran’s nuclear programme, Bloomberg reported on Wednesday.
Trump said he rejected a recent Iranian proposal to reopen the Strait of Hormuz, saying it would have delayed nuclear talks until later.
Market Reaction And Immediate Price Impact
Iran warned on Wednesday of “unprecedented military action” if the US continues blockading Iran-linked vessels.
Trump said Iran cannot have a nuclear weapon, while Iran said its nuclear aims are peaceful.
West Texas Intermediate (WTI) was up 7.60% on the day at $104.90 at the time of writing.
We saw this exact situation play out last year, when tensions surrounding the US naval blockade sent WTI crude prices soaring over $100 a barrel. The immediate spike of over 7% showed how quickly the market prices in geopolitical risk from the Persian Gulf. This move signaled a clear opportunity in the energy markets for those prepared to act.
Risk Hedges And Volatility Positioning
In the weeks following that 2025 announcement, the correct strategy was to gain long exposure to crude oil prices through derivatives. Buying call options on WTI or Brent futures would have been the most direct way to profit from escalating tensions and potential supply disruptions. Given that about 21 million barrels of oil pass through the Strait of Hormuz daily, any blockade represents a severe threat to global supply.
At the same time, we needed to hedge against the wider economic fallout of a sustained oil price shock. This meant buying put options on sectors most vulnerable to high fuel costs, such as airline and transport ETFs. This strategy would have protected portfolios from the demand destruction that typically follows a rapid surge in energy prices.
These geopolitical events are textbook triggers for market volatility, so positioning for a spike in the VIX was critical. When we look back at 2025, the VIX index surged from the low 20s to over 35 in a matter of days. Buying VIX call options or VIX futures offered a direct and profitable way to trade the rising uncertainty in the broader market.
This reaction was not surprising, as we only had to remember the market’s response to the 2022 Russia-Ukraine conflict, which drove Brent crude to nearly $140 per barrel. Historical precedent shows that military confrontations involving major oil producers lead to sustained price increases and volatility. Our trading models from that period confirmed that these trends often persist for several weeks.
Even now in April 2026, the market is positioned cautiously, with the latest reports from the Energy Information Administration showing global crude inventories are still 3% below the five-year average. This underlying tightness means any new supply-side threat could cause a similarly explosive price reaction. The options market is currently pricing in a higher volatility premium for energy stocks compared to this time last year.
EUR/USD fell to about 1.1680 in early European trading on Thursday. The US Dollar rose after the Federal Reserve kept interest rates unchanged, with focus turning to the ECB decision later on Thursday.
The Fed held the federal funds rate at 3.5% to 3.75% at its April meeting. The decision passed 8-4, with four officials dissenting, the first time since October 1992 that four members opposed a committee decision.
Fed Decision And Leadership Shift
Three dissenters objected to wording that implied rate cuts could restart later. Jerome Powell said he will stay on as a Fed governor for an indefinite period after his term as chair ends.
Kevin Warsh, nominated by Donald Trump, is reported to be on track to succeed Powell as chair. Markets are watching how leadership changes may affect policy signals.
The ECB is expected to keep its key rates unchanged on Thursday amid high uncertainty. Inflation has been rising, linked to energy price swings connected to the Iran war, raising expectations of a June rate rise.
Goldman Sachs forecasts two ECB increases of 25 basis points. It projects hikes in June and September, taking the deposit rate back to 2.50%.
Market Volatility And Trading Positioning
Looking back at this time last year, the EUR/USD was under pressure near 1.1680 following a US Federal Reserve meeting. The dollar strengthened because the Fed held its benchmark rate steady at a range of 3.5% to 3.75%. This created an immediate opportunity for traders betting on short-term dollar strength.
The Fed’s decision in April 2025 was especially noteworthy because four officials dissented, the most since 1992. This significant internal division signaled deep uncertainty about the path forward for US monetary policy. We now know this conflict led to a period of unpredictable policy, which increased volatility in interest rate markets for the remainder of 2025.
At the same time, the European Central Bank was widely expected to hold rates, but markets were already pricing in future hikes. The expectation of a June rate increase was fueled by inflation concerns linked to energy prices. As we now know, the ECB did deliver a 25 bps hike in June 2025 when headline HICP inflation peaked at 4.1% for the quarter.
This divergence between a divided Fed and a determined ECB was a key signal for derivatives traders. The setup suggested buying volatility, as conflicting central bank policies often lead to larger price swings. Implied volatility on 3-month EUR/USD options jumped from 8% to over 12% in the weeks following that April 2025 meeting, rewarding those who bought straddles or strangles.
The smart directional play was to look past the dollar’s initial strength and position for a stronger Euro over the medium term. The ECB’s clear path toward hiking interest rates suggested the rate differential with the US would narrow, supporting the Euro. Options strategies like bull call spreads on the EUR/USD were profitable as the pair climbed back toward 1.2000 by the third quarter of 2025.
The leadership uncertainty at the Fed, with talk of Kevin Warsh succeeding Jerome Powell, also added to dollar weakness. This instability contrasted with a more stable outlook at the ECB. This environment favored traders using derivatives to hedge against or speculate on a weaker dollar beyond the immediate short term.
South Korea’s service sector output rose by 1.4% in March. This was up from 0.5% in the previous period.
The significant jump in South Korea’s service sector output for March confirms the economy is accelerating faster than anticipated. This strong domestic demand, especially when combined with the latest April manufacturing PMI which also showed expansion at 52.1, points to a broad-based recovery. We should therefore be positioning for further strength in Korean assets over the coming weeks.
Implications For Monetary Policy And The Won
We see this data supporting a stronger Korean won, as it pressures the Bank of Korea to maintain a more hawkish stance on interest rates. Looking back at the BOK’s surprise rate hold in late 2025, which caused a sharp rally in the won, we should anticipate they will be reluctant to signal any easing now. Consequently, long KRW positions, perhaps through USD/KRW put options to cap our risk, look increasingly attractive.
This economic vigor should translate directly into higher corporate earnings, making long positions on KOSPI 200 index futures appealing. The service sector’s health particularly benefits consumer-discretionary stocks, and we’re already seeing positive second-quarter earnings guidance from major exporters tied to global demand. This indicates the market’s upward momentum has solid fundamental support.
We should expect a near-term increase in market volatility as traders digest this stronger growth outlook and its implications for central bank policy. Implied volatility on KOSPI options may still be reasonably priced, presenting an opportunity to buy call spreads. This allows us to capitalize on a rising market while clearly defining our maximum risk.