VT Markets, a top-rated brokerage firm, has launched the VT Affiliate Challenger Cup 2022 (ACC 2022), a competition that rewards affiliates for referring new clients to their platform.
The ACC 2022 is open to VT Markets’ CPA Affiliates, Introducing Brokers or Hybrid program in over 60 countries from the Europe, Middle East, Africa (EMEA) and LATAM regions. Attractive cash prizes will be given to the best-performing affiliates. The champion will secure US$15,000, with the 1st and 2nd runners-up set to receive US$7,500 and US$3,000 respectively.
“At VT Markets, we attribute a big part of our success to our close partnership with the affiliates and IBs. This competition is part of our plan to strengthen ties with our loyal affiliates, as well as to enhance and expand our affiliate program. We believe it is also a great motivation for our affiliates to grow their business network and be appropriately rewarded for their referral initiatives,” commented John Georgiou, Director of Business at VT Markets.
In order to maximise their chances of winning, affiliates will be challenged to devise strategic business plans to boost the amount of deposits and trades made by their referrals. All affiliates will still be eligible to earn their regular referral commissions throughout the program.
The competition runs from 1 November 2022 to 28 February 2023.
VT Markets is a regulated multi-asset broker with a presence in over 160 countries. The broker has won many international accolades including Best Customer Service and Fastest Growing Broker. Their mission is to make trading an easy, accessible, and seamless experience for everyone.
US stocks declined lower on Monday, surrendered their early gains and ended a choppy session lower after two Federal Reserve officials highlighted the central bank’s resolve to be persistent until it brings inflation down meaningfully. Fed Vice Chair Lael Brainard said that it would be appropriate soon for the central bank to slow its pace of interest-rate hikes, which provided some support to the market sentiment. However, she further emphasized that the Fed had additional work to do to bring inflation down, keeping some investors on the edge.
Meanwhile, market players struggled to digest negative news coming from China, as the country keeps reporting record coronavirus contagions in Beijing and other big cities. The concerns about stricter lockdowns and the interruption of global shipments exerted bearish pressure on equity markets.
On the Eurozone front, the data released on Monday showed a bigger-than-expected increase in Industrial Production. The Gross Domestic Product (GDP) data today will also be important as the economy is facing the turbulence of soaring inflation, energy crisis, and supply chain bottlenecks due to Russia-Ukraine tensions.
The benchmarks, S&P 500 and Dow Jones Industrial Average both retreated lower on Monday as the S&P 500 snapped a two-day rally and treasury yields climbed. The S&P 500 was down 0.9% on a daily basis and the Dow Jones Industrial Average also dropped slightly with a 0.6% loss for the day.
Ten out of eleven sectors in the S&P 500 stayed in negative territory as the Real Estate sector and the Consumer Discretionary sector are the worst performing among all groups, losing 2.65% and 1.71%, respectively. The Nasdaq 100 meanwhile dropped the most with a 1.0% loss on Monday and the MSCI World index was up 1.8% for the day.
Main Pairs Movement
The US dollar advanced higher on Monday, regaining upside momentum and enjoyed some temporal demand at the beginning of the week amid mixed market sentiment. The anxiety ahead of the US midterm elections is providing some support to the safe-haven greenback, but the upside is restricted due to rising odds for a slowdown in the pace of rate hikes by the Federal Reserve (Fed). Fed Vice Chair Lael Brainard also supported the view of reducing the pace of policy tightening.
GBP/USD retreated lower on Monday with a 0.63% loss after the cable faced barricades around the 1.1800 level and dropped towards 1.1750 ahead of UK Employment/Autumn Statement. On the UK front, the contents of the UK Autumn Budget Statement from Chancellor Jeremy Hunt will be watched closely by investors. Meanwhile, EUR/USD remained under pressure and struggle around the 1.0330 area amid a stronger US dollar across the board. The pair was down almost 0.20% for the day.
Gold was nearly unchanged with a 0.01% gain for the day after climbing higher to a fresh three-month high around the $1,774 mark during the US session, as the yellow metal continues to garner demand as investors expect the Fed would ease off on a big interest rate hike.
Meanwhile, WTI Oil declined sharply with a 3.47% loss for the day amid negative Chinese news.
Technical Analysis
EURUSD (4-Hour Chart)
The EURUSD pair eases from a three-month high of 1.0363 on Monday as risk appetite cooled at the beginning of the new week. The pair was trading at the 1.0330 area at the time of writing, as investors keep a close eye on comments from central bankers, which, in turn, allows the US Dollar to hold its ground and limits the pair’s upside. In the Eurozone, Industrial Production was up by 0.9% MoM in September, also rising by 4.9% compared to a year earlier and beating market expectations. Moreover, there are growing hopes tensions between Russia and Ukraine could soon ease after Moscow retreated and Ukraine President Volodymyr Zelenskyy noted the country is ready for peace. However, the news should be taken with a pinch of salt, as it seems quite unlikely Russia will back from the separatist regions.
From the technical perspective, the four-hour scale RSI indicator remained above 70 figured as of writing, which suggested that the pair was still amid strong upside traction, but needed to be cautious about the corrective pullback. As for the Bollinger Bands, the euro was pricing in the higher area, above the 20-period moving average. Therefore, we think the positive buying would persist unless the price dropped below the 20-period moving average or the 1.0163 support.
Resistance: 1.0610, 1.0368
Support: 1.0163, 0.9951, 0.9730
GBPUSD (4-Hour Chart)
The GBPUSD has lost its recovery momentum after reaching above 1.1800 earlier in the day and retreated below 1.1750, with investors taking a step back and reassessing the market situation following last week’s risk rally. While commenting on the market reaction to the soft October Consumer Price Index data, Federal Reserve Governor Christopher Waller pushed back against optimism by saying that markets were “way out in front.” Waller added that the 7.7% annual CPI was still “enormous.” In the absence of high-impact macroeconomic data releases, market participants will pay close attention to what Fed officials say. In case safe-haven flows return to markets and Wall Street’s main indices turned south after last week’s impressive upsurge, the US Dollar could keep its footing and limit the British pound’s upside room and vice versa. In the domestic, investors could refrain from making large bets while waiting for the UK government to unveil its budget plan on Thursday. Chancellor Jeremy told the BBC on Sunday that he has been completely explicit that taxes are going to go up.
From the technical perspective, the four-hour scale RSI indicator slightly edged lower to 62 figured as of writing, suggesting that the pair witnessed less buying than last week. As for the Bollinger Bands, the pair was still pricing above the 20-period moving average, which is a signal that the pair was more favoured to the upside path. As a result, the price remained the positive tendency but the strength is mild unless there are any surprising events or breaking through the critical resistance/ support levels.
Resistance: 1.1901, 1.2157
Support: 1.1639, 1.1353, 1.1140
XAUUSD (4-Hour Chart)
The gold started the day with a soft tone and declined to an intraday low of $1753 and was trading at $1775 at the moment of writing, as the American Dollar recovered some ground on Monday but quickly resumed its decline ahead of the US opening as investors keep moving away from it. The financial markets are quieter following two days of wild price action spurred by signs of easing inflation in the United States. The October Consumer Price Index (CPI) rose at an annual pace of 7.7%, much lower than the 8% anticipated by the market or the record peak of 9.1% from last June. Investors rushed to drop the US Dollar amid the mounting speculations that the Federal Reserve will pivot on the monetary policy in their upcoming December meeting. Apart from this, US President Joe Biden met with his Chinese counterpart Xi Jinping. The versions of the outcome differ by country. On the one hand, Biden said that they are not looking for conflict and that there will not be a new Cold War. On the other hand, Chinese media reported that President Xi warned the US about crossing a “red line” in Taiwan.
From the technical perspective, the four-hour scale RSI indicator remained above 70 figured as of writing, suggesting that the gold has preserved its upside strength, but market anticipants needed to be cautious of a corrective pullback. As for the Bollinger Bands, the yellow metal was pricing in the upper area. Therefore, we think an upside movement in the near future could be expected.
US stocks advanced higher on Friday, preserving their upside momentum and extending the rally amid a slowdown in inflation and the upbeat market mood on the last trading day of the week. The risk-on sentiment is mainly supported by the soft inflation data from the US and news of China easing the Covid-related restrictions, as the US Consumer Price Index (CPI) declined to 7.7% yearly in October.
The probability of a 50 basis points Fed rate hike in December jumped above 80% from 50% earlier in the week after the readings came in below market expectations. On top of that, China’s National Health Commission announced that they have decided to reduce the required quarantine times for travellers and people who had close contact with identified Covid cases, supporting the risk-positive market environment. On the Eurozone front, the hawkish stance from European Central Bank (ECB) policymakers acted as a tailwind for the Euro, as ECB member Robert Holtzman said he would vote for a 50 or 75 bps hike at the December meeting.
The benchmarks, S&P 500 and Dow Jones Industrial Average both advanced higher on Friday as the S&P 500 closed near session highs in the biggest weekly gain since June. The S&P 500 was up 0.9% daily and the Dow Jones Industrial Average also advanced slightly with a 0.1% gain for the day. Six out of eleven sectors in the S&P 500 stayed in positive territory as the Energy sector and the Communication Services sector are the best performing among all groups, rising 3.06% and 2.47%, respectively. The Nasdaq 100 meanwhile climbed the most with a 1.8% gain on Friday and the MSCI World index was up 1.9% for the day.
Main Pairs Movement
The US dollar tumbled sharply on Friday, extending its previous slide and dropped to a daily low below 106.5 in the late US trading session as the upbeat market mood continue to dominate financial markets. The expectations for a slowdown in the Federal Reserve (Fed) tightening cycle following the CPI release continued to exert bearish pressure on the greenback, which extended its losses to four consecutive weeks. Investors are beginning to price in a less hawkish Fed and a 50 bps rate hike in December.
GBP/USD advanced higher on Friday with a 0.97% gain after the cable appreciated to fresh multi-month highs above the 1.1850 mark amid upbeat UK data. On the UK front, the UK’s GDP contracted less than expected in Q3 and allowed the pair to extend its sharp two-day rally. Meanwhile, EUR/USD finished the week on a higher note and surged above the 1.0350 mark amid a weaker US dollar across the board. The pair was up almost 1.35% for the day.
Gold climbed higher with a 0.90% gain for the day after refreshing its two-month high and extended its rally towards the $1,770 mark during the late US session, as the release of a soft US Consumer Price Index in October weighed on the US Dollar and provided support for the precious metal. Meanwhile, WTI Oil advanced sharply with a 2.88% gain for the day following China’s easing Covid-19 restrictions.
Technical Analysis
EURUSD (4-Hour Chart)
The EURUSD has extended its rally and climbed to its highest level in three months above 1.0320 as of writing following the impressive gains on Thursday. The safe-haven US Dollar remains in its post-CPI downtrend as risk flows continue to dominate the financial markets ahead of the weekend. After the data from the US showed on Thursday that the annual Consumer Price Index (CPI) declined to 7.7% in October from 8.2% in September, the USD suffered heavy losses against its major rivals. The US Dollar Index dropped 2.3% on Thursday, registering one of the largest one-day losses of 2022. Now, investors continued to scale back 75 basis points (bps) Federal Reserve (Fed) rate hike bets in December on soft inflation report and the benchmark 10-year US Treasury bond yield fell more than 10%. According to the CME FedWatch Tool, markets are currently pricing in an 80% chance of a smaller, 50 bps, rate hike at the last FOMC meeting of the year.
From the technical perspective, the four-hour scale RSI indicator dramatically extended advanced to the overbought zone 75 figured as of writing, suggesting that the pair was surrounded by strong upside traction and investors need to be cautious about any possible pullback soon. As for the Bollinger Bands, the pair was surging along with the upper band and the size between upper and lower bands became larger, signalling the pair amid a strong bullish tendency.
Resistance: 1.0615, 1.0774
Support: 1.0167, 0.9961, 0.9730
GBPUSD (4-Hour Chart)
The GBPUSD has preserved its bullish momentum and advanced toward the 1.1800 level as of writing, with risk flows continuing to impact asset valuations, the pair looks to extend its rally despite having turned overbought in the short term. The data published by the US Bureau of Labor Statistics revealed on Thursday that the Consumer Price Index declined to 7.7% yearly in October from 8.2% in September. Moreover, the Core CPI, which excluded food and volatile energy price, edged lower to 6.3% from 6.6%, coming in below the market expectation of 6.5%. The safe-haven greenback tumbled by more than 2% on Thursday, as investors assessed the soft inflation data as an opportunity to unwind USD longs. Apart from this, the UK’s Office for National Statistics reported that the Gross Domestic Product (GDP) expanded at an annualized rate of 2.4% in the third quarter. This print came in better than the market forecast of 2.1% and helped the Pound Sterling, which has already been benefiting from the improving market mood, gather more strength.
From the technical perspective, the four-hour scale RSI indicator dramatically extended and rallied to 70, the overbought area, figured as of writing. Is suggests that the pair was surrounded by a strong upside tilt and investors need to be careful about the expected pullback soon. As for the Bollinger Bands, the pair was moving upward along with the upper band and the size between the upper and lower bands became larger, signalling the pair amid strong upward momentum.
Resistance: 1.1438, 1.1623
Support: 1.1634, 1.1334, 1.1123
XAUUSD (4-Hour Chart)
Gold continues to push higher and traded above the $1760 mark for the first time in nearly three months on Friday, as investors cheer the soft US inflation report. The Consumer Price Index in the United States rose 7.7% YoY, down from 8.2% in September and clearly below the 8.0% consensus forecast. The CPI accelerated by only 0.4% on the month, down from 0.6% in September and core figures rose 0.3%, rather than the 0.5% expected. The highly anticipated economic release from the United States triggered a massive risk rally on increased expectations of a smaller rate hike by the US Federal Reserve (Fed) in December. Markets now price roughly an 81% probability of a 50 bps December Fed rate hike vs. odds of about 55% at the start of the week. Furthermore, the slump in the US Treasury bond yields and the dovish comments from the Federal Reserve policymakers on Thursday further exacerbated the pain in the greenback. The benchmark 10-year US Treasury bond yields plunged over 30 bps to 3.811%, falling below the psychological 4% level on the US CPI release. The sell-off in the US Treasury yields boded well for the non-interest-bearing Gold price.
From the technical perspective, the four-hour scale RSI indicator remained in the overbought zone of 78 figures as of writing, suggesting that the XAUUSD is amid crazily bullish momentum and investors need to notice any possible pullback. As for the Bollinger Bands, the gold was pricing along with the upper band, which is a signal that the yellow metal in the near-term would persist the positive traction.
The US Federal Reserve will weigh this week’s Retail Sales and PPI data against last week’s lower-than-expected inflation figures as it determines whether to raise its benchmark interest rate by 50bps or 75bps at its December meeting.
Here are the highlights for the week ahead:
RBA Monetary Policy Meeting Minutes (15 November)
The Reserve Bank of Australia (RBA) increased its cash rate to 2.85% at its November meeting, the sixth consecutive increase.
RBA reiterated its commitment to bringing inflation back to target levels and stated that it would do everything in its power to accomplish it. The incoming data will affect the size and timing of rate hikes.
US Empire State Manufacturing Index (15 November)
October’s NY Empire State Manufacturing Index dropped 7.6 points to -9.1, a third consecutive month of negative growth.
Industry experts believe that business conditions will remain the same over the next six months. Meanwhile, this month, data is projected to decrease to -12 points.
US Producer Price Index (15 November)
US PPI for final demand rose 0.4% month-on-month in September 2022, reversing three consecutive months of decline.
Analysts expect that the index will increase by another 0.3% in October.
UK Consumer Price Index (16 November)
In September, the UK’s inflation rate rose to 10.1% from 9.9% in August, returning to 40-year highs seen in July.
According to analysts, they can foresee October’s annual CPI to be higher than 10.4%.
Canada Consumer Price Index (16 November)
According to the latest data, the Consumer Price Index in Canada increased by 0.10% in September 2022 over the previous month.
Further increases are predicted for October.
US Retail Sales (16 November)
In September 2022, retail sales in the US held steady as high inflation and rising borrowing costs dampened consumer demand.
Retail sales are projected to increase by 0.8% in October.
Australia Employment Data (17 November)
Employment in Australia increased by 900 in September to a record high of 13.59 million. The unemployment rate held steady at 3.5%. Analysts expect employment to rise by 32,000 in October.
Analysts predict that employment will rise by 32,000 in October, and the unemployment rate will be 3.4%.
US stocks rebounded sharply on Thursday, regaining upside momentum and surged in a buy-everything relief rally as market participants rushed to price in a pivot in the US Federal Reserve monetary policy as soon as next December.
The US Bureau of Labor Statistics reported on Thursday that inflation in the US, as measured by the Consumer Price Index (CPI), declined to 7.7% on a yearly basis in October from 8% in September. The CPI data came in below the market forecast of 8% and spurred bets the Federal Reserve can downshift its aggressive rate-hike path. Therefore, risk-on flows came back to life and provided strong support to the equity markets. Markets are now pricing in an 80% probability of a 50 basis points rate hike in December following the upbeat US CPI report.
On the Eurozone front, the European Central Bank (ECB) policymakers remained hawkish amid rising recession fears, as they said on Thursday that there is no time for monetary policy to pause and the central bank needs to raise rates into restrictive territory.
The benchmarks, S&P 500 and Dow Jones Industrial Average both surged higher on Thursday as the S&P 500 performed its best first-day reaction to a CPI report since at least 2003 when records began. The S&P 500 was up 5.5% on a daily basis and the Dow Jones Industrial Average also advanced sharply with a 3.7% gain for the day. All eleven sectors in S&P 500 stayed in positive territory as the Information Technology sector and the Real Estate sector are the best performings among all groups, rising 8.33% and 7.74%, respectively. The Nasdaq 100 meanwhile surged the most with a 7.5% gain on Thursday and the MSCI World index was up 4.5% for the day.
Main Pairs Movement
The US dollar suffered heavy losses on Thursday, plummeted lower against all of its major rivals and extended its slide to the 108.00 area during the US trading session amid expectations for the US Federal Reserve to pivot. Optimism returned and the risk-on market mood exerted bearish pressure on the safe-haven greenback as the US Treasury yields shed over 20 bps. Increasing speculations that the Fed might slow the pace of rate hikes were further confirmed by investors’ reactions following the CPI data.
GBP/USD soared sharply on Thursday with a 3.15% gain after the cable touched a two-month high at around 1.1680 level following a cooler-than-expected US inflation report. On the UK front, the UK’s GDP for the third quarter is scheduled to release on Friday, which would shed some light on the status of the British economy. Meanwhile, EUR/USD staged a goodish rebound and surged above the 1.0200 mark amid a weaker US dollar across the board. The pair was up almost 2.00% for the day.
Gold rallied higher with a 2.85% gain for the day after shrugging off the soft tone and surged to a two-week high above the $1,755 mark during the late US session, as the broad-based US Dollar weakness acted as a tailwind for the precious metal. Meanwhile, WTI Oil edged higher with a 0.75% gain for the day amid mixed demand-supply concerns.
Technical Analysis
EURUSD (4-Hour Chart)
The EURUSD has gathered bullish momentum and climbed to its highest level in nearly two months above 1.018 level as of writing on Thursday, as the data from the US inflation data showed better-than-expected figures. Tuesday’s US economic docket highlights the release of the critical US consumer inflation for October. On a monthly basis, the headline CPI rose by 0.4% during the reported month as compared to the market’s expected 0.6%. The yearly rate, however, rose by 7.7% and is expected to ease to 8.0% in October. EURUSD regains upside traction on the back of the collapse in the dollar after US inflation figures advanced less than estimated in October, which the speculations that the Fed will slow down the pace of hiking rates mounted. In the meantime, the greenback fell sharply below the 109.00 support level and traded in levels last seen back in mid-September in the 108.50 bands.
From the technical perspective, the four-hour scale RSI indicator surged to 67 as of writing, suggesting that the pair was surrounded by strong positive traction. As for the Bollinger Bands, the euro was priced above the upper band and the size became larger, which is a signal that the bullish momentum would persist and had the chance to challenge the highest level since mid-September, 1.0198, in the near term.
Resistance: 1.0198
Support: 0.9996, 0.9961, 0.9741
GBPUSD (4-Hour Chart)
GBPUSD surged in the second half of the day on Thursday and reached its highest level since mid-September above 1.16650 following the release of the softer-than-expected, the pair was pricing at 1.16670 level as of writing. The US Bureau of Labor Statistics reported that the headline CPI rose 0.4% in October and the yearly rate eased to 7.7% from 8.2% in September, both missing expectations. Additional details revealed the core inflation, which excluded food and energy prices, decelerated more than anticipated to a 6.3% YoY rate from 6.6% previous. The data adds to the bets that the Federal Reserve will slow the pace of its policy tightening and drags the US Dollar to a fresh multi-week low. This, in turn, is seen as a key factor behind the GBPUSD pair’s sharp rally during the early US trading session. However, a bleak outlook for the UK economy might continue to undermine the British Pound. As a result, the focus now shifts to the Preliminary UK Q3 GDP report, due on Friday. The key UK macro data should provide a fresh directional impetus to the GBPUSD pair.
From the technical perspective, the four-hour scale RSI indicator dramatically rallied to 65 figures as if writing, suggesting that the pair amid strong bullish momentum. As for the Bollinger Bands, the pair was pricing around the upper band and the size between upper and lower bands get larger, indicating that the pair was more favoured to the upside movement in the near future to challenge the highest level since mid-September 1.1738.
Resistance: 1.1438, 1.1623
Support: 1.1146, 1.0953, 1.0797
XAUUSD (4-Hour Chart)
Gold has shrugged off the soft tone seen earlier today to rally $40 higher and reach the mid-range of the $1700s and had been boosted by the broad-based US Dollar weakness following the release of US inflation data. Consumer inflation rose at a slower-than-expected pace in the US, which has set the scene for the US Federal Reserve to ease its aggressive monetary policy path. Tish has spurred risk appetite, hammering the US Dollar and pushing yellow metal higher. US CPI increased by 0.4% in October, unchanged from the previous month, against the market expectations of a 0.6% reading, according to data from the US Bureau of Labor Statistics. Year on year, the CPI cooled down to a 7.7% rate, beyond the consensus of 8%, and after an 8.2% increase in September. As for the core part, the Federal Reserve’s preferred gauge for inflationary trends has eased to 0.3% in October, from 0.6% in September, against expectations of a 0.5% increase. Year on year, the core CPI has retreated to 6.3% from 6.6% in September.
From the technical perspective, the four-hour scale RSI indicator hugely advanced to 78 figures as of writing, suggesting that the XAUUSD has entered into the overbought zone, and a downward correction could be expected. As for the Bollinger Bands, the gold was priced around the upper band and the size between upper and lower got larger, which is a signal that the pair remain strong upside tilt. Therefore, we think the gold would move up to challenge the $1765 mark, then correctively rebound to the $1700 to $1710 area in the near term.
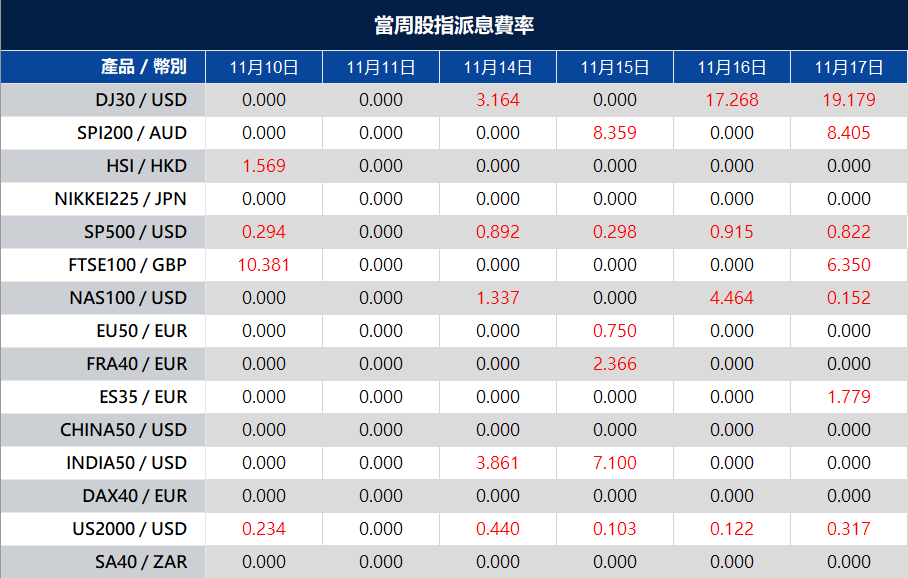
Warmly reminds you that the component stocks in the stock index spot generate dividends. When dividends are distributed, VT Markets will make dividends and deductions for the clients who hold the trading products after the close of the day before the ex-dividend date.
Indices dividends will not be paid/charged as an inclusion along with the swap component. It will be executed separately through a balance statement directly to your trading account, the comment for which will be in the following format “Div & Product Name & Net Volume ”.
Please note the specific adjustments as follows:
The above data is for reference only, please refer to the MT4/MT5 software for specific data.
If you’d like more information, please don’t hesitate to contact [email protected].
US stocks tumbled heavily on Wednesday, failing to preserve their upside traction and witnessing heavy selling pressure as renewed selling in cryptocurrencies and disappointing earnings weighed on risk sentiment ahead of a key US inflation report.
Global equity markets sensed an intense sell-off amid headwinds of the US mid-term elections outcome and upside risks from the inflationary pressures. Investors’ attention now shifts toward the closely watched US inflation report due Thursday after midterm elections failed to deliver a Republican sweep.
The headline US CPI is expected to decline to 8.0% meanwhile providing clues on the path of Federal Reserve policy tightening. on the Eurozone front, the European Central Bank (ECB) has conducted a survey of consumer expectations for inflation, which indicated that Consumers still see inflation at 3% in 3 years and 5.1% over the next 12 months. The higher inflation is hurting the households’ sentiment.
The benchmarks, S&P 500 and Dow Jones Industrial Average both declined lower on Wednesday as the S&P 500 ended its three-day rally and Bitcoin dropped below $16,000 to a level not seen since 2020 amid a deepening selloff in cryptocurrencies. The S&P 500 was down 2.1% daily and the Dow Jones Industrial Average also dropped lower with a 1.9% loss for the day. All eleven sectors in S&P 500 stayed in negative territory as the Energy sector and the Consumer Discretionary sector is the worst performing among all groups, losing 4.88% and 3.12%, respectively. The Nasdaq 100 meanwhile slumped the most with a 2.4% loss on Wednesday and the MSCI World index was down 1.6% for the day.
Main Pairs Movement
The US dollar advanced higher on Wednesday, regaining upside momentum and rebounded firmly to the 110.50 area during the US trading session amid an improvement in safe-haven’s appeal. However, the 10-year US Treasury yields witnessed a steel fall below 4.10% as odds are favouring a rate hike of 50 basis points (bps) by the Federal Reserve (Fed) in its December monetary policy meeting. On Thursday, the US inflation figures will remain in the spotlight.
GBP/USD was sharply down on Wednesday with a 1.61% loss after the cable extended its intra-day slide to the 1.1340 mark amid the market’s anxiety ahead of the US inflation report. On the UK front, Prime Minister (PM) Rishi Sunak will become the first British prime minister in 15 years to attend the British-Irish Council summit on Thursday. Meanwhile, EUR/USD remained under pressure and retreated towards the 1.0000 mark amid a stronger US dollar across the board. The pair was down almost 0.63% for the day.
Gold dropped with a 0.33% loss for the day after surrendering its entire Wednesday’s gains near the $1,714 mark with the risk sentiment turning sour heading to the close, as the recovering US dollar undermined the precious metal. Meanwhile, WTI Oil was sharply down with a 3.46% loss for the day amid rising odds for the higher peak of the Federal Reserve (Fed)’s terminal rate.
Technical Analysis
EURUSD (4-Hour Chart)
The EURUSD remains on the back foot and trades below 1.0050 in the early American session, as the US Dollar benefits from safe-haven flows mid-week with investors awaiting the outcome of the US Midterm Elections. The results of the midterm elections, which are yet to be completed, are showing Democrats doing better than anticipated, taking one more seat in the Senate, lost by the GOP. However, the ruling party lost two seats in the House, securing so far 172 vs 199 for the opposition. On the other hand, the stock market edged lower and struggled for a clear direction. Most European indexes trade in red, although losses are limited. Meanwhile, Wall Street is set to open little changed from Tuesday’s closing levels. Apart from this, investors were keeping their eyes on the US Consumer Price Index to be out on Thursday. Inflation is expected to have risen at an annual pace of 8% in October, easing from 8.2% in the previous month.
From the technical perspective, the four-hour scale RSI indicator edged lower to 61 figured as of writing, suggesting that the positive traction has turned weaker. As for the Bollinger Bands, the pair was pricing in the upper area and found support near the 20-period moving average with a smaller size between upper and lower bands, signalling that the price has not found a clear direction and tends to put into sideway in the near-term.
Resistance: 1.0095, 1.0198
Support: 0.9996, 0.9852, 0.9730
GBPUSD (4-Hour Chart)
The GBPUSD extended its losses and dropped to a fresh daily low below 1.1400 in the second half of the day on Wednesday. The risk-averse market environment provides a boost to the safe-haven US dollar as investors await the outcome of the US Midterm Elections. Investors seem to be staying on the sidelines while awaiting the outcome of the US Midterm Elections. The latest news has shown better-than-expected results for the Democrats as the “red wave” announced by the media has not crystallized, and according to Associated Press, Democrats and Republicans have 46 and 47 Senate seats, respectively, with 5 seats remaining out of 35 called up for election. The final results, however, might still take some time, and key issues like the control of Congress and Biden’s next year agenda are still uncertain. Apart from this, the Consumer Price Index data, due on Thursday, might provide further insight into the size of the Federal Reserve’s next interest rate hike. Any surprise in these readings might boost Dollar volatility.
From the technical perspective, the four-hour scale RSI indicator slid to 44 figures as of writing, suggesting that the pair was surrounded by bearish transactions. As for the Bollinger Bands, the pounds were priced below the 20-moving average and the size between upper and lower bands get smaller, which is a signal that the pair was more favoured to the downside path.
Resistance: 1.1438, 1.1623
Support: 1.1146, 1.0953, 1.0797
XAUUSD (4-Hour Chart)
Gold edged lower for the day and was trying to stabilise above the $1710 mark as of writing, as the American Dollar regather strength during the US trading session as investors turn cautious amid growing worries about a deeper global economic downturn and uncertainty over the release of US Consumer Price Index and the outcome of the US Midterm Election. The US Dollar attracts some buying and moves away from its lowest level since September 20 touched the previous day, which, in turn, is seen as a key factor weighing on the dollar-denominated gold. Despite rising bets for a less aggressive policy tightening by the Fed, the markets are still pricing in the possibility of at least a 50 bps rate hike in December. This remains supportive of the elevated US Treasury bond yield and offers some support for the greenback. That said, the cautious market mood underpinned the safe-haven gold and might limit further losses, at least for the time being.
From the technical perspective, the four-hour scale RSI indicator slightly fell back to 64 figured, suggesting that the strong bullish momentum has been softer. As for the Bollinger Bands, the yellow metal was pricing between the upper band and 20-period moving average and put into sideway, which is a signal that the upside tendency is mild and weak. Therefore, if there are any surprising events, the direction would easily change downwardly.
New contracts will automatically be rolled over as follows:
Please note:
• The rollover will be automatic, and any existing open positions will remain open.
• Positions that are open on the expiration date will be adjusted via a rollover charge or credit to reflect the price difference between the expiring and new contracts.
• To avoid CFD rollovers, clients can choose to close any open CFD positions prior to the expiration date.
• Please ensure that all take-profit and stop-loss settings are adjusted before the rollover occurs.
• All internal transfers for accounts under the same name will be prohibited during the first and last 30 minutes of the trading hours on the rollover dates
If you’d like more information, please don’t hesitate to contact [email protected].
US stocks advanced higher on Tuesday, extending their previous rally and rose for the third day as investors awaited midterm election results and monitored the selloff in crypto markets.
Bitcoin plummeted to a fresh 2022 low at $18,355 amid the collapse of FTX and Binance’s decision to save the crypto exchange. The mini-crash in Bitcoin has weighed on the stock market and caused a sharp drop as investors don’t like to see any disruptions in any risk asset.
On top of that, the results of the US mid-term elections would take a couple of days, which could have long-lasting effects on the American dollar. A history of robust performance following midterm results has provided support to the outlook for equity markets.
In the Eurozone, the euro cheers the upbeat Eurozone data despite some discouraging news, as the European Commission said there is no way to create a gas price cap as requested by EU leaders at the end of October. Eurozone’s Retail Sales rose by 0.4% MoM in September.
The benchmarks, S&P 500 and Dow Jones Industrial Average both climbed higher on Tuesday as the S&P 500 closed higher with investors eyeing potential gridlock from midterm election results ahead of the release of US inflation figures. The S&P 500 was up 0.6% daily and the Dow Jones Industrial Average also advanced higher with a 1.0% gain for the day.
Ten out of eleven sectors in the S&P 500 stayed in positive territory as the Materials and Information Technology sectors are the best performing among all groups, rising 1.68% and 0.92%, respectively. The Nasdaq 100 meanwhile climbed higher with a 0.8% gain on Tuesday and the MSCI World index was up 0.8% for the day.
Main Pairs Movement
The US dollar declined lower on Tuesday, remaining under bearish pressure and plummeted to fresh monthly lows against most of its major rivals during the US trading session as the markets await the outcome of the US mid-term elections. The positive tone of US equities and easing government bond yields both exerted bearish pressure on the greenback amid the optimism surrounding US Mid-Term Elections. The important election results would take a couple of days.
GBP/USD edged higher on Tuesday with a 0.26% gain after the cable retreated from a daily high and dropped to the 1.1520 area amid risk-on market sentiment. On the UK front, Bank of England Chief Economist Huw Pill said the central bank has more to do with tightening the monetary policy. Meanwhile, EUR/USD holds on to its gains ahead of the US close and climbed above the 1.0070 mark amid the market’s optimism surrounding the US election outcome. The pair was up almost 0.54% for the day.
Gold surged with a 2.20% gain for the day after reaching levels that were last seen in September around the $1,714 mark during the late US trading session, as the weaker US dollar across the board helped the precious metal to find demand. Meanwhile, WTI Oil was sharply down with a 3.14% loss for the day amid concerns over China’s oil demand. Crude oil prices have retreated to the $88.50 area.
Technical Analysis
EURUSD (4-Hour Chart)
The EURUSD managed to climb back to the level above the 1.0000 threshold as the US dollar fell below the 110 level, which is the first time in the last two weeks, during the US trading session. The outcome of the US mid-term elections could have long-lasting effects on the American dollar, particularly if Democrats are not able to retain control of both houses. Republicans do not need much to seize control of Congress. If that’s the case, they may oppose President Joe Biden’s massive expenses, which would exacerbate the risk of an economic downturn. Equities will likely collapse, but it does not seem the dollar could benefit much from it.
In Eurozone, France’s trade deficit widened to € 17.49B in September and Retail Sales in Italy expanded 0.5% MoM in the same month. Meanwhile, price action around the European currency is expected to closely follow dollar dynamics, geopolitical concerns and the Fed-ECB divergence. The recent decision by the Fed to hike rates and the likelihood of a tighter-for-longer stance now emerges as the main headwind for a sustainable recovery in the pair.
From the technical perspective, the four-hour scale RSI indicator continued to advance to around 68 figured closed to 70, overbuy zone, which suggests that the pair was amid strong bullish momentum. As for the Bollinger Bands, the European currency remained firmly above the 20-period moving average, which is a signal that the pair was surrounded by an upside tendency.
Resistance: 1.0000, 1.0094
Support: 0.9813, 0.9730, 0.9636
GBPUSD (4-Hour Chart)
The GBPUSD successfully rebounded to a level above 1.5500 as the US dollar struggles to find demand as a haven on Tuesday as risk flows continue to dominate the financial markets, providing a boost to the pair. The pounds were priced at 1.1576 level as of writing. The greenback has dropped across the board in the US trading session, and US stocks advance with all eyes on the outcome of the US mid-term elections. A hitherto rangebound market has led to a significative US dollar pullback as the first surveys started hinting at a Republican victory. The scenario might create a gridlock in the US Congress that would be welcomed by the market as it will hinder the approval of new regulations. Nevertheless, it’s worth noting that the outcome of the US midterm election is likely to be unveiled later in the week, opening the door for choppy market action in the short term.
From the technical perspective, the four-hour scale RSI indicator edged lower to 58 figures as of writing, suggesting that the pair’s positive traction slowdown. As for the Bollinger Bands, the pair kept pricing above the 20-period moving average but was capped by the upper band two times in a row, signalling that the upside momentum is softer. Hence, unless there is a surprising CPI figure, the pound was more favoured to the downside path in the near term.
Resistance: 1.1645, 1.1732, 1.1878
Support: 1.1439, 1.1159, 1.0955
XAUUSD (4-Hour Chart)
Gold surged to above the $1710 mark and aimed for October’s monthly high of $1729.87, with XAUUSD pricing at $1715 marks as of writing. The midterm elections in the United States increased risk appetite and triggered a sharp decline in US Treasury yields during US trading hours, which, in turn, caused a USD sell-off. The US Dollar index (DXY) tumbled by 0.72% for the day and fell to below 109.5 level, which is the first time since 27th October. Investors are likely to refrain from betting on an extended risk rally while awaiting the outcome of the United States (US) midterm elections. If Republicans take the majority in the House and the Senate, additional gains in the US stocks could be witnessed. However, a split Congress could force market participants to adopt a cautious stance amid heightened uncertainty surrounding the fiscal policy. Meanwhile, the expectations for the Federal Reserve’s December meeting remain tilted towards hiking 50 bps, as shown by the CME FedWatch Tool at 52%. The speculations for a 75 bps increase are 48%, unchanged from a day ago.
From the technical perspective, the four-hour scale RSI indicator surged to 74 figures as of writing, which has entered into the overbought zone, suggesting that some selling transactions could be expected. As for the Bollinger Bands, the gold was priced around the upper band and the size of the upper and lower bands became larger, signalling the yellow metal was still surrounded by strong positive traction. Therefore, we think the price would wander around the $1710 area to consume some selling pressure and then move up to challenge the $1725 mark in the near term.