Denmark’s parliamentary election resulted in a fragmented Folketing, with 12 parties winning seats. Neither the red bloc nor the blue bloc secured a majority.
The Moderates, led by Lars Løkke Rasmussen, hold the balance of power. Coalition talks may be complex and could delay the formation of a new government.
Government Formation Timeline
Government formation in Denmark is normally completed within two to three weeks. After the 2022 election, it took a record 42 days to form a cross-centre government.
Until a new government is agreed, the existing administration will remain in office as a caretaker ministry. In this period, it handles only necessary, non-political decisions.
The article was produced using an Artificial Intelligence tool and reviewed by an editor.
The fragmented result of the Danish parliamentary election late last year means we are now facing a period of political uncertainty. For derivative traders, this prolonged instability creates opportunities in volatility. We should anticipate that forming a new government could take well over a month, similar to the record 42 days it took back in 2022.
Volatility And Trading Implications
This situation suggests a likely increase in implied volatility on Danish assets. Options on the OMXC25 index, Denmark’s main stock market benchmark, could be valuable as the market has been flat, down just 0.8% since the start of March 2026, awaiting a clear political direction. Buying straddles could be a prudent strategy to profit from a significant price move in either direction once a government is finally announced.
In the currency market, while the Danish krone is pegged to the euro, the political tension can affect the cost of derivatives used to hedge the currency. The one-month forward points on the EUR/DKK pair have already ticked up slightly, reflecting a small but growing demand to hedge against any unforeseen stress. This is a subtle signal that the market is pricing in a small amount of risk related to the difficult government negotiations.
We can also look at the Danish government bond market for signals. The spread between 10-year Danish government bonds and their German counterparts has widened by a few basis points in the past two weeks, a classic reaction to domestic political uncertainty. Traders can use futures to speculate on this spread widening further if negotiations drag on into late April, as any delay in forming a government postpones clarity on future fiscal policy.
Create your live VT Markets account and start trading now.
Start trading now – Click here to create your real VT Markets account
Written on March 26, 2026 at 12:58 am, by josephine
Meta Platforms shares are trading near $601. If the rally continues, the next level cited is $615.77, where a price gap, an upward trendline, and a prior support area meet and may act as resistance.
This area around $615.77 is presented as a place to watch for a possible reversal if the price rises from current levels. The setup is described as higher risk because the daily relative strength index (RSI) is low and close to oversold.
Rsi Oversold Bounce Setup
A low RSI is linked with heavy recent selling and the potential for a stronger rebound. On that basis, the next resistance level mentioned is about $637, linked to another gap fill.
If buying pressure remains strong, the price could move past $615.77 and head towards $637 before meeting resistance. The stated range between $615.77 and $637 is $21.23.
With META holding the $601 level, we are watching the first resistance zone around $615.77. This area is significant as it aligns with a gap fill and a previous support trendline. Given the broader market just bounced, with the NASDAQ 100 finding support at its 50-day moving average last week, a relief rally in tech seems plausible.
However, we believe trying to short the stock at this first level is a risky strategy for derivative traders. The relative strength index (RSI) is sitting just above 30, indicating the stock is nearly oversold and selling pressure may be exhausted. For those looking to play a bounce, buying April call options could capture a potentially sharp, fast move upward if buyers step in.
Options Positioning Signals
Recent options market data shows implied volatility has risen to 38%, signaling an expectation of a larger than usual price swing in the coming weeks. We have also seen a notable increase in open interest for the April 17th expiration, particularly at the $630 and $635 strike prices. This suggests that some market participants are positioning for a move that breaks cleanly through that initial $615.77 resistance.
This leads us to the more important resistance level near $637, which corresponds to the next gap fill. This is reminiscent of the setup we saw in the fall of 2025, when an oversold bounce drove the stock 11% higher in under two weeks, blowing past the first minor resistance area. If the oversold condition fuels a stronger rally, $637 becomes the more logical price target to either take profit on bullish trades or to consider initiating new bearish positions with puts.
Create your live VT Markets account and start trading now.
Start trading now – Click here to create your real VT Markets account
Written on March 25, 2026 at 10:59 pm, by josephine
WTI traded near $88.20 on Wednesday, up 0.40% on the day, as it tried to steady after a recent pullback. Prices remained in a consolidation phase amid easing geopolitical tensions and ongoing supply risks.
Reports said the US proposed a multi-point plan for a temporary truce with Iran to support broader talks. Iranian officials indicated there was no firm breakthrough and that discussions were indirect.
Iran Strait Of Hormuz Update
Iran said “non-hostile” vessels could continue to pass through the Strait of Hormuz if they co-ordinate with its authorities. The area remained unstable, with ongoing military activity involving several regional actors.
Saudi Arabia increased exports via its Red Sea port of Yanbu to reduce reliance on routes tied to the Strait of Hormuz. This move aimed to limit the impact of possible disruption in the strait.
The US EIA reported a crude stock build of 6.926M barrels last week, versus expectations for 0.5M. The rise in inventories suggested weaker near-term demand and added downward pressure on prices.
TD Securities reported reduced flows through the Strait of Hormuz and a decline in floating storage capacity. Market attention stayed on US–Iran contacts and weekly US inventory data.
Trading Strategy Considerations
With West Texas Intermediate consolidating around the $88 mark, we are in a period of high uncertainty, making directional bets risky. The tension between potential diplomatic easing with Iran and the very real risks to supply through the Strait of Hormuz suggests the market is coiled for a significant move. This environment suggests strategies that can profit from a sharp breakout, regardless of the direction.
The large and unexpected build in US crude inventories of nearly 7 million barrels is a significant bearish flag for short-term demand. This isn’t an isolated event; it follows a pattern of rising US stockpiles that we observed through the final quarter of 2025, which has kept a lid on prices. Should the proposed truce with Iran show any real progress, the risk premium currently baked into the price could vanish, potentially sending oil back toward the low $80s.
However, the physical market remains structurally tight, and we must not discount the risk of a supply-driven shock. We only have to look back to the Red Sea disruptions in late 2023 to see how quickly freight rates and oil prices can spike on transit fears, even with otherwise balanced fundamentals. A single hostile incident in the Strait of Hormuz could easily overwhelm bearish inventory data and push prices toward $95 a barrel.
Given these opposing forces, derivative traders should look at volatility plays. The high implied volatility, with the OVX index holding above 35 for most of this quarter, makes options expensive but reflects the genuine risk of a breakout. Buying a straddle or a strangle allows a trader to profit from a large price swing in either direction over the next few weeks, which seems more likely than a continued stalemate.
For those with a directional bias but wanting to limit risk, vertical spreads are a prudent choice. A bull call spread could capture upside from a supply disruption, while a bear put spread would profit from a diplomatic breakthrough and weakening demand. These defined-risk strategies are sensible while we await a clearer catalyst, whether from the next EIA report or headlines out of Washington and Tehran.
Create your live VT Markets account and start trading now.
Start trading now – Click here to create your real VT Markets account
Written on March 25, 2026 at 10:59 pm, by josephine
Gold (XAU/USD) rose on Wednesday after hitting four-month lows earlier in the week, with buyers returning after a sharp fall. It traded near $4,566, up almost 2% on the day, posting a second daily gain after nine straight sessions of declines.
Prices firmed as talk of diplomatic steps in the US-Iran conflict helped cool Oil from recent highs, easing near-term inflation worries. Israel’s Channel 12 reported a US proposal for a one-month ceasefire and a 15-point plan tied to limits on Iran’s nuclear programme and keeping the Strait of Hormuz open, in exchange for sanctions relief.
Diplomatic Signals And Market Reaction
Iran rejected the framing of the plan, according to Press TV, saying any end to the conflict would be on Iran’s terms. Conditions listed included a halt to attacks and assassinations, guarantees against renewed war, compensation for damage, an end to fighting across regional fronts, and recognition of control over the Strait of Hormuz.
WTI traded around $88.00 after dropping from near $100 earlier this week, though it stayed above pre-conflict levels. A firm US Dollar and high Treasury yields continued to weigh on Gold.
Technically, Gold bounced from the 200-day SMA and neared resistance at the 100-day SMA. RSI rose from below 30 to about 37, while MACD remained below the signal and zero lines; levels to watch include $4,619, $4,968, $5,000, $4,306, and $4,107.
Given the rebound in gold is tied to fragile diplomatic hopes, we see high implied volatility as the key theme for the coming weeks. This uncertainty makes options strategies particularly useful for defining risk around the shifting US-Iran headlines. The sharp bounce from four-month lows suggests dip-buyers are present, but conviction is weak.
Options Strategies For A Binary Outcome
For those anticipating a successful ceasefire and a continued drop in oil prices, buying call options on gold futures looks attractive. A break above the 100-day moving average near $4,619 could be a trigger for this trade. We could structure this as a bull call spread to cap costs, targeting a move toward the $4,900-$5,000 resistance area.
However, if we believe Iran’s tough stance will prevail and the conflict will escalate, the headwinds from a strong dollar and elevated Treasury yields will return. In this scenario, buying put options with strike prices below Tuesday’s low of $4,306 would be a direct way to position for a retest of the 200-day average. The technical indicators still favor sellers on a broader basis, supporting this cautious view.
Considering the binary nature of the geopolitical outcome, a long strangle or straddle could be the most prudent strategy. This involves buying both a call and a put option, profiting from a significant price move in either direction once the diplomatic uncertainty resolves. The elevated CBOE Gold Volatility Index (GVZ), currently hovering around 19.8 after spiking to over 24 last week, confirms that the market is pricing in a major move.
This tense environment is complicated by recent inflation data that complicates central bank decisions. The US CPI for February 2026 came in hotter than expected at 3.4%, reminding us that underlying price pressures persist even with oil pulling back from its highs. This sticky inflation makes it less likely the Federal Reserve will signal rate cuts, which could cap gold’s upside.
Looking back, this situation feels similar to the geopolitical flare-up in late 2025, which sent WTI crude above $110 and caused a sharp but temporary dip in equities. During that period, gold eventually rallied as a safe haven once the initial shock passed. The market’s memory of that event may be encouraging some to buy this dip, but we must remember that the Fed’s stance was more accommodative back then.
Create your live VT Markets account and start trading now.
Start trading now – Click here to create your real VT Markets account
Written on March 25, 2026 at 10:58 pm, by josephine
TD Securities strategists say the Federal Reserve is facing conflicting signals as the Iran conflict triggers an oil shock. They describe the US economy as mixed, with the Fed’s dual mandate still in tension at the start of 2026.
They expect the Fed to keep rates on hold in the near term, with a Committee that could lean hawkish by keeping financial conditions tighter. They also expect rate cuts later in 2026 if conditions allow.
Energy Shock And Inflation Expectations
They say Fed leaders may treat the energy shock as temporary if long-run inflation expectations stay stable. They add that second-round effects on core inflation would need to remain largely contained.
They compare the current backdrop with 2022, saying monetary and fiscal policy are not overly loose. They also say the labour market is no longer extremely tight, there is no excess-savings-driven pent-up demand, and global supply chains are under less stress.
They note the Middle East situation remains fluid and that several paths could change the outlook, leading to either a more hawkish stance or faster easing. They add that a resilient US economy gives the Fed room to wait.
The Federal Reserve is in a tough spot as the conflict in Iran pushes WTI crude oil prices past $115 a barrel, causing a significant shock. This recent surge lifted the last headline CPI reading to 4.1%, creating pressure to act. We believe the Fed will look through this, however, as core inflation remains more contained at 3.2%, allowing them to remain in a holding pattern.
Trading Implications For Rates
This patient stance is possible because the underlying economy is much softer than in prior years. February’s jobs report showed a weaker-than-expected gain of only 150,000, and the unemployment rate has ticked up to 4.2%. This gives the central bank space to wait and assess the downside risks to growth before reacting to the energy price spike.
Looking back from our current perspective, the economy is in a starkly different place than it was during the 2022 inflation episode. The period of disinflation through 2025 left the economy without the overheating labor market or excess consumer demand that forced the Fed into aggressive action back then. This history gives them the flexibility to not overreact to the current oil shock.
Given the high degree of uncertainty, traders should consider strategies that benefit from volatility itself. With the geopolitical situation remaining so unpredictable, options plays that profit from a large price swing in either direction are more sensible than betting on a specific outcome. The MOVE index, a measure of bond market volatility, is reflecting this tension as it hovers near its yearly highs.
For rates traders, the most compelling position may be to anticipate a steeper yield curve over the medium term. The Fed’s plan to hold rates steady now while still aiming for cuts later in 2026 should keep short-term rates anchored. This makes trades that profit from the widening gap between two-year and ten-year yields an attractive way to position for the eventual policy shift.
Create your live VT Markets account and start trading now.
Start trading now – Click here to create your real VT Markets account
Written on March 25, 2026 at 10:58 pm, by josephine
USDX edges lower to 99.576, after a strong prior session.
Fed funds futures show a 64.4% probability of no rate change by December.
Markets remain headline-driven amid Middle East uncertainty.
The U.S. dollar eased slightly in Asian trading, with the USDX dipping 0.1% to 99.576, after posting its strongest daily gain in a week.
The pullback reflects a shift in expectations around Federal Reserve policy, as traders reduce bets on further tightening. Markets are now pricing a 64.4% probability that the Fed will remain on hold in December, up from 60.2% just a day earlier.
Federal Reserve Chair nominee Kevin Warsh wants to significantly shrink the US central bank’s $6.6 trillion balance sheet. He’ll probably need more than one term to do it, according to a top financial economist. https://t.co/NhPebH0O22
This adjustment highlights how quickly sentiment is shifting as inflation expectations are reassessed in light of recent developments.
The dollar may consolidate near current levels as markets wait for clearer policy direction.
‘Strait Talk’ Keeps Markets on Edge
The broader market tone remains cautious, with traders closely watching developments in the Middle East.
Iran signalled it is reviewing a U.S. proposal to end the conflict, but also stated it has no intention to engage in direct talks, leaving uncertainty elevated.
Iran said it rejected a US ceasefire proposal and issued its own conditions for the end of the war. https://t.co/R0GbkXsxil
Markets are reacting to each headline, with analysts describing conditions as “decisively headline-driven”. Traders are trying to determine whether recent signals point to de-escalation or a prolonged conflict.
Iran's grip on the Strait of Hormuz shows that chokepoints in geography, trade and technology can shift the global balance of power, @halbrands writes (via @opinion) https://t.co/pXLsWYkNZ0
This uncertainty is limiting directional conviction across currencies and equities.
Continued mixed signals may keep volatility elevated and prevent strong trend formation.
Oil Prices and Inflation Expectations Drive Policy Outlook
The earlier closure of the Strait of Hormuz pushed energy prices higher, forcing markets to reconsider inflation risks.
The Iranian parliament is working on a draft bill to charge a fee in exchange for providing security to ships passing through the Strait of Hormuz, according to the semi-official Fars news agency https://t.co/BlnzJSFiLi
However, as oil prices stabilise, traders are beginning to question whether the inflation shock will persist long enough to justify tighter monetary policy.
There is a growing view that central banks, including the Fed, may choose to look through the energy-driven inflation spike rather than react aggressively.
This shift has reduced expectations for rate hikes and is now influencing currency positioning.
Diverging Central Bank Signals Create Currency Tension
Currency markets are increasingly driven by diverging central bank expectations.
The euro edged up 0.1% to $1.1570, supported by comments from the European Central Bank suggesting rate hikes remain possible if inflation persists.
At the same time, the dollar slipped 0.1% to 159.39 against the yen, even as it trades near its strongest levels since 2024.
In Japan, rising bond yields and expectations of policy tightening are adding complexity. Markets are pricing a 61.9% probability of a rate hike to 1% at the Bank of Japan’s April 28 meeting.
This creates a potential shift in relative rate dynamics, particularly if the Fed remains on hold while other central banks lean toward tightening.
Currency pairs may remain range-bound as policy divergence becomes the main driver.
Technical Analysis
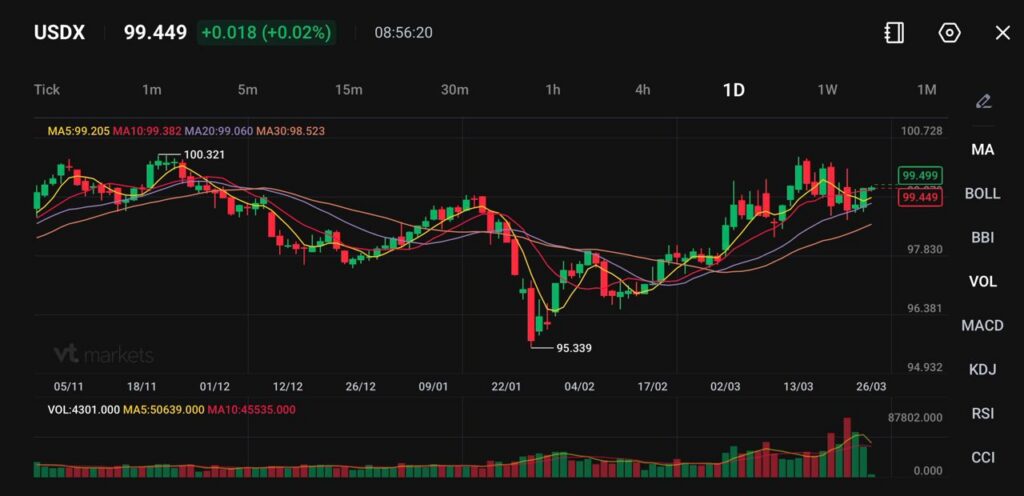
US Dollar Index (USDX) is trading near 99.45, marginally higher on the session, as the dollar continues to consolidate just below the 100 level. Price action reflects a pause after the recent recovery from the 95.33 low, with momentum flattening in the near term.
Technically, the structure remains constructive but indecisive. The 5-day MA (99.20) and 10-day MA (99.38) are tightly clustered around current price, indicating a lack of strong directional bias. Meanwhile, the 20-day (99.06) and 30-day (98.52) continue to slope upward, suggesting the broader recovery trend is still intact.
Key levels to watch:
Support:99.00 → 98.50 → 97.80
Resistance:100.30 → 100.70 → 101.00
The index is currently trading within a tight range between 99.00 and 100.30, with repeated rejection near the 100.30 resistance zone. This level remains a key barrier, and a breakout above it would likely signal renewed bullish momentum toward 100.70 and beyond.
On the downside, 99.00 is acting as immediate support. A break below this level could lead to a pullback toward 98.50, where the 20-day average provides additional support.
Volume has tapered slightly, reinforcing the view that the market is in a consolidation phase rather than trending.
Overall, USDX appears to be coiling below major resistance, with the broader bias still mildly bullish. A decisive move above 100.30 or below 99.00 will likely determine the next directional leg, particularly as the dollar reacts to evolving rate expectations and macro developments.
What Traders Should Watch Next
Markets remain highly reactive to both macro and geopolitical signals. Key drivers include:
Developments in Middle East negotiations.
Oil price direction and supply conditions.
Federal Reserve policy signals and inflation data.
Divergence between global central banks.
For now, the dollar is holding firm but lacks strong momentum, with traders waiting for clearer signals before committing to the next directional move.
The Euro fell against the US Dollar on Wednesday, as demand for the safe-haven Greenback stayed firm amid mixed reports on US-Iran ceasefire efforts. EUR/USD traded near 1.1585, down about 0.20%, while the US Dollar Index (DXY) was 99.40 after an intraday low of 99.07.
US-Iran messaging remained uneven, with Iran-linked Press TV reporting Tehran would end the conflict only on its own terms. Iran’s stated conditions included stopping attacks and assassinations, guarantees the war will not restart, payment for war damages, an end to fighting across regional fronts, and recognition of its control over the Strait of Hormuz.
Ceasefire Talks And Market Reaction
The United States was reported to have offered a 15-point plan that includes a one-month ceasefire to begin talks. The plan is said to include limits on Iran’s nuclear programme and assurances to keep the Strait of Hormuz open, in return for possible sanctions relief.
Markets have fully priced in two European Central Bank rate hikes, while expectations for Federal Reserve rate cuts this year have mostly been removed. Pricing increasingly points to the Fed holding rates through 2026.
A Reuters poll published on Wednesday said 60 economists were surveyed, with 38 expecting the ECB deposit rate to stay at 2.00% this year. The poll also found 21 now expect at least one ECB rate rise in 2026.
The ongoing conflict between the US and Iran is supporting the US Dollar as a safe-haven asset, putting pressure on the EUR/USD pair. With the Dollar Index (DXY) holding firm above 99.00, we believe the path of least resistance for the Euro is down in the immediate term. This geopolitical tension is the main driver in the market right now.
Volatility Signals And Trading Positioning
This uncertainty is causing expected price swings to increase, which is visible in the derivatives market. One-month implied volatility on EUR/USD options has climbed to 11.5%, a level we have not seen since the banking sector instability we experienced back in early 2025. Traders should consider strategies that benefit from this heightened volatility, rather than just picking a direction.
The conflict’s effect on energy is keeping inflation concerns front and center, with Brent crude oil now trading over $115 per barrel, well above the 2025 average of around $85. This is complicating the outlook for central banks, as the latest February inflation data showed prices rising at 4.8% in the Eurozone and 4.5% in the US. The European Central Bank, in particular, is watching to see if these high energy costs bleed into the wider economy.
We see a growing difference in how markets expect the Federal Reserve and the ECB to act. The market has now completely removed the possibility of Fed rate cuts for this year, while it is pricing in two rate hikes from the ECB. This view is more aggressive than that of economists, many of whom believe the ECB will keep its deposit rate at the current 2.00% through the end of the year.
In response, the options market is showing a strong preference for protecting against a fall in the EUR/USD. The premium for put options, which protect against a price drop, has risen sharply compared to call options. This suggests many traders are positioning for the pair to test lower levels, possibly around the 1.1400 mark in the coming weeks.
However, any sudden diplomatic progress or ceasefire agreement would likely cause a sharp reversal of this trend. Such a de-escalation would weaken the dollar’s safe-haven appeal and could send the EUR/USD higher very quickly. Therefore, holding some long-dated, out-of-the-money call options could be a sensible hedge against an unexpected peaceful resolution.
Create your live VT Markets account and start trading now.
Start trading now – Click here to create your real VT Markets account
Written on March 25, 2026 at 9:59 pm, by josephine
Global risk mood has improved as markets position for a possible resolution to conflict involving Iran. Global stocks and bonds are rising, Brent crude is near $100 a barrel, and DXY is consolidating below 100.00.
Iran’s response to a US de-escalation shift is presented as a factor in whether market fear has peaked. Until the situation becomes clearer, the US dollar is described as having upside risk because funding demand can rise during market stress.
Near Term Dollar Outlook
BBH is described as neutral on the dollar in the near cycle. It expects DXY to stay within a 96.00–100.00 range, linked to interest rate gaps between the US and other major economies.
Over the longer term, BBH maintains a bearish view on the dollar. The reasons listed are lower confidence in US trade and security policy, weaker perceptions of US fiscal credibility, and the politicisation of the Federal Reserve.
We are seeing improved global risk sentiment as markets price in a resolution to the Iran tensions that flared up late in 2025. With the Dollar Index (DXY) consolidating around 98.50, traders are showing more confidence. This is reflected in the S&P 500 recovering nearly 5% this quarter.
Despite the calm, we see risks skewed towards a stronger dollar in the near term if financial stress returns. History, like the market shocks we saw back in 2022, shows a flight to dollar safety is rapid and unforgiving. Therefore, holding some cheap, out-of-the-money call options on the dollar for the next 30-60 days could be a prudent hedge against a sudden flare-up.
Range Trading Strategies
Cyclically, we expect the DXY to remain anchored within a 96.00-100.00 range for the coming months. With US CPI data from February holding at a stubborn 2.8%, the Fed is unlikely to cut rates aggressively ahead of the European Central Bank, keeping rate differentials stable. This makes strategies like selling iron condors on currency futures attractive, as they profit from low volatility.
Structurally, our view remains bearish on the dollar due to fading confidence in US policy and worsening fiscal credibility. The Congressional Budget Office’s projections from January showed the debt-to-GDP ratio on a path to exceed 120% by the end of the decade, weighing on long-term sentiment. Traders with a horizon beyond one year might consider gradually building positions in long-dated DXY put options.
Create your live VT Markets account and start trading now.
Start trading now – Click here to create your real VT Markets account
Written on March 25, 2026 at 9:59 pm, by josephine
USD/CAD has been moving higher as US Dollar momentum lifts the pair and the Canadian Dollar drifts lower. Scotiabank’s fair value estimate has edged up due to lower oil prices and weaker terms of trade.
The bank describes a valuation gap that is well above one standard deviation. It says there has been little new information, and the Canadian Dollar may not get near-term relief.
Valuation Gap And Key Technical Levels
The pair’s move above the mid-1.37 area increases the risk of an overshoot towards 1.3800/10. It is uncertain whether the low 1.38 area will limit further gains.
Resistance is clustered around the 200-day moving average at 1.3804 and the 50-week moving average at 1.3803. Further resistance is noted at 1.3930.
Support is placed at 1.3650/75. The article states it was produced with the help of an AI tool and reviewed by an editor.
We are recalling the situation back in 2025 when the USD/CAD was pushing above 1.37, creating a significant valuation gap. At that time, we identified the 1.38 zone as a major resistance area with overshoot potential. This perspective was driven by weak oil prices and unfavorable terms of trade for Canada.
Options Positioning And Risk Management
As anticipated, the pair did test the high 1.38s in late 2025 before sellers stepped in, confirming that zone as a strong long-term ceiling. Now, with WTI crude prices averaging over $80 in the first quarter of 2026, a significant improvement from last year, the fundamental picture has shifted. Canada’s terms of trade have improved accordingly, narrowing that previous valuation gap.
Given the current momentum, derivative traders should consider selling into any strength toward the 1.3650-1.3675 area, which was the old support level back in 2025 and now acts as resistance. With Canada’s latest inflation figures coming in firm at 2.9%, the Bank of Canada may maintain a hawkish stance, limiting significant upside for the pair. Using call credit spreads with a short strike above 1.37 could be an effective way to capitalize on a range-bound to lower outlook.
We should remain cautious, as strong US economic data could still spark temporary USD rallies. Therefore, buying cheap, out-of-the-money put options on USD/CAD could serve as a good hedge against any unexpected downturn in oil prices or a surprisingly dovish turn from the Bank of Canada. The key is to view rallies as opportunities to position for a stronger CAD, rather than a change in the primary trend.
Create your live VT Markets account and start trading now.
Start trading now – Click here to create your real VT Markets account
Written on March 25, 2026 at 9:58 pm, by josephine
The Bank of England held the Bank Rate at 3.75% and the decision was unanimous at 9–0. UOB now expects the GBP Repo Rate to stay at 3.75% through 4Q26, removing a prior forecast for three cuts in 2026.
The BoE’s stance shifted from planning for easing to closer watch on inflation risks. It indicated that rate rises could be considered if inflation pressures persist.
Inflation Risks Back In Focus
In its Monetary Policy Summary and Minutes, the BoE said it is ready to act to keep CPI inflation on track for the 2% target in the medium term. It also noted that disinflation had been continuing before the conflict, but a new shock is expected to push inflation higher in the near term.
The BoE warned that second-round effects, from wages and price-setting, become more likely the longer energy prices stay high. The Minutes added that a larger or longer shock could require a more restrictive policy stance, while a short-lived shock or more economic slack could lead to less restrictive policy.
The Bank of England’s decision to hold rates at 3.75% and signal potential hikes is a major shift from what we previously expected. Markets had been pricing in at least two rate cuts for 2026, but that outlook is now completely off the table. This change is reinforced by the latest Consumer Prices Index (CPI) report from February, which showed inflation remaining sticky at 2.8%, keeping pressure on the central bank.
This hawkishness is a direct response to recent external shocks, particularly renewed tensions in the Strait of Hormuz which have caused a spike in global energy prices. Brent crude has climbed over 15% in the last month to trade above $90 a barrel, feeding fears of imported inflation. The Bank is clearly signaling it will prioritise fighting this over supporting an economy that saw just 0.1% growth in the last quarter of 2025.
Market Pricing Shifts Rapidly
For derivative traders, this means immediately unwinding positions that bet on lower rates in the short to medium term. We are seeing a significant sell-off in short-sterling futures, and the UK 2-year gilt yield has already jumped 25 basis points to reflect the new reality. The overnight index swap market now indicates virtually no chance of a rate cut before 2027.
This policy stance is fundamentally supportive for the Pound, as higher potential yields attract international capital. Options strategies should now favour GBP strength, especially against currencies with more dovish central banks like the Euro or the Swiss Franc. Implied volatility in GBP/USD has risen to a three-month high, suggesting traders are preparing for larger price swings ahead.
We saw a similar rapid repricing of interest rate expectations back in 2022 when central banks began their aggressive fight against post-pandemic inflation. The key factor now, as it was then, will be the persistence of the shock and its impact on wage growth. All eyes will be on the next labour market report to see if these higher energy costs are creating the second-round effects the Bank fears most.
Create your live VT Markets account and start trading now.
Start trading now – Click here to create your real VT Markets account
Written on March 25, 2026 at 9:58 pm, by josephine