

Key Takeaways:
- The AI revolution still depends on physical infrastructure, including data centres, supply chains, and industrial production.
- Oil plays a critical role in powering transportation, construction, and petrochemicals used in technology manufacturing.
- Geopolitical tensions in major oil-producing regions can influence energy prices and indirectly affect AI development costs.
- Data centres require enormous energy consumption, linking the growth of AI to global energy markets.
- AI is also transforming the oil industry, helping companies improve exploration, efficiency, and production.
The Illusion of a Fully Digital Economy
Artificial intelligence is often presented as the defining force of the 21st-century digital economy. Technology companies are investing hundreds of billions of dollars into advanced AI models, while governments around the world are accelerating efforts to build the digital infrastructure required to support this transformation.
As artificial intelligence expands across sectors ranging from healthcare and finance to logistics, manufacturing, and energy, the modern economy increasingly appears to be driven by algorithms, data, and computing power.
Global Data Centre Electricity Demand Growth
Data Centre Energy Consumption Breakdown
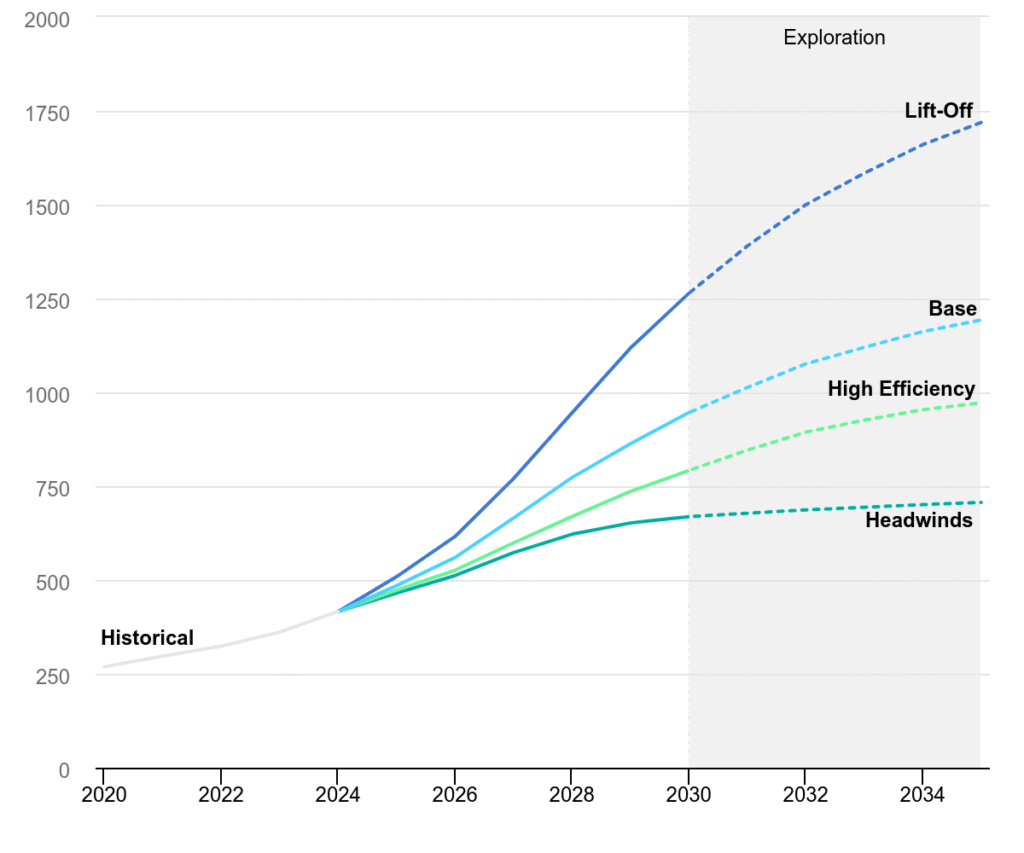
Key Data: Global Data Centre Electricity Consumption (2020–2035) According to IEA projections, data centre energy demand follows four primary sensitivity paths:
- Lift-Off (Accelerated Growth): Electricity demand is projected to reach approximately 1,750 TWh by 2035.
- Base Case: Forecasts a steady climb to roughly 1,200 TWh by 2035.
- High Efficiency: With advanced optimization, demand could be limited to just under 1,000 TWh.
- Headwinds (Stagnation): Constraints on growth could keep consumption near 700 TWh.
To many observers, this transformation suggests a departure from the traditional industrial economy. The digital world appears to operate independently from the physical systems that shaped earlier stages of economic development.
Yet this perception only captures part of reality.
Despite its digital nature, the artificial intelligence revolution does not operate in isolation from the traditional economy. Behind every algorithm and intelligent system lies a vast industrial framework composed of energy production, global supply chains, construction, and physical infrastructure.
At the centre of this framework remains one of the most important resources in the global economy: oil.
Why AI Scaling Depends on Heavy Industry and Diesel Fuel
Artificial intelligence may appear intangible, but the systems that power it are deeply physical. Advanced AI models rely on extensive computing infrastructure consisting of servers, specialised processors, and large-scale data centres.
Constructing a modern data centre is comparable to building a major industrial complex. These facilities require large quantities of cement, steel, and specialised equipment, along with heavy construction machinery that operates on diesel fuel. Hardware components and semiconductor equipment must travel through global logistics networks before reaching their final destination.
Once operational, data centres consume enormous amounts of electricity to support thousands of processors operating continuously. Maintaining stable operating temperatures also requires advanced cooling systems, which add further energy demands. As global adoption of artificial intelligence continues to expand, the energy requirements needed to support this digital infrastructure are rising rapidly.
The Petrochemical Foundation of AI: Using Oil to Build Hardware and Semiconductors
Oil remains deeply embedded within the industrial ecosystem that enables modern technology. Global transportation networks responsible for moving hardware, semiconductor components, and electronic equipment depend heavily on fossil fuels. At the same time, petrochemical industries derived from oil supply essential materials used throughout the technology sector.
Many components within modern electronics originate from petrochemical processes. Plastics used in devices, insulation materials that protect cables, and numerous structural elements within servers and computers all rely on oil-based derivatives. As a result, even the most advanced artificial intelligence systems ultimately depend on a network of industries closely tied to traditional energy resources.
Geopolitics, Oil Markets, and the Cost of Technology
Oil’s influence on the digital economy extends beyond infrastructure and manufacturing. Developments in global energy markets, particularly those shaped by geopolitical tensions, can significantly affect the broader economic environment in which technological systems operate.
Oil markets have historically been highly sensitive to geopolitical developments, especially in the Middle East, a region that contains some of the world’s largest oil reserves and plays a central role in global energy supply.

Recently, crude oil prices surged above $110 per barrel amid rising tensions in the region. Markets reacted quickly to concerns over potential supply disruptions and instability surrounding key energy corridors.
One of the most strategically important chokepoints is the Strait of Hormuz, through which roughly 20 million barrels of oil pass each day. This represents nearly 20 percent of global oil consumption, making it one of the most critical maritime routes for energy transportation. Any threat to this corridor introduces a geopolitical risk premium into oil prices, reflecting the possibility of supply disruption.
Satellite map showing vessel density in the Strait of Hormuz on 27 February 2026 vs 3 March 2026, highlighting the strategic maritime chokepoint


Source: BBC
When Energy Prices Rise, Technology Feels the Impact
Increases in oil prices rarely affect only the energy sector. Higher energy costs tend to ripple throughout the global economy by increasing transportation expenses, raising manufacturing costs, and pushing up the price of construction materials.
These sectors form the industrial base that supports the development of the digital economy. Data centres must be constructed, equipment must be manufactured and transported across continents, and large electrical systems must be installed to maintain reliable operations.
Consequently, fluctuations in energy prices can indirectly influence the cost of building and operating artificial intelligence infrastructure, including data centres, semiconductor manufacturing facilities, and the global supply chains that support the technology sector.
Even in an economy increasingly defined by data and algorithms, energy costs remain a fundamental factor shaping technological development.
Artificial Intelligence is Also Transforming the Oil Industry
The relationship between artificial intelligence and oil is not purely one of dependency. In recent years, the energy industry itself has begun adopting AI technologies to improve efficiency and optimise resource management.
Oil and gas companies increasingly use artificial intelligence to analyse geological data, identify promising drilling locations, and enhance reservoir modelling. Machine learning systems are also used to predict equipment failures before they occur, allowing operators to reduce downtime and avoid costly disruptions.
By improving operational efficiency and providing deeper analytical insights, artificial intelligence helps energy companies manage resources more effectively and optimise production processes.
A Symbiotic Relationship Between Old and New Economies
This dynamic highlights the mutually reinforcing relationship between the digital economy and traditional energy systems. Oil continues to support the industrial infrastructure that powers artificial intelligence, while AI provides advanced tools that allow the energy sector to operate more efficiently.
Rather than replacing the traditional industrial economy, artificial intelligence is evolving alongside it.
Major technological revolutions rarely emerge in isolation. Instead, they build upon existing economic systems and infrastructure that have developed over decades. The rise of artificial intelligence, therefore, represents not a break from the industrial past but an extension of it.
The Future: Technology Built on Energy
Artificial intelligence represents one of the most transformative technological developments of the modern era. Yet its rise does not mark the end of the industrial foundations that preceded it.
The digital revolution remains supported by energy systems, global supply chains, and physical infrastructure that continue to underpin modern industry. Every AI model, data centre, and intelligent system ultimately depends on these material foundations.
The future of the global economy will therefore be shaped not by technology or natural resources alone, but by the interaction between them. In that evolving relationship, oil and artificial intelligence remain far more connected than many people realise.
The Big Questions
- Does the growth of AI actually increase global oil demand?
While AI is digital, its existence depends on massive physical expansion. Building data centres requires heavy industrial production, and global supply chains rely on fuel-intensive logistics to move hardware. As AI scales, the industrial framework supporting it continues to draw heavily on traditional energy resources.
- Why do data centres still rely on fossil fuels if they are moving to green energy?
Energy costs are a major factor in the total cost of ownership for technology. When tensions rise in regions like the Middle East or near chokepoints like the Strait of Hormuz, oil prices often spike. These higher costs ripple through the economy, making it more expensive to manufacture semiconductors, transport components, and power the infrastructure that AI runs on.
- Is AI being used to make the oil industry more efficient?
The relationship is a two-way street. Energy companies are currently using machine learning to analyse geological data and identify drilling locations with higher precision. AI also helps predict equipment failures before they happen, which reduces expensive downtime and optimises overall resource management.
- Why is oil still relevant in an increasingly digital economy?
The digital economy is an illusion if viewed as something separate from the physical world. Beyond just power, oil is the literal raw material for the tech industry; petrochemicals are used to create plastics, insulation, and internal components found in every server and computer. AI isn’t replacing the old economy; it is being built right on top of it.
- Does AI increase oil demand?
Yes. AI growth requires physical data centres built with steel and cement, and global hardware logistics powered by diesel fuel.
- How does AI help the oil industry?
AI uses machine learning to analyze geological data, identify drilling locations, and predict equipment failure to reduce downtime.
Start trading now – Click here to create your real VT Markets account


