Market awaits US CPI report on Thursday

U.S. equities continued to march higher over the course of Tuesday’s trading. During his scheduled speech at the Swiss Riksbank, Fed chair Jerome Powell kept muted about the Fed’s upcoming monetary policy directions.

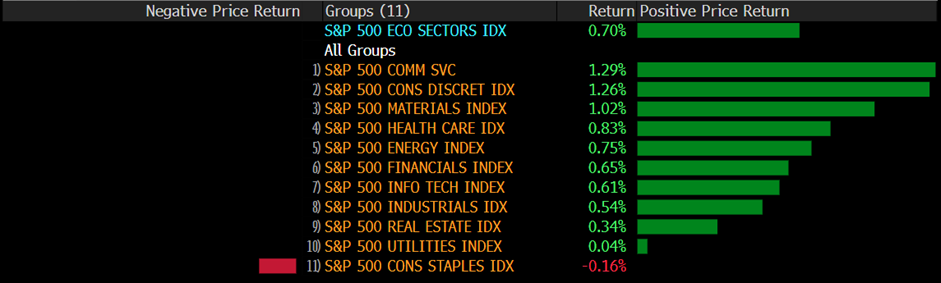
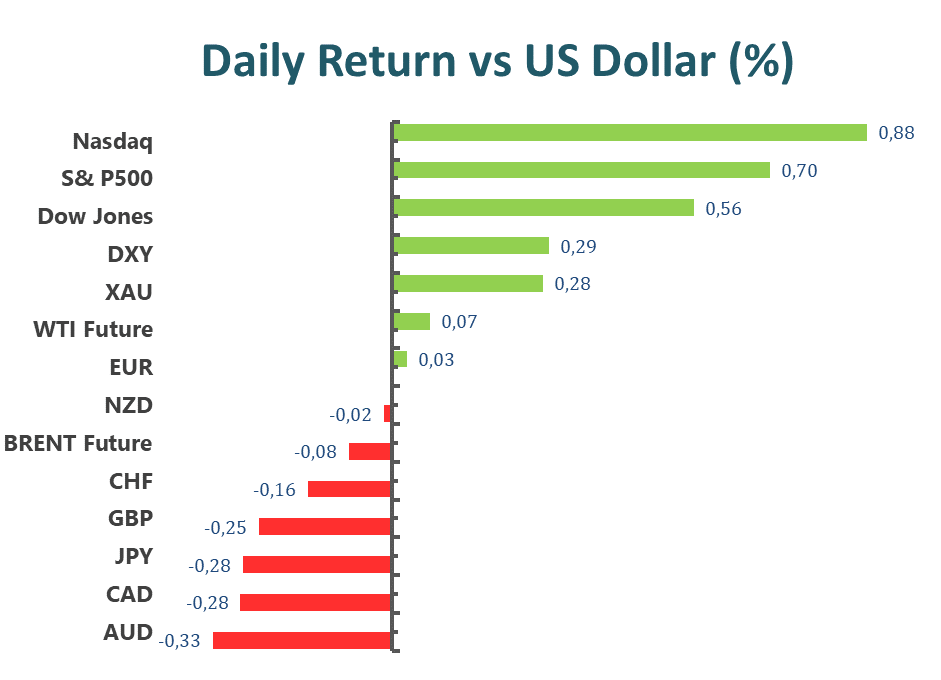
Market participants thus interpreted the muted response as a positive sign for equities; furthermore, the upcoming CPI report, scheduled for Thursday’s American trading session, is widely predicted to come in softer than expected. The Dow Jones Industrial Average gained 0.56% to close at 33704.1. The S&P 500 climbed 0.7% to close at 3919.25. The tech-heavy Nasdaq Composite gained 1.01% to close at 10742.63.

The benchmark 10-year U.S. treasury yield slipped 13 basis points to close at 3.606%, while the short-term 2-year yield ended the day at 4.245%.

The recent equity market rally, which began on the 6th, extended into its third trading day. Market participants are aided by the weakening Dollar and betting on a possible decrease in the Fed’s interest rate hike pace; however, as mid-January and late January roll around the corner, so is earnings season for major corporations. Fiscal 2022 Q4 earnings are expected to be lower than previous quarters as corporations begin to feel the pain of the consecutive 75 basis point interest rate hikes.

Main Pairs Movement

The Dollar index, which tracks the U.S. Greenback against a basket of major foreign currencies, has continued to decline for the third straight day. Market participants are bidding down the Dollar as they expect the Thursday U.S. CPI report to come in softer than expected. However, market participants should be aware that during his speech at Sweden’s Riksbank, Fed chair Jerome Powell noted that the Fed might need to make an “unpopular decision” to further bring down prices to the targeted 2% inflation rate.

EURUSD climbed 0.05% over the course of Tuesday’s trading. Range-bound trading for the pair is expected prior to Thursday’s major economic data release.

GBPUSD retreated 0.27% over the course of yesterday’s trading, despite a weaker Dollar. Thursday and Friday could be volatile for Cable as major economic data will be released by the two nations.

Gold climbed 0.28% over the course of Tuesday’s trading. The Dollar denominated Gold has continued to climb for the third straight day and now faces a key price level of $1870 per ounce.

Technical Analysis

EURUSD (4-Hour Chart)

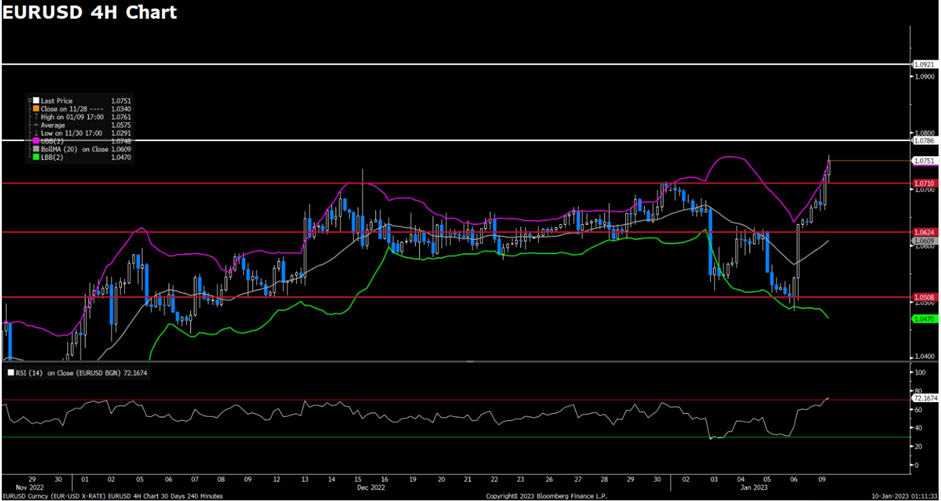
The EUR/USD pair advanced higher on Tuesday, trading in a tight range and rebounded slightly towards the 1.0750 mark amid the fading market optimism that dominated the start of the week. The pair is now trading at 1.0737, posting a 0.09% gain on a daily basis. EUR/USD stays in the positive territory amid renewed US Dollar weakness, as the greenback came under selling pressure after FOMC Chairman Jerome Powell refrained from commenting on the policy outlook. However, comments by Fed policymakers emphasizing the central bank’s resolution to curb inflation slightly weighed on investors’ mood, as Fed’s Daly and Bostic added that rates would need to be above the 5% range and would need to be held higher for longer. In the Eurozone, the rising German 10-year Bond yields are acting as a tailwind for the EUR/USD pair. Meanwhile, European Central Bank officials continue to speak with a hawkish tone.

For the technical aspect, RSI indicator 63 figures as of writing, suggesting that the bull is more favoured as the RSI stays above the mid-line. As for the Bollinger Bands, the price is hovering between the upper band and the moving average, therefore the upside traction should persist. In conclusion, we think the market will be slightly bullish as the pair is heading to re-test the 1.0750 resistance level. Technical indicators also hold directionless within positive levels, reflecting limited selling interest.

Resistance:  1.0750, 1.0786

Support: 1.0710, 1.0624, 1.0548

GBPUSD (4-Hour Chart)

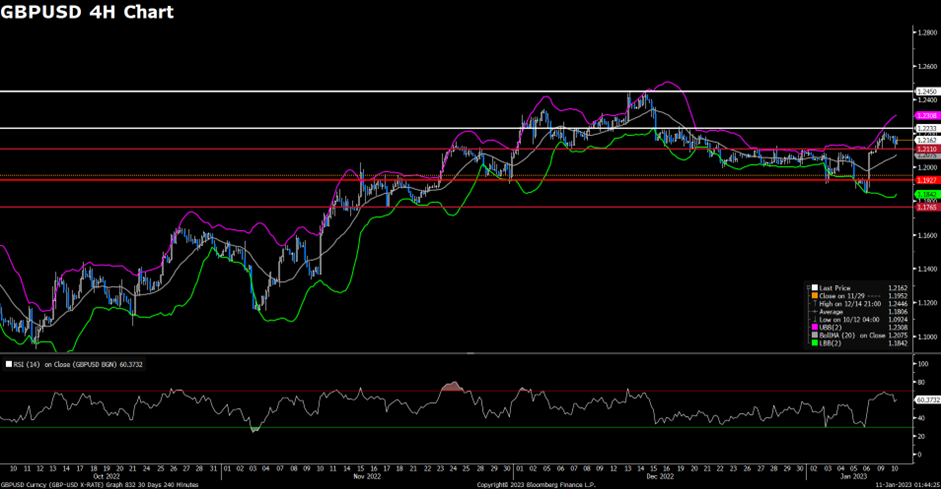
GBP/USD loses upward momentum and falls to around 1.2150. The US dollar index remains prudent in the cautious market mood and makes it difficult for the pair to gain traction. The US dollar index is currently trading at 103. On the other hand, US Treasury yields regain some upward traction and bounced off recent lows. As for Fed Chair Powell’s speech, there are no initial comments on current US economic or monetary policy from Powell in Sweden. Powell’s comments are on central bank independence and climate policy-making. The market now lacks catalysts. For more price action, eye on the US CPI report on Thursday.

For the technical aspect, the RSI indicator is 60 figures as of writing, suggesting that the pair is in bullish mode as the indicator keeps in a bullish region. For the Bolling  Bands,  the price is hovering between the upward average and upper bound, signalling that the trend is still upward. For the price action, the pair is now trading between the first resistance and the first support transformed from resistance after the breakthrough. In conclusion, we think GBPUSD is in a bullish mode based on the technical analysis. For the uptrend scenario, if the price breaks the resistance at 1.2233, it may head to test the resistance at 1.2450. For the downtrend scenario, if the price close negative below support at 1.2110, it may head to test the support at 1.1927.

Resistance: 1.2233, 1.2450

Support: 1.2110, 1.1927, 1.1765

XAUUSD (4-Hour Chart)

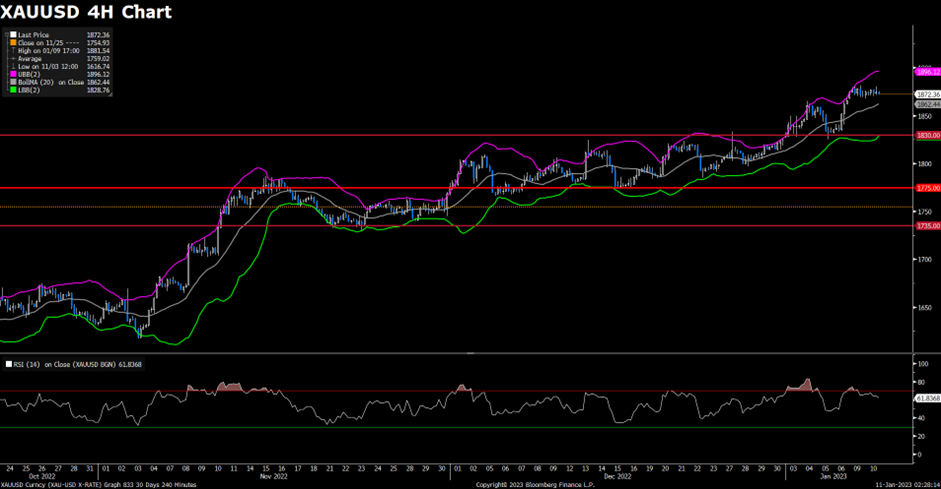
Gold price loses upward momentum on Tuesday as the US dollar index remains prudent on the cautious market mood. At the time of writing, gold price hold around $1,872. On the other hand, US Treasury yields regain some upward traction and bounced off recent lows. The benchmark 10-year US Treasury bond yield is up nearly 2% on the day at around 3.6%, limiting the upside for gold prices. For more price action, eye on the US CPI report on Thursday, which may provide cues of future monetary policy.

For the technical aspect, RSI indicator 62 figures as of writing, holding above the mid-line, suggesting that the pair is in bullish mode. For the Bolling  Bands, the price is hovering between the upward average and upper bound. The upward trend should persist. For the price action, the price holds in a narrow range from Monday as the market now lacks catalysts. In conclusion, we think the gold price is still in a bullish mode based on the technical analysis. For the uptrend scenario, the price needs a decisive breakthrough to trigger the follow-through buy interest. For the downtrend scenario, traders should aware of the key level at $1,830. If the price drop below this level on the 4H chart, it may change the current trend.

Resistance: 1879, 1889

Support: 1830, 1775, 1735

Economic Data

CurrencyDataTime (GMT + 8)Forecast
AUDRetail Sales (MoM) (Nov)08:300.6%
USDCrude Oil Inventories22:30-2.243M

Leverage adjustment for US Shares – January 11, 2023

Dear Client,

Due to high market volatility, VT Markets will adjust the leverage of US CFD Shares starting 16 January 2023:

The above data is for reference only, please refer to the MT4/MT5 software for specific data.

Please note that other contract specifications will remain the same.

If you’d like more information, please don’t hesitate to contact [email protected].

Volatility on the first trading day of the week

U.S. equities witnessed a volatile trading session on the first trading day of the week. The initial hours of the American trading session saw equities extend their risk rally that started last Friday, however, markets turned cautious after Atlanta’s Fed president Raphael Bostic reiterated the central bank’s intentions of increasing rates beyond 5% to control inflation.

The Dow Jones Industrial Average lost 0.34% to close at 33517.65. The S&P 500 edged 0.08% lower to close at 3892.09. The tech-heavy Nasdaq Composite gained 0.63% to close at 10635.65.

The benchmark U.S. 10-year treasury yield gained 19 basis points and was last seen trading at 3.536%; while, the 2-year yield currently trades at 4.212%.

Tesla Inc’s 6% rally on Monday led the Nasdaq Composite to notch a winning session. Tesla has recently announced another round of price cuts in its China market to compete against growing Chinese-originating EV producers—specifically BYD.

Market participants will now turn their attention to the key U.S. CPI release scheduled for the American trading session on the 12th.

Main Pairs Movement

The Dollar index, which tracks the U.S. Greenback against a basket of major foreign currencies, continued to slump on the first trading day of the week. The Dollar index fell 0.71% throughout Monday’s trading as market sentiment continues to turn risk on.

EURUSD climbed 0.83% throughout Monday’s trading. The broad-based weakness of the Dollar allowed the Euro to climb for the second consecutive day.

GBPUSD rallied 0.8% over Monday’s trading. Price action for Cable could be dramatic as major economic data releases are scheduled for both the U.S. and Britain starting on Thursday.

Gold climbed above $1880 per ounce throughout Monday’s trading, but the precious metal could not hold its value as the Dollar made a late-session comeback. Gold was last seen trading at $1869 per ounce.

Technical Analysis

EURUSD (4-Hour Chart)

The EUR/USD pair advanced sharply on Monday, preserving its upside traction and clinched fresh multi-week peaks amid investors’ re-assessment of the potential next steps by the Federal Reserve when it comes to future interest rate hikes. The pair is now trading at 1.0747, posting a 1.03% gain daily. EUR/USD stays in the positive territory amid a weaker US Dollar across the board, as the risk appetite and lower US Treasury bond yields dragged the greenback to the lowest level since June 2022 near the 103.00 mark. The solid job creation alongside easing wage pressure both boosted speculations about a slowdown in the Fed rate hike cycle, favouring an increase of 25 basis points instead of 50 bps. The wage growth seems to have lost momentum, leading traders to start pricing in some probable pause in the Fed’s hiking cycle. In the Eurozone, the Unemployment Rate in the broader Euroland remained steady at 6.5% in November. The improving market mood also provided a boost to the EUR/USD pair as investors await comments from Fed officials.

For the technical aspect, RSI indicator 72 figures as of writing, suggesting the pair is now facing heavy bullish momentum as the RSI approached overbought readings. As for the Bollinger Bands, the price is moving alongside the upper band, therefore a continuation of the upside trend can be expected. In conclusion, we think the market will be bullish as the pair is heading to test the 1.0786 resistance level. Technical readings in the four-hour chart also skew the risk to the upside.

Resistance:  1.0786, 1.0921

Support: 1.0710, 1.0624, 1.0508

GBPUSD (4-Hour Chart)

GBP/USD advances on the soft US dollar index on Monday. Market participants now expect that the US Federal Reserve would slow down rate hikes as the US inflation report and employment report cause an upbeat market mood. On the other hand, UK politics and hawkish BoE commentary also lift the GBP/USD. UK Prime Minister Rishi Sunak said that inflation is not guaranteed to decline in 2022 and that the government would need to be disciplined to curb inflation, Reuter reported. BOE’s policy maker Catherine Mann said that Price caps on energy in response to a price surge following Russia’s invasion of Ukraine might be sparking inflation in other sectors by boosting consumer spending. At the time of writing, the GBP/USD is trading at 1.218.

For the technical aspect, RSI indicator 67 figures as of writing, suggesting that the pair is in bullish mode as the indicator keeps going up. For the Bolling  Bands,  the price is moving higher between the upward average and upper bound, signalling the recent upward trend. For the price action, the price broke through the first resistance at 1.2210 and is now testing the resistance at 1.2233. If the price closes above the current resistance on the 4H chart, it may head to test the pivotal resistance at 1.2450, which is also the highest since June 2022. In conclusion, we think GBPUSD is in a bullish mode based on the current market mood and the technical analysis.

Resistance: 1.2110, 1.2233, 1.2450

Support: 1.1927, 1.1765

XAUUSD (4-Hour Chart)

The broad US Dollar weakness pushed the gold price to $1,881 on Monday, its highest since June 2022. The Us dollar index fell on an upbeat market mood amid speculation that the federal reserve has room to slow down its pace of monetary tightening. On the other hand, China opened sea and land crossings with Hong Kong on Sunday and ended a requirement for incoming travellers to quarantine, which will positively influence global growth and lift the risk appetite. At the time of writing, gold price hold around $1,872.

For the technical aspect, RSI indicator 66 figures as of writing, holding close to the overbought zone, suggesting that the pair is in bullish mode. For the Bolling  Bands, the price is moving up between the upward average and upper bound, which is a standard pattern for the upward trend. For the price action, the current pivotal support is at $1,830, which is also the critical price for bull-bear conversion. In conclusion, we think the gold price is in a bullish mode based on the current market mood and the technical analysis. On the downside, traders should aware of the critical level at $1,830. If the price drop below this level on the 4H chart, it may change the current trend.

Resistance: 1874, 1884

Support: 1830, 1775, 1735

Economic Data

CurrencyDataTime (GMT + 8)Forecast
USD                Fed Chair Powell Speaks22:00 

Intro to VT Markets’ MT4

Congratulations and thank you for choosing VT Markets’ Metatrader 4. Combining VT Markets with Metatrader 4 will allow you to benefit from:

  • No Dealing Desk Execution
  • No Requotes
  • 100% Straight Through Processing
  • Regulated Standards
  • Funds Secure in Segregated Client Accounts
  • Leverage up to 500:1
  • Award-winning Execution Speeds
  • Competitive spreads from 0.0 pips
  • 24/7 Premium Customer Support

Metatrader 4 for PC is an easy and flexible online trading system for managing Forex trades and strategies. The VT Markets version of the MT4 platform provides a wide array of market analysis tools, such as Expert Advisors, that can be used to gain insight into the patterns of the global foreign exchange markets, without the requirement of constantly scanning the market manually. Coupled with our highly competitive pricing, forex traders are able to develop and implement strategies with minimal ongoing effort.

Before using MT4:

It is advised that traders should gain a basic understanding of the Forex market and trading fundamentals. For those new to trading, VT Markets provides many educational tools and learning resources on both the Education and Forex News sections of our website.

It is important to trial out a demo account, if you are new to online trading and/or Metatrader 4. It will be a useful opportunity to familiarise yourself with the platform and to learn the skills and risks of trading. The demo account is a free 30 day trial $50,000 account and a full version mirror of the live trading environment.

All traders are advised to consider and read the Financial Services Guide and Product Disclosure Statement, provided at Legal document page on our website.

MT4 Installation

Getting Started

  • Download the VT Markets MetaTrader 4 (MT4) software
  • Run the exe file and select ‘Run’ when the dialogue box appears
  • Select ‘Yes” when asked if you want to allow the program to make changes
  • Click ‘I Agree’ upon finishing reading the License Agreement
  • If you would like to set a custom install folder select ‘Settings’ before proceeding
  • Click ‘Next’ and proceed through the VTMarkets MT4 Setup
  • The installer will now download the latest version of MT4, once this is complete, click ‘Finish’

Upgrade your MT4 terminal

VT Markets have expanded the capabilities of MT4 by adding new and exciting features, including:

  • Trading Central Tools package
  • Economic calendar
  • Account management facilities
  • Forex News Terminal

A few little tips & tricks to get more from MT4

If you’re a forex trader you’ll know that MetaTrader 4 is the king of Forex trading platforms. Not only does it allow you to place and manage orders, undertake various technical analysis functions and auto trade, it also allows you to do plenty of not-so-well-known things. Let’s talk about a few.

First, the ruler tool. This is super handy when measuring this distance (in pips) between two points… ie stop loss and entry, etc. So how do you get this tool? Simple, click on the cross hair, or press Ctrl+F and click and drag between two points. You’ll find all sorts of handy info such as pip-distance, the number of bars in a range and the date. Not bad!

Secondly, if there are some indicators, scripts or EAs that you frequently use, why not make it easier to access them. Simply right-click on the item of your choosing and select ‘Add to favourites’. Now that was simple!

When it comes to becoming a better trader, it is super beneficial to go back over previous trades to see what you did right or wrong. So for a deeper look into your closed trades in MT4, pop on over to ‘Account History’ in the terminal. Just click on a closed position, drag it on to the chart in which you placed the trade, and presto, you’ll see the entry, target, exit mark data as well as the stop less, etc. This is great to see how you can improve on your market timing, stop losses and profit targets, as well as further refining your setups.

Use a customised template that you’ve created and are sick of always switching to it when you open a new chart? Well, here’s one for you. Set up your template to exactly how you like it, right click and choose ‘Template – Save Template’, and save it as ‘Default’. Now, every time you open a new chart it will automatically have your template as the MetaTrader 4 default.

I personally find it helpful to write notes on charts so that when I’m reviewing my trades I can go back to exactly why I took the trade, emotions, thoughts, things I notice about the market, etc. To do this, head up to the Insert menu and choose ‘Insert Text’ and you can enter whatever you want. And, you can use multiple text boxes.

There you go, I hope these few little not-so-well-known tips and tricks make your MT4 life just a little bit faster and easier.

Week ahead: Markets to focus on US CPI. Will it continue to slow down in December?

The US CPI has been slowing down over the past few months. However, it’s likely that this trend will continue into December as well.

Here are market events to look out for this week:

Australia Consumer Price Index (11 January)

The October Consumer Price Index (CPI) in Australia fell below September’s record high of 7.3%.

Analysts expect November’s CPI reading to rebound higher to 7.5%.

US Consumer Price Index M/M (12 January)

The Consumer Price Index in the US rose 0.1% from November 2022, slowing from the 0.4% increase in October. This indicates that annual inflation in the US slowed for a fifth straight month to 7.1% in November 2022, its lowest point since December 2021.

Analysts expect that US CPI might continue to slow down and will be released at -0.1% in December 2022, which means that inflation is slowed more to 6.9%.

UK Gross Domestic Product M/M (13 January)

The economy in the UK grew 0.5% in October from September 2022, the most significant increase in nearly a year.

Analysts predict November’s GDP to be unchanged at 0.0%.

Prelim University of Michigan (UoM) Consumer Sentiment (13 January)

In December 2022, the University of Michigan revised its consumer sentiment index for the US upward to 59.7 in December 2022 from 59.1 in the previous month.

Analysts expect this month’s UoM Consumer sentiment index to be higher at 60.

US Employment data indicate that employment rose in December

U.S. equities scored their best trading day of the year throughout last Friday’s trading. The Dow Jones Industrial Average climbed 2.13% to close at 33630.61. The S&P 500 gained 2.28% to close at 3895.08. The tech-heavy Nasdaq composite jumped 2.56% to close at 10569.29. U.S. equities rose after the U.S. nonfarm payrolls and unemployment change data both indicated higher employment during the previous month.

The nonfarm payrolls came in at 223K, while the monthly unemployment change came in at 3.5%. Furthermore, the ISM PMI figure came in below market expectations at 49.6, indicating a slowdown in private-sector purchasing. Market participants assumed that the higher employment and falling private sector purchasing would prompt the Fed to throttle back on interest rate controls, thus equities rallied while treasury yields and the Greenback retreated.

The benchmark U.S. 10-year treasury yield was last seen trading at 3.56%, while the 2-year yield sits at 4.258%.

On the economic docket, Fed chairman Jerome Powell is due to speak during the American trading session on the 10th. The U.S. will release core CPI and initial jobless claims figures on the 12th, and the U.K. will release GDP and manufacturing figures on the 13th.

Main Pairs Movement

The Dollar index, which tracks the U.S. Greenback against a basket of major foreign currencies, slumped 1.18% throughout Friday. Market participants sold the Greenback after the “Fed desired” U.S. economic data released throughout Friday’s American trading session. Retreating U.S. yields acted as a headwind for the falling Dollar.

EURUSD jumped 1.12% throughout Friday’s trading. The Dollar weakness across markets allowed Euro bulls to bid the Euro higher and allowed the pair to reverse a four-day loss.

GBPUSD soared 1.54% throughout Friday’s trading. While there were no major economic data releases from the U.K., the lower-than-expected U.S. PMI data sparked a selloff of the Dollar.

Gold climbed 1.82% throughout Friday’s trading. The Dollar denominated Gold soared after a broad-based selloff of the U.S. Greenback.

Technical Analysis

EURUSD (4-Hour Chart)

The EUR/USD pair advanced higher on Friday, regaining upside traction and recovered towards the 1.0600 mark after the release of the US NFP report. The pair is now trading at 1.0609, posting a 0.85% gain daily. EUR/USD stays in the positive territory amid weaker US dollars across the board, as the US job data weakened the US Dollar even though the labour market remains tight. The US Nonfarm Payrolls rise by 223,000 in December, which came in much higher than the market expectation of 200,000 and exerted bearish pressure on the greenback. The upbeat employment figures caused investors to reassess the Fed’s policy outlook as the CME Group FedWatch Tool’s probability of a 25 basis points Fed rate hike in February declined to 57% from 70% on Wednesday. In the Eurozone, the Eurozone Consumer Price Index (CPI) for December came at 9.2%, which was lower than expected but failed to drag the EUR/USD pair lower amid the renewed US dollar weakness.

For the technical aspect, the RSI indicator is 54 figures as of writing, suggesting the pair could extend its daily gains as the RSI is rising sharply. As for the Bollinger Bands, the price witnessed fresh buying and climbed above the moving average, therefore a continuation of the upside trend can be expected. In conclusion, we think the market will be bullish as the pair is testing the 1.0583 resistance. Euro bulls are now looking at the 1.0624 area which is the next resistance.

Resistance:  1.0583, 1.0624, 1.0710

Support: 1.0508, 1.0467

GBPUSD (4-Hour Chart)

GBP/USD recovers lost territory from Thursday’s losses, reclaims 1.12 on soft USD after US NFP report. US Nonfarm Payrolls rose by 223K, exceeding expectations, and pointing to a solid labour market. The unemployment rate fell to 3.5%, while Average Hourly Earnings fell to 4.6%, compared with expectations for 5%, suggesting that inflation on wages is easing. USD index dropped to around 104, which favours GBPUSD. The pair rose accordingly. At the time of writing, the pair is trading at 1.2071, posting a 1.5% gain daily.

For the technical aspect, the RSI indicator is 60 figures as of writing, rebounding from the oversold zone. The RSI indicator rose sharply, indicating the pair may continue on its upward traction. For the Bolling  Bands,  the price rose sharply through the average from the lower bound. A continuing upward trend could be expected. For the price action, the pair recover lost territory below a first support level and is now hovering around 1.21 at the time of writing, close to the first resistance level at 1.2110. In conclusion, we think GBPUSD is in bullish mode. Based on the technical analysis, there is a high possibility to break through the first resistance of 1.2110. On the upside, if the price advance above the resistance level at 1.2110 on 4H Chart, it may head to test the next resistance at 1.2233.

Resistance: 1.2110, 1.2233, 1.2335

Support: 1.1927, 1.1765

XAUUSD (4-Hour Chart)

The gold price soared on the solid US NFP data. In the US trading session on Friday, the US Bureau of Labor Statistics revealed that US Nonfarm Payrolls rose by 223K, exceeding expectations. The unemployment rate fell to 3.5%, while Average Hourly Earnings fell to 4.6%, compared with expectations for 5%, suggesting that inflation on wages is easing. Markets reacted to the US economic figures. The US dollar index dropped to around 104, while the US 10-year yield rose from 3.73% to 3.57%. The gold price soared directly from $1,835 to $1,860, refreshing the highest level from last mid-June. At the time of writing, the price is hovering around $1,870.

For the technical aspect, the RSI indicator is 70 figures as of writing, rising from 50. The RSI indicator rose sharply, indicating the pair may continue on its upward traction. For the Bolling  Bands,  the price goes up along with the upward trading average and is now trading around the upper bound. For the price action, the pair rises sharply and makes a higher high on its pattern, which is a standard pattern for the upward trend. In conclusion, we think the gold price is in a bullish mode based on the technical analysis, and there is a high possibility to continue on its upward trend. That said, the RSI indicator and Bolling  Bands both show signs of being overbought. Traders should be aware of the risk of a correction.

Resistance: 1874, 1884

Support: 1775, 1735, 1700

ADP result surprised the market, all eyes switched to NFP

U.S. equities continued to fall throughout Thursday’s trading. Equities retreated due to the upside surprise from the ADP nonfarm employment change, which showed that employers added 235,000 jobs in December, and initial jobless claims, indicating 204,000 claims in December. The two red-hot job reports affirmed the Fed’s reservations on the contractual effectiveness of its interest rate hikes. The tight labour market report sparked a rally in treasury yields and the U.S. Greenback.

The Dow Jones Industrial Average dropped 1.02% to close at 32930.08. The S&P 500 lost 1.16% to close at 3808.1. The tech-heavy Nasdaq Composite slumped 1.47% to close at 10305.24. The U.S. 10-year treasury yield was last seen trading at 3.725%.

Equities were dragged down by the downside surprise of earnings results released by Walgreens (NAS: WBA) and Bed, Bath & Beyond (NAS: BBBY). Walgreens, which dropped more than 6% over yesterday’s trading, showed a $5.2 Billion opioid litigation settlement that dragged quarterly earnings. Bed, Bath and Beyond plummeted more than 29% after the company announced cash insufficiency and possible chapter 11 bankruptcy.

Main Pairs Movement

The Dollar Index, which tracks the U.S. Greenback against a basket of other major foreign currencies, rose more than 0.8% throughout yesterday’s trading. The ADP nonfarm payrolls and initial jobless claims, both coming in above market expectations, buoyed the Dollar higher as short-term U.S. interest rate expectations continue to price higher across markets.

EURUSD dropped 0.76% throughout yesterday’s trading. The Euro fared worse against the Dollar as market participants bid up the Greenback due to hotter-than-expected job reports. The construction PMI further indicated price levels remaining at elevated levels.

GBPUSD slumped 1.25% throughout yesterday’s trading. The British Pound weakened against the Dollar due to the broad-based Dollar’s strength. The British construction PMI is scheduled for today’s European trading session.

Gold lost 1.18% throughout yesterday’s trading. The Dollar denominated Gold lost ground as the U.S. Greenback surged across the board.

Technical Analysis

EURUSD (4-Hour Chart)

The EUR/USD pair shows an upside momentum faltered once again around 1.0630  and dropped to daily lows near 1.0529, breaking below the support at 1.0536, EUR/USD is 100 pips down from its Friday close, the spot saw its losses accelerate after the US ADP report showed the US private sector added 235K jobs during December, surpassing initial estimates, besides, weekly Jobless Claims rose less than expected, both shows the good health of the labour market in US. On the Europe side, the Construction PMI improved marginally to 41.7 in December, and the released November Producer Price Index, which rose at an annual pace of 27.1%, retreating from a revised 30.5% gain in October, In the near term, the pair is neutral-to-bearish and lack the conviction to surpass the recent resistance area near 1.0660 for the time being.

For the technical aspect, RSI indicator 14 figures as of writing, it’s suggestion strong buying signals and indicates an oversold or undervalued condition, estimated to be bullish and will rebound from the bottom. As for the Bollinger Bands, the price keeps hovering around the upper bound signalling the upside traction maintained in the near term, and the drop is expected. In the US, the key event is Friday’s release of the US Dec non-farm payrolls and the Eurozone inflation report. On the Europe side, Key events in the euro area this week are the Germany Retail Sales, EMU Flash Inflation Rate, and EMU Retail Sales,  which may bring motivation for the EURUSD buyers into the market.

Resistance:  1.0661, 1.0710

Support: 1.0310, 1.0536, 1.0461

GBPUSD (4-Hour Chart)

GBP/USD comes under heavy selling pressure on Thursday amid resurgent USD demand due to the FOMC  Meeting Minutes and PMI  yesterday and the dollar-positive ADP report released today, this pair continues losing ground through the early North American session and weakens further below the 1.2000 and aiming at the Support at 1.1927. According to the data published by Automatic Data Processing (ADP), the higher-than-expected demand from the US private sector employers provides a strong boost to the US Dollar, which, in turn, exerts downward pressure on the GBP/USD pair, the less hawkish outlook keeps the US Treasury bond yields depressed near a multi-week low, which could act as a headwind for the buck and lend some support to the GBP/USD pair.

For the technical aspect, RSI indicator 14 figures as of writing, it’s a suggestion for strong buying signals and indicates an oversold or undervalued condition, estimated to be bullish and will rebound from the bottom. For the Bolling  Bands,  it indicates the high volatility of the market. Both signals indicate the investors are interested in buying the market, however, the daily chart has just started gaining negative traction, the GBP/USD pair might then turn vulnerable and go for the 1.1927 mark. In the US, the ADP indicates momentum for the Dollar market, Friday’s release of the US Dec non-farm payrolls and Eurozone inflation report would provide fresh signals. In the UK, the weaker-than-expected UK services PMI added to a softer near-term tone, and more signals are required to define near-term direction.

Resistance: 1.2110, 1.2233, 1.2335

Support: 1.1927, 1.1765

XAUUSD (4-Hour Chart)

Gold price staged a downside correction after a four-day winning streak. Gold price fell more than 1% on Thursday, retreating from the highest level from mid-June, driven by a stronger US dollar and soaring US Treasury yields. The dollar regained strength after US data, before NFP. The ADP employment report showed that private payrolls increased by 235K over the 150K of expectation. Initial Jobless Claims dropped to 204K, the lowest since September. Markets reacted to the US economic figures. The dollar index advanced to 105, the highest level in three weeks while the US 10-year yield rose from 3.70% to 3.77%. The gold price fell directly below $1,850 to $1,831. At the time of writing, the price is hovering around $1,830.

For the technical aspect, RSI indicator 48 figures as of writing, slipping from the overbought zone, suggesting that it may continue on the correction. For the Bollinger Bands, the price dropped through the average as the price stage a strong downside correction in the near term. In conclusion, we think the market is still in bullish mode as the price still rally above the upward trend line. However, the gold price can keep falling modestly as technical analysis shows that the gold price is still under correction. On the downside, if the price drops below the trend line, it may change its current uptrend and head to test the next support at $1,775.

Resistance: 1865

Support: 1775, 1735, 1700

Economic Data

CurrencyDataTime (GMT + 8)Forecast
GBPConstruction PMI (Dec)17:3049.6
EURCPI (YoY) (Dec)18:009.70%
USDNonfarm Payrolls (Dec)21:30200K
USDUnemployment Rate (Dec)21:303.70%
CADEmployment Change (Dec)21:308.0K
USDISM Non-Manufacturing PMI (Dec)23:0055
CADIvey PMI (Dec)23:0051
Back To Top
server

Hello there 👋

How can I help you?

Chat with our team instantly

Live Chat

Start a live conversation through...

  • Telegram
    hold On hold
  • Coming Soon...

Hello there 👋

How can I help you?

telegram

Scan the QR code with your smartphone to start a chat with us, or click here.

Don’t have the Telegram App or Desktop installed? Use Web Telegram instead.

QR code