Stocks Slip as Market Consolidates Gains, Eyes Fed’s Inflation Target

On Monday, the S&P 500 ended the day lower, wiping out earlier gains that had brought the index to its highest level in nine months. The S&P 500 lost 0.2%, closing at 4,273.79, while the Nasdaq Composite dipped 0.09% to 13,229.43, and the Dow Jones Industrial Average dropped 0.59% to 33,562.86. Apple’s stock declined by around 0.8% after unveiling its virtual reality headset and software updates at its developers’ conference. Intel also saw a 4.6% drop due to Apple’s announcement of a new chip, and Nvidia pulled back on valuation concerns. JPMorgan Chase and Goldman Sachs faced struggles following news of potential increased capital requirements for large banks. The market’s recent consolidation of gains came after a broad-based rally on Friday, buoyed by positive economic indicators and the passage of the debt ceiling bill.

While investors are hopeful about the economy and the recent market rally, concerns linger about the narrow focus on a few tech stocks and the potential for an intermediate-term correction if market breadth does not improve. The Federal Reserve’s target for managing inflation is a key factor that could impact market movements going forward. Investors are eager to see if the central bank will revise its 2% inflation target. Despite these uncertainties, some analysts remain optimistic that the market can catch up and close the gap in other sectors as long as the economy continues to show resilience and avoid recessionary signs.

Data by Bloomberg

On Monday, the overall market experienced a slight decline of 0.20%. Among the different sectors, Communication Services saw a positive gain of 0.58%, followed by Utilities with a 0.45% increase. Health Care and Consumer Discretionary sectors also performed well, gaining 0.38% and 0.35% respectively. On the other hand, Materials experienced a slight decline of 0.10%. Consumer Staples, Real Estate, Information Technology, Financials, Energy, and Industrials all saw negative changes ranging from -0.35% to -0.71%.

Major Pair Movement

The US dollar weakened after the ISM services data revealed that a significant portion of the US economy was struggling to avoid contraction, with concerns about a potential recession. The decline in the ISM’s employment index, new orders, and prices paid contributed to the cautious market sentiment. This raised doubts about the possibility of a rate hike this month, supported by disinflationary data and indicators of a weaker labour market.

As a result, Treasury yields and the dollar reversed earlier gains, with expectations shifting towards a delay in rate increases. The euro-dollar exchange rate remained relatively unchanged despite the European Central Bank’s plans for future rate hikes. The British pound recovered slightly, while the US dollar against the Japanese yen experienced a decline. The market showed less willingness to pursue new Treasury yield and dollar highs, awaiting upcoming CPI data and Federal Reserve events.

In summary, the US dollar’s weakness reflected concerns about the struggling US economy and the potential delay in rate hikes by the Federal Reserve, leading to cautious market behaviour.

Picks of the Day Analysis

EUR/USD (4 Hours)

EUR/USD Rebounds as US Dollar Weakens on Disappointing Economic Data

The EUR/USD saw a rebound during the American session, driven by the broad-based weakness of the US dollar following the release of underwhelming US economic data. Federal Reserve rate expectations remain influential ahead of the upcoming June 13-14 meeting.

In contrast, the Euro experienced mixed performance due to lacklustre economic reports and European Central Bank President Christine Lagarde’s testimony. Lagarde hinted at potential rate hikes in the Euro area, while Eurozone data fell below expectations. Meanwhile, the US ISM Services PMI report further dampened the US dollar as it fell short of projections. Consequently, US Treasury bonds gained strength, impacting Wall Street and causing US yields to drop.

Chart EURUSD by TradingView

According to technical analysis, the EUR/USD pair is moving higher on Monday, reaching the middle band of the Bollinger Bands. Currently, the EUR/USD is trading just above the middle band, with the potential for it to move higher and reach the upper band of the Bollinger Bands. The Relative Strength Index (RSI) is currently at 49, indicating that the EUR/USD is in a neutral trend with a slightly bullish bias.

Resistance: 1.0766, 1.0824

Support: 1.0706, 1.0671

XAU/USD (4 Hours)

Gold (XAU/USD) Recovers as US Dollar Falters on Weak Data, Uncertainty Surrounds Fed’s Monetary Policy Decision

In the first half of the day, the US Dollar showed strength but later reversed course due to lacklustre American data. Amidst this, Gold (XAU/USD) rebounded from its intraday low and hovered near a recent high. The decline in the ISM Services PMI and modest Factory Orders growth put pressure on the USD, causing Treasury yields to fall. Market participants are grappling with uncertainty regarding the upcoming US Federal Reserve monetary policy decision, as inflation remains slow while the job market remains tight. As the decision approaches next week, financial markets await further communication from American policymakers.

The US Dollar started strong but reversed course due to weak US data, causing the XAU/USD to recover from a low and trade near a recent high. The decline in the ISM Services PMI and modest Factory Orders growth pressured the USD. US Treasury yields fell after initially rising post a solid Nonfarm Payrolls report. Uncertainty surrounds the upcoming US Federal Reserve decision, as inflation slows while the job market remains tight. Market participants anticipate the Fed to hold off on rate hikes in their June meeting but keep future hikes as a possibility. The Fed’s decision will be announced next week, keeping financial markets waiting for updates from American policymakers.

Chart XAUUSD by TradingView

According to technical analysis, the XAU/USD pair is moving higher on Monday, reaching the middle band of the Bollinger Bands. There is a possibility that the XAU/USD will continue to move higher and try to reach the upper band of the Bollinger Bands. Currently, the Relative Strength Index (RSI) is at 51, suggesting that the XAU/USD is in a neutral but slightly bullish trend.

Resistance: $1,970, $1,984

Support: $1,951, $1,937

Economic Data

CurrencyDataTime (GMT + 8)Forecast
AUDCash Rate12:303.85%
AUDRBA Rate Statement12:30

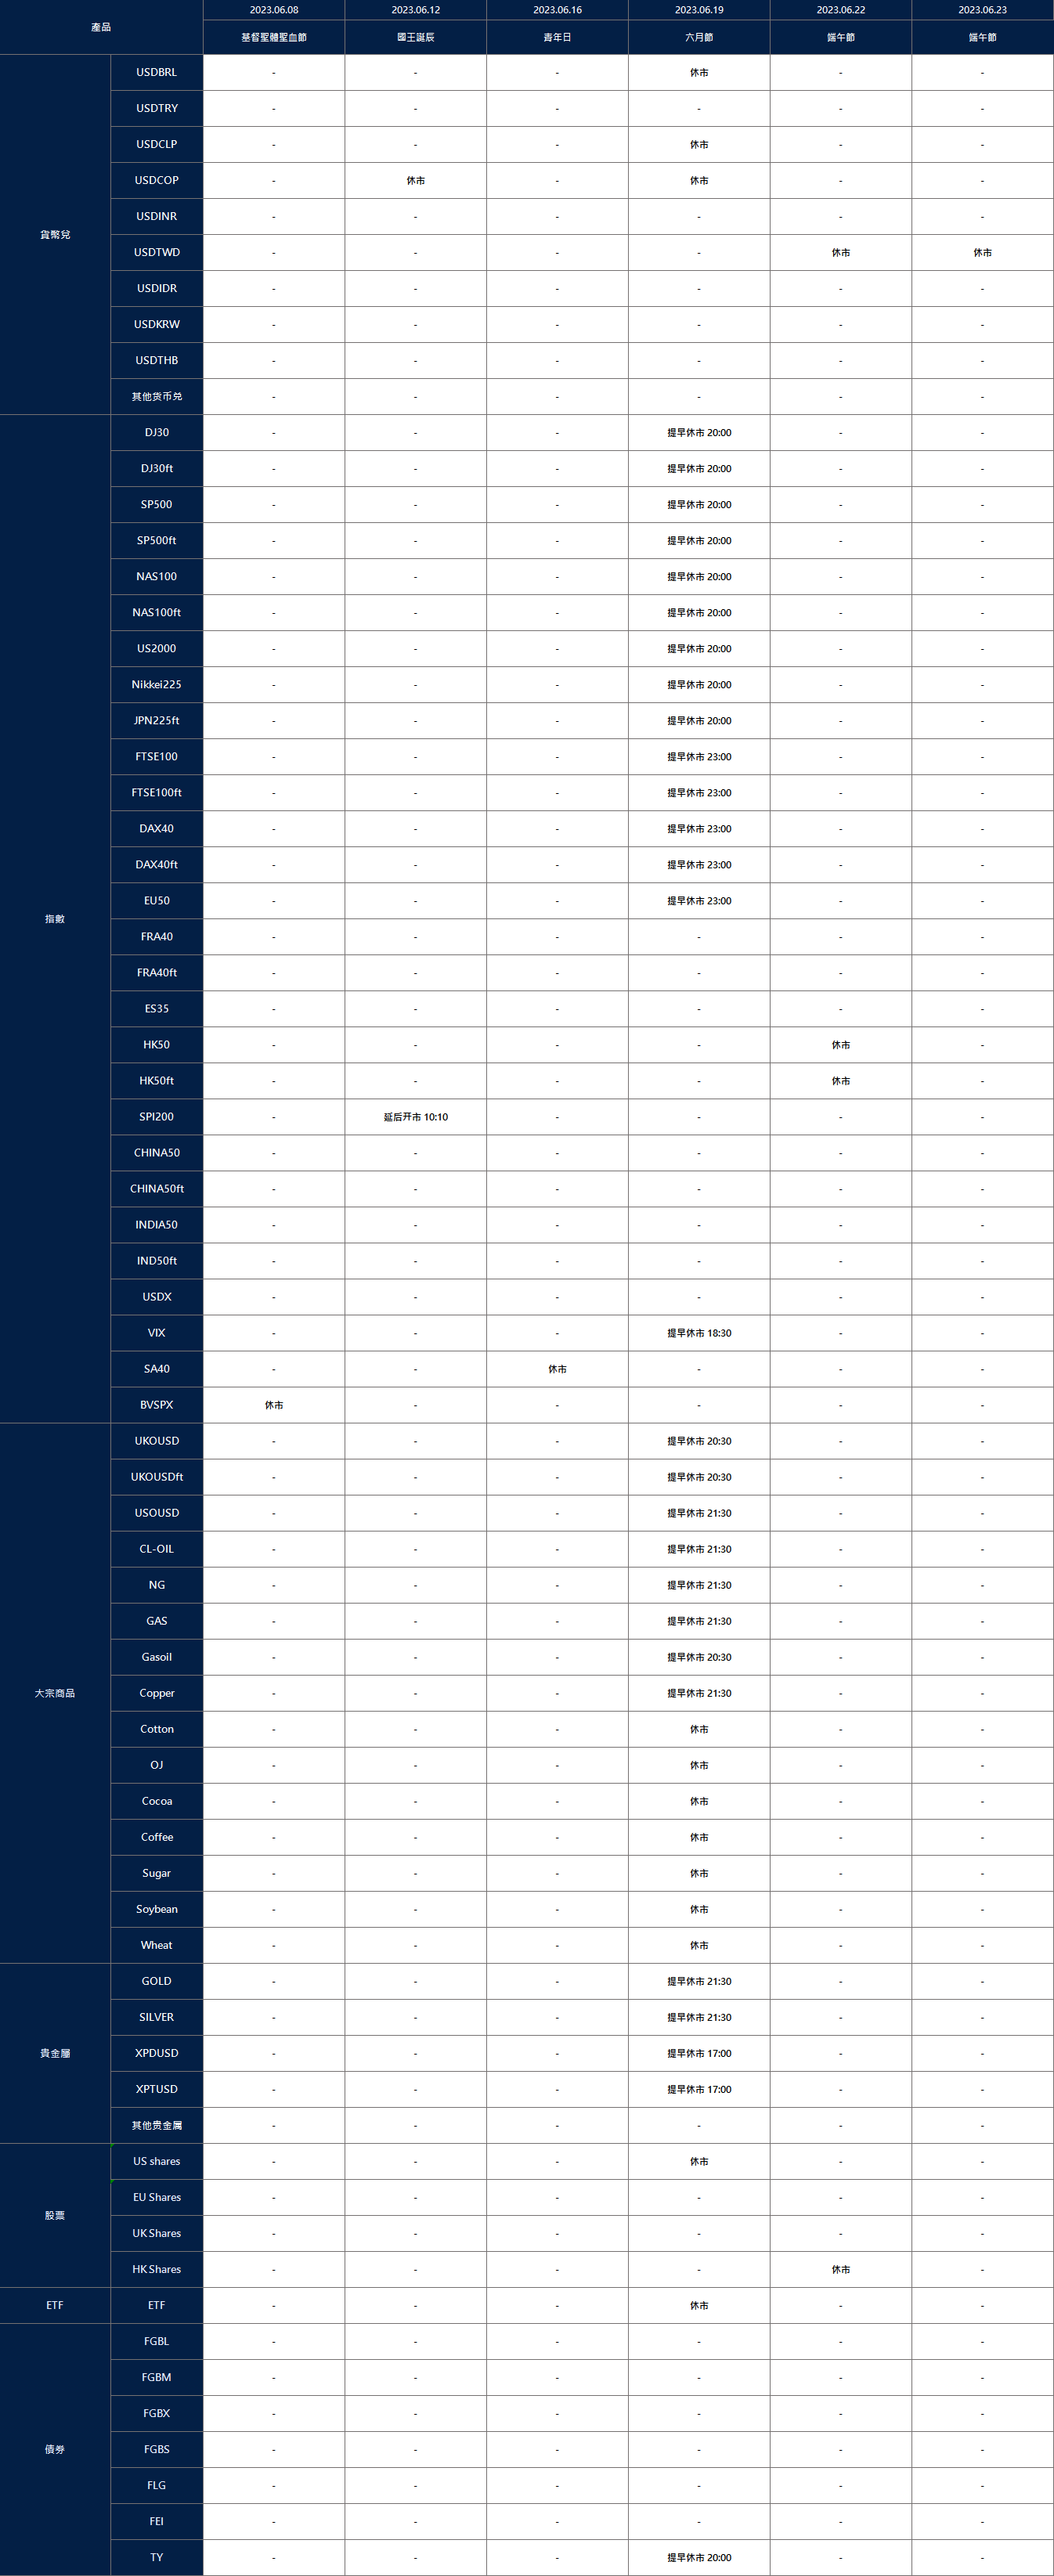
Notification of Trading Adjustment in Holiday – June 5, 2023

Dear Client,

Please note that the following instruments’ trading hours will be affected by the upcoming holidays.

Note: The dash sign (-) indicates normal trading hours.

The above data is for reference only, please refer to the MT4/MT5 software for specific data.

If you’d like more information, please don’t hesitate to contact [email protected].

Week Ahead: Markets to Focus on US ISM Services PMI, and RBA and BOC Rate Statements

" "

In the week ahead, market participants will turn their attention to key economic events including the US ISM Services PMI, as well as rate statements from the Reserve Bank of Australia (RBA) and the Bank of Canada (BOC). As analysts make their predictions, all eyes will be on these releases to understand their potential impact on financial markets

Switzerland’s Consumer Price Index (5 June 2023)

Consumer prices in Switzerland stalled in April 2023, showing less growth than the 0.2% rise observed in March 2023.

For May 2023 data, which is set to be released on 5 June 2023, analysts expect a 0.1% increase.

US ISM Services PMI (5 June 2023)

The US ISM Services PMI increased to 51.9 in April 2023 from 51.2 in March 2023.

Data for May 2023 is scheduled for release on 5 June 2023, with analysts anticipating a higher figure of 52.1.

Reserve Bank of Australia Rate Statement (6 June 2023)

In a surprising move, the Reserve Bank of Australia raised its cash rate by 25bps to 3.85% in May 2023, after keeping it at 3.6% in April 2023. This marks the 11th time the bank has increased rates in the past year.

The next cash rate will be released on 6 June 2023, with analysts expecting the RBA to hold its interest rate at 3.85%.

Bank of Canada Rate Statement (7 June 2023)

In its April 2023 meeting, the Bank of Canada (BOC) kept the target for its overnight rate unchanged at 4.5% and stated that it would continue to monitor the latest economic data for future decisions on the policy rate.

The next rate statement will be released on 7 June 2023. Analysts anticipate that the BOC will keep its interest rate steady at 4.5%.

Canada Employment Change (9 June 2023)

Canada’s economy added 41,400 jobs in April 2023 due to increased part-time work, the first growth since October 2022. The unemployment rate stayed at 5% for the fifth month, near the record-low of 4.9%.

For May 2023 data, set to be released on 9 June 2023, analysts predict that job creation will dip to 40,000 and the unemployment rate will rise to 5.1%.

Stocks Rise as U.S. House Passes Debt Ceiling Bill, Earnings Reports Impact Market

Stocks experienced gains as the U.S. House of Representatives successfully passed a debt ceiling bill, reducing the risk of a default. Despite a 4.7% decline in Salesforce shares following their earnings report, the Dow Jones Industrial Average rose by 0.47%, closing at 33,061.57. The S&P 500 and Nasdaq Composite also reached their highest levels since August 2022, with gains of 0.99% and 1.28% respectively. With the debt ceiling issue resolved, investors now turn their attention to the upcoming Federal Reserve policy meeting and the potential impact of rising interest rates.

The bipartisan passage of the Fiscal Responsibility Act, by a vote of 314-117, brought relief to the market by removing a major negative catalyst. The Senate is expected to follow suit, ensuring the bill reaches President Biden’s desk. Analysts suggest that the equity market had already discounted the debt ceiling concerns, shifting focus to the possibility of future interest rate hikes. Meanwhile, positive economic data, including stronger-than-expected private payroll growth and lower-than-forecasted jobless claims, reinforced the market’s optimism about the economy’s recovery. Investors will closely monitor the Federal Reserve’s policy meeting for insights into the central bank’s stance on interest rates.

Data by Bloomberg

On Thursday, the stock market saw overall gains, with all sectors experiencing positive movement except for Consumer Staples and Utilities. The Information Technology sector led the way with a strong increase of 1.33%, followed closely by Industrials, Materials, and Energy, all of which saw gains above 1%. Consumer Discretionary and Communication Services also performed well, with increases of 1.22% and 1.15% respectively. Financials and Health Care sectors showed solid growth as well, with gains of 1.09% and 0.67% respectively. Real Estate had minimal movement, with a slight increase of 0.03%. However, the Consumer Staples sector experienced a slight decline of -0.09%, while Utilities saw a notable decrease of -0.78%.

Major Pair Movement

On Thursday, the U.S. dollar weakened as concerns over the Federal Reserve’s rate hike cycle grew, while optimism surrounding the debt ceiling eased and U.S. economic data indicated a cooling economy. The dollar’s decline was also influenced by positive news from Europe, including better-than-expected economic indicators and the European Central Bank’s potential interest rate hikes. Additionally, the ADP report exceeded expectations, but revisions to previous job data and other economic indicators revealed a slowdown in the U.S. economy.

Investors are closely watching Friday’s payrolls data to gauge the Federal Reserve’s future actions and the impact on the dollar. If the payrolls report continues to outperform expectations, it could lead to a more bearish outlook for the dollar. Currently, a June rate hike by the Fed is seen as unlikely, and the probability of a 25 basis point hike in July is uncertain, while rate cuts are priced in for later in the year.

Meanwhile, the euro strengthened by 0.7% against the dollar, reaching its highest level in six sessions, supported by rebounding yield spreads and oversold charts. Sterling and risk-sensitive currencies like the Australian dollar also gained ground. However, the yen experienced a 0.4% loss due to declining Treasury-JGB yields and a reversal of the overbought uptrend observed in May.

Picks of the Day Analysis

EUR/USD (4 Hours)

EUR/USD Surges as Dollar Weakens Amid Falling Fed Rate Hike Expectations

The EUR/USD experienced a significant rally on Thursday, propelled by a widespread decline in the US dollar as expectations for Federal Reserve rate hikes diminished ahead of the US employment report. Eurozone data confirmed a slowdown in inflation, providing relief for the European Central Bank (ECB) and reducing the need for further interest rate increases. The weakening dollar was driven by signals from Fed officials suggesting a pause in rate hikes and increasing market expectations of future rate cuts.

Additionally, improved market sentiment, supported by positive Chinese data, the resolution of the debt ceiling issue, and easing inflation data, contributed to the dollar’s decline. Focus now turns to the Nonfarm Payrolls report on Friday, which is expected to provide further insights into the US economic situation.

Chart EURUSD by TradingView

According to technical analysis, the EUR/USD pair is moving higher on Thursday, creating upward momentum towards the upper band of the Bollinger Bands. Currently, EUR/USD is trading near the upper band of the Bollinger Bands. We anticipate that the EUR/USD will experience a slight downward movement today and attempt to reach the middle band of the Bollinger Bands. The Relative Strength Index (RSI) is currently at 61, indicating that the EUR/USD has entered the overbought zone.

Resistance: 1.0766, 1.0824

Support: 1.0706, 1.0671

XAU/USD (4 Hours)

Gold (XAU/USD) Rises as US Dollar Weighed Down by Mixed Economic Signals

The US dollar experienced a turbulent day of fluctuations as investors digested news from the United States, resulting in significant selling pressure on the currency and pushing XAU/USD (gold) to trade around $1,980 per troy ounce. The initial optimism surrounding the suspension of the debt-limit ceiling was followed by a brief recovery in the dollar due to positive labor market indicators. However, a downward revision in Q1 Unit Labor Costs and a contraction in the May ISM Manufacturing PMI underscored the fragility of the US economy, weakening the dollar and creating an environment favorable for gold. These mixed economic signals have put the Federal Reserve in a challenging position, with pressure to maintain an aggressive monetary policy while inflation remains subdued.

Chart XAUUSD by TradingView

According to technical analysis, the XAU/USD pair is exhibiting upward movement on Thursday, approaching the upper band of the Bollinger Bands. There is a possibility that the XAU/USD will experience a minor downward correction and retrace towards the middle of the Bollinger Bands throughout the day. At present, the Relative Strength Index (RSI) is at 62, suggesting that the XAU/USD is currently in the overbought zone.

Resistance: $1,984, $2,004

Support: $1,963, $1,951

Economic Data

CurrencyDataTime (GMT + 8)Forecast
USDNon-Farm Employment Change20:30193K
USDUnemployment Rate20:303.5%
USDAverage Hourly Earnings20:300.3%

Weekly Dividend Adjustment Notice – June 1, 2023

Dear Client,

Please note that the dividends of the following products will be adjusted accordingly. Index dividends will be executed separately through a balance statement directly to your trading account, and the comment will be in the following format “Div & Product Name & Net Volume ”.

Please refer to the table below for more details:

The above data is for reference only, please refer to the MT4/MT5 software for specific data.

If you’d like more information, please don’t hesitate to contact [email protected].

Stocks Fall as Debt Ceiling Debate Looms and May Trading Month Ends

Stocks declined on Wednesday as investors closely watched the federal debt ceiling debate in Washington. The Dow Jones Industrial Average dropped 0.41%, the S&P 500 dipped 0.61%, and the Nasdaq Composite slipped 0.63%. A debt ceiling deal between President Joe Biden and House Speaker Kevin McCarthy progressed to the House floor, with a vote expected later in the day. While analysts anticipate the deal to pass, concerns remain about potential adjustments and the need for more time to reach an official agreement. Investors are also focusing on the upcoming June Federal Reserve policy meeting.

The May trading month concluded with mixed performance. The Nasdaq Composite experienced a 5.8% increase, driven by gains in artificial intelligence-related stocks and technology companies. Despite a temporary loss in month-to-date gains during Wednesday’s market sell-off, the S&P 500 closed the month with a modest 0.3% gain. In contrast, the Dow Jones Industrial Average declined by almost 3.5% in May, primarily due to significant losses in several major companies, including Nike, Walt Disney, Walgreens, 3M, Chevron, and Dow, Inc. Investors are taking precautionary measures ahead of the debt ceiling vote, securing profits before potential market volatility.

Data by Bloomberg

On Wednesday, the stock market experienced a mixed performance across different sectors. The Utilities sector showed a gain of 0.96%, followed by Health Care with a positive movement of 0.85%. Real Estate also saw a modest increase of 0.66%, while Consumer Staples had a slight gain of 0.07%. However, there were declines in various sectors, with Energy being the hardest hit, dropping by 1.88%. Industrials experienced a decline of 1.40%, followed by Financials at -1.14%. Information Technology and Materials both had significant losses, with decreases of 1.09% and 1.12% respectively. Consumer Discretionary also showed a negative trend, declining by 0.92%. Communication Services had a slight decrease of 0.05%. These variations reflect the sector-specific performance and market dynamics observed on Wednesday.

Major Pair Movement

On Wednesday, the dollar index saw a 0.25% increase as EUR/USD declined by 0.56% due to indications of reduced need for rate hikes by the European Central Bank (ECB). Additionally, unexpected growth in U.S. job openings initially boosted the dollar, although concerns about overstating labor tightness and a negative miss in economic data tempered expectations for a June rate hike by the Federal Reserve (Fed). The dollar and yen benefited from derisking flows, while the euro, yuan, and China-linked currencies faced the most significant impact.

The market is closely monitoring the upcoming payrolls report on Friday, as it could influence the timing of rate hikes between June and July. The Fed and ECB are expected to raise rates by 25 basis points (bp) and 50bp, respectively, but the exact timing will depend on economic indicators. The yield curve inversion and hawkish Fed news weighed on banking stocks, although losses were mitigated by less hawkish signals from the Fed. EUR/USD hit a low not seen since March 20, and traders are eyeing a potential retest of 2023’s lows near 1.05. USD/JPY retreated after a brief rebound, and sterling recovered from earlier declines, posting a 0.17% increase.

Key highlights for Thursday include ADP employment data, jobless claims figures, and the ISM Manufacturing Index.

Picks of the Day Analysis

EUR/USD (4 Hours)

EUR/USD Plunges Amid Souring Sentiment and US Debt-Limit Concerns

The EUR/USD experienced a sharp decline on Wednesday as risk aversion prompted an increased demand for the U.S. dollar against higher-yielding currencies. The pair reached a low of 1.0658 during the European session but managed a slight recovery to trade at 1.0685. Investor concerns revolved around the U.S. debt-limit bill, which President Joe Biden and House Speaker Kevin McCarthy reached a deal on Sunday. The bill faced doubts from representatives of both ruling parties, needing to make progress within the next 24 hours. Additionally, Chinese economic data, including a contraction in the NBS Manufacturing PMI, added to the negative sentiment. The European session revealed a decrease in German inflation, further highlighting easing price pressures in the Eurozone. Market participants will await the release of the U.S. Chicago Purchasing Managers’ Index and JOLTS Job Openings later in the day, along with insights from Federal Reserve officials, as they anticipate the central bank’s upcoming monetary policy meeting.

Chart EURUSD by TradingView

According to technical analysis, the EUR/USD pair is moving lower on Wednesday, creating a push for the lower band of the Bollinger Bands. Currently, EUR/USD moving back higher and trying to reach the middle band of the Bollinger bands. We are expecting that the EUR/USD will continue its upward movement today and try to reach the upper band of the Bollinger Bands. The Relative Strength Index (RSI) is currently at 43, indicating that the EUR/USD has returned to a neutral position.

Resistance: 1.0711, 1.0761

Support: 1.0655, 1.0636

XAU/USD (4 Hours)

Gold (XAU/USD) Holds Gains as Risk Aversion Persists Amidst Concerns over US Debt Ceiling

Gold prices (XAU/USD) continued its weekly rally, reaching $1,974.76 per troy ounce, its highest level in a week. XAU/USD is trading around $1,965, retaining its gains amidst a general aversion to risk. The market sentiment turned negative on Tuesday and remained subdued on Wednesday due to lackluster Chinese data and uncertainty surrounding the US debt ceiling bill. In addition, the April JOLTS Job Openings report showed a robust job market, leading market participants to factor in a 71% probability of a 25 basis points rate hike at the upcoming June Fed monetary policy meeting. The strengthening US Dollar against major currencies, driven by a decline in stock markets, caused XAU/USD to retreat slightly from its peak. However, thanks to its safe-haven status, gold maintained a significant portion of its intraday gains. The US debt-ceiling bill has made progress, passing the House Rules Committee and moving into Congress, with Senate Majority Leader Chuck Schumer expressing the intention to expedite its floor vote in the Senate.

Chart XAUUSD by TradingView

According to technical analysis, the XAU/USD is moving higher on Wednesday, reaching the upper band of the Bollinger Bands and break our previous resistance level at $1,962. There is a possibility that the XAU/USD will make a slight downward movement and return to the middle of the Bollinger Bands for today. Currently, the Relative Strength Index (RSI) stands at 56, indicating that the XAU/USD is in a neutral position but slightly bullish.

Resistance: $1,972, $1,991

Support: $1,953, $1,934

Economic Data

CurrencyDataTime (GMT + 8)Forecast
EURCPI Flash Estimate17:006.3%
USDADP Non-Farm Employment Change20:15173K
USDUnemployment Claims20:30236K
USDISM Manufacturing PMI22:0047.0

Modifications on Forex – May 31, 2023

Dear Client,

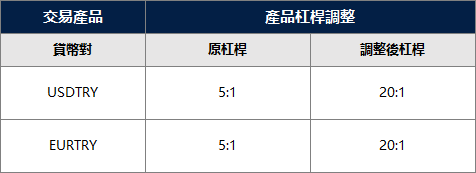
To provide a favorable trading environment to our clients, VT Markets will modify the trading setting of TRY Crosses products on June 05, 2023; Please find the table below for more information about this modification:

1. The TRY Crosses product’s leverage will be modified from 5 : 1 to 20 : 1

2. These products will have fully tradable access starting from June 5, 2023

The above data is for reference only, please refer to the MT4/MT5 software for specific data.

Friendly reminders:

1. The margin level of the positions may be affected by this adjustment; All specifications of the TRY Crosses products stay the same except for the mentioned adjustment.

2. You can continue to hold the positions during this adjustment period.

If you’d like more information, please don’t hesitate to contact [email protected].

Wall Street Weighs Debt Ceiling Deal and Fed Rate Hike Concerns Amidst Dow Jones Decline

On Tuesday, the Dow Jones Industrial Average experienced a decline as investors considered the prospects of Congress passing a tentative deal to raise the U.S. debt ceiling. The index closed down 50.56 points or 0.15% at 33,042.78. Meanwhile, the S&P 500 managed to eke out a minimal gain of 0.002%, closing at 4,205.52, and the Nasdaq Composite rose by 0.32% to finish at 13,017.43, albeit after paring back earlier gains.

Over the weekend, President Joe Biden and House Majority Leader Kevin McCarthy reached an agreement to raise the debt ceiling, aiming to avoid a default. The proposed bill will require support from both Republicans and Democrats to pass, with Congress scheduled to vote on it as early as Wednesday. Despite this progress, there are still hurdles to overcome in the House, as opposition within the GOP has been growing.

Investors also expressed concerns about the possibility of an interest rate hike by the Federal Reserve. According to the CME Group’s FedWatch tool, traders are currently pricing in a 68.8% chance of a rate increase next month. Richmond Fed President Tom Barkin maintained his rate forecast, stating that he hasn’t changed his position and that his forecast is among the higher ones within the central bank. The market is closely watching the Fed’s actions and how incoming inflation data will influence its decisions.

The Nasdaq received a boost from Nvidia, an artificial intelligence-related stock, which saw a nearly 3% rally. The stock reached a market capitalization of $1 trillion during Tuesday’s session, joining the elite group of companies that have achieved this milestone, following its strong earnings report from the previous week.

All sectors' performances amidst concerns of a potential raise to the US debt ceiling.

Data by Bloomberg

On Tuesday, the overall market performance was neutral, with all sectors collectively showing no change (+0.00%). Among the sectors that experienced gains, Consumer Discretionary had the highest increase of 0.76%, followed by Information Technology at 0.63%. Real Estate showed a modest increase of 0.27%. On the other hand, several sectors recorded losses. Consumer Staples had the largest decrease of 1.08%, followed by Energy with a decline of 0.94%. Health Care experienced a decrease of 0.67%, while Materials and Utilities both had losses of 0.59% and 0.39% respectively. Communication Services and Industrials also showed declines of 0.07% and 0.23% respectively. Financials remained unchanged at 0.00%.

Major Pair Movement

The EUR/USD currency pair showed signs of recovery from its 10-week lows on Tuesday, although there is a possibility that it may be influenced by the “sell in May and go away” stock market adage if U.S. data continue to outperform and investors continue to reduce their expectations of a Federal Reserve interest rate cut. These rate cut bets had increased during the U.S. regional banking crisis but have been diminishing and could decrease further if the debt limit deal is approved. The Federal Reserve’s cautious stance on rate hikes during the banking crisis and debt ceiling issue has eased, contributing to a 4.5% rebound in the dollar index since early May. However, it remains below the peak reached before the banking crisis.

The EUR/USD’s slight gain on Tuesday, despite a more bearish outlook, may only be a temporary bounce driven by month-end and pre-U.S. payroll book-squaring activities. The currency pair experienced a significant bearish reversal in May and is expected to retrace at least a portion of its recovery from 2022-23. The USD/JPY and EUR/JPY pairs both declined, with the yen gaining strength due to stable Japanese government bond yields compared to falling Treasury and bund yields following the debt ceiling deal. The USD/JPY also fell after reaching six-month highs as yen short positions became cautious following a meeting between the U.S. and Bank of Japan, which hinted at the possibility of FX intervention to support the yen if necessary. This intervention is viewed more seriously due to previous interventions in late 2023 that resulted in yen weakness and inflation surpassing the Bank of Japan’s 2% target. Sterling gained while the AUD/USD pair declined on concerns related to China.

Picks of the Day Analysis

EUR/USD (4 Hours)

EUR/USD Rebounds as USD Weakens, Debt Limit Drama Looms.

The EUR/USD experienced a slight increase, propelling the Euro to its best day in over a week. Despite the Eurozone’s Harmonized Index of Consumer Prices declining more than expected, the US dollar’s decline against European currencies and the yen provided support. However, the positive news for the European Central Bank regarding inflation may have negative implications for the common currency. Meanwhile, the US faces a potential debt default if Congress fails to pass a bill, adding to growing Republican opposition to the deal. Additionally, economic data shows a drop in the US Conference Board Consumer Confidence Index and the unexpected decline of the Dallas Fed Manufacturing Business Index. Important upcoming releases include the Chicago PMI, ADP Employment Report, and Nonfarm Payrolls report.

Chart of EURUSD performance amidst concerns of a potential raise to the US debt ceiling.

Chart EURUSD by TradingView

According to technical analysis, the EUR/USD pair is moving higher on Tuesday, rising above the 1.07 level and attempting to reach the upper band of the Bollinger Bands. It is anticipated that the EUR/USD will continue its upward movement today and strive to surpass the upper band of the Bollinger Bands. The Relative Strength Index (RSI) is currently at 48, indicating that the EUR/USD has returned to a neutral position.

Resistance: 1.0788, 1.0848

Support: 1.0715, 1.0655

XAU/USD (4 Hours)

Gold (XAU/USD) Rebounds as Debt Ceiling Optimism Fades and Market Concerns Mount

Gold prices (XAU/USD) experienced a rebound after hitting a low point for the day, trading near a daily high as optimism in financial markets wavered following news of a debt ceiling agreement to prevent a default in the US. However, sentiment deteriorated after a slow start to the week and concerns about lawmakers from both major parties being reluctant to pass the deal, reigniting fears of a default. Asian and European indexes traded mixed, influencing Wall Street, with the Dow Jones Industrial Average declining around 120 points and the S&P 500 and Nasdaq Composite struggling to maintain stability. Additionally, US CB Consumer Confidence decreased less than expected in May, indicating a somewhat less positive view of current conditions while expectations remained pessimistic.

Chart XAUUSD performance amidst concerns of a potential raise to the US debt ceiling.

Chart XAUUSD by TradingView

According to technical analysis, the XAU/USD is moving higher on Tuesday, reaching the upper band of the Bollinger Bands and touching the resistance level at $1,962. There is a possibility that the XAU/USD will make a slight downward movement and return to the middle of the Bollinger Bands before moving higher again today. Currently, the Relative Strength Index (RSI) stands at 55, indicating that the XAU/USD is in a neutral position but slightly bullish.

Resistance: $1,962, $1,991

Support: $1,934, $1,913

Economic Data

CurrencyDataTime (GMT + 8)Forecast
AUDConsumer Price Index09:306.4%
EURGerman Prelim CPITentative0.2%
CADGross Domestic Product20:30-0.1%
USDJOLTS Job Openings22:009.41M

CFD trading strategies

Contracts for difference, or CFDs, have become increasingly popular among traders in recent years thanks to their flexibility, accessibility and potentially profitable returns. However, having a sound CFD trading strategy is crucial to measurable success. A CFD trading strategy helps traders manage risk exposure and optimise potential returns.

As CFD brokers, we understand how important it is to have access to simple and digestible information when developing your trading strategy. In this blog, you’ll learn what CFD trading involves, the types of assets you can trade with and the common CFD trading strategies practised by seasoned traders worldwide.

What is CFD trading? 

CFD stands for “contracts for difference”, a contract between a trader and broker that tracks spot market movements. Unlike regular stock trading, where a trader must purchase an asset, CFD trading involves speculating on an asset’s underlying value without having to take ownership of it — traders only pay the difference from when they open a trading position to when it is closed.

What are the benefits of CFD trading?

CFD trading can provide traders with greater market exposure and increase their profit potential without holding an asset. Aside from this, there are other benefits traders can expect from this style of trading, including: 

  • Stretch your capital further — CFD trading utilises leverage, where traders can increase their position size, even if they don’t have the upfront capital to do so. For instance, if you wanted to buy 100 shares, you would not need to front the full cost immediately. This opens up a trader’s profit potential but can also bring on great losses. 
  • Low-cost — CFD trades have a significantly lower cost than traditional shares. For instance, CFDs often have tighter spreads — the difference between the buy and sell price — allowing traders to get more value from their trades.
  • Ability to go long or short — The freedom to easily go long or short can drastically increase the number of trading opportunities for traders who would otherwise only be able to go long with other assets. 

What kind of assets can you trade with CFDs?

Now that we understand how CFD trading works, you can move on to researching asset classes. When developing your CFD strategies, one of the things you will need to consider is the kind of asset you will be trading in. CFDs track many asset classes, giving you greater flexibility in choice. Some of the assets you can trade with via CFDs include:

  • Forex — CFDs can track currency pairs to trade forex. These involve two different currencies, with the value of one currency quoted against the other. For instance, EUR/USD is a currency pair involving the Euro and the US dollar. 
  • Metals Trading precious metals via CFDs refers to spot markets involving metals, such as gold and silver. Gold is often viewed as a ‘safe haven’ asset, as the price of gold is not impacted by movements experienced in other assets and, therefore, is not as volatile.
  • Energies Trading energies via CFDs involves tracking the price of energy from organisations focused on producing and supplying energy products — such as oil — to the rest of the economy.
  • Shares — Share CFDs track major stocks, such as Tesla, Apple, Meta, Microsoft and more. These CFDs give traders greater exposure to various stocks, improving profit prospects.
  • Cryptocurrency — Many traders are interested in the unusual nature of cryptocurrency but are often hesitant to invest due to its unpredictable nature. Cryptocurrency CFDs allow traders to dip their toes in the crypto market without having to hold the digital currency.
  • Indices Index CFDs refer to major global indices, such as the S&P/ASX 200 in Australia or the S&P 500 in the US. 

CFD trading strategies

Once you’ve determined the type of assets you want to trade via CFDs, the next step is to find your CFD trading strategy. There are many CFD trading strategies, which means traders must research to determine which trading method is right for them and aligns with their trading goals and skill level. CFD trading strategies can be short-term or long-term — let’s explore some common tactics below.

Short-term CFD trading strategies

Traders use short-term CFD trading strategies to make quick profits from the price movements of financial instruments such as stocks, currencies and commodities. Short-term CFD trading strategies offer more flexibility as traders can quickly react to market events and adjust their positions accordingly. 

CFD day trading 

As the name suggests, the day trading CFD strategy involves buying and selling assets within the same trading day to profit from intraday price movements. Day traders can use technical indicators such as the Average Directional Index (ADX) or the Stochastic Oscillator to identify short-term trends and momentum. 

Due to its demanding nature, CFD day trading strategies may be better suited to traders who can make and manage multiple trades.

Scalping 

Scalping is another short-term CFD strategy that involves making multiple trades quickly, usually within a day or even a few minutes. This strategy requires a high level of discipline and quick decision-making skills, ideal for experienced traders with a deep understanding of the market. 

Scalp trading positions don’t generate much profit individually. However, as scalpers try to engage in many daily trades, the high volume of trades is anticipated to increase profits during a trading session. Scalping is best used for assets with high volatility and tight spreads, so it may be worth learning more about forex trading.

Traders can use the Relative Strength Index (RSI) or stochastic indicator to identify scalping opportunities. 

Swing trading

Similar to scalping, swing trading involves holding positions for a few days or even a few weeks. This strategy is based on identifying swings in the market and taking advantage of them. Swing traders can use technical indicators such as the Moving Average Convergence Divergence (MACD) or the Bollinger Bands to identify trends and swings.

Long-term CFD trading strategies

There are many reasons why a trader may choose to engage with a long-term CFD trading strategy. From reduced time commitments to improved stability and lower transaction costs, with long-term trading strategies, traders can potentially generate greater profits by holding positions for longer periods. 

Buy and hold 

Simply put, the buy and hold strategy, or position trading, involves purchasing an asset to hold it for an extended period, like a few months or years. It’s believed that the asset will steadily increase in value. While the buy and hold method is a popular long-term strategy in traditional trading, the tactic can be adapted to CFD trading.

To implement the buy and hold strategy in CFD trading, a trader can look for assets with a strong fundamental outlook and potential for long-term growth using technical and fundamental analysis tools.

Diversification

As the name suggests, diversification involves spreading investments across multiple asset classes and markets to manage risk. These can include stocks of companies with strong financials, commodities with increasing demand, currencies of countries with improving economic indicators or trading in different markets, such as Asia, Europe and the United States.

Incorporating fundamental and technical analysis into your CFD trading strategy

No matter how long they’ve been trading, every trader will tell you that technical and fundamental analysis is integral to developing their trading strategy. Both can be useful in CFD trading, as they provide traders with valuable insights into market conditions and help them make more informed trading decisions. 

Fundamental analysis 

Fundamental analysis involves analysing economic and financial data and company reports to determine the value of an asset. This can include company financial statements and economic indicators, among others.

Economic data can refer to statistics that provide insight into the health of an economy. Meanwhile, company reports offer insight into a company’s financial performance, such as financial statements, earning reports and annual reports. 

Technical analysis 

Technical analysis uses charts and technical indicators to reference past price movements and trading volume to predict future movements.

Technical indicators are mathematical calculations based on price and volume data. Popular technical indicators include Moving Averages, Relative Strength Index (RSI) and Fibonacci retracements. Meanwhile, chart patterns are visual representations of price movement that indicate future trends, such as bar or line charts.

CFD trading tip — risk management 

As part of your CFD trading strategy, you will also need to ensure you have appropriate risk management in place to minimise losses and protect profits. Depending on your preferred trading method, this may involve implementing stop-loss orders, limiting leverage and diversifying your trading portfolio.

Stop-loss orders

As the market moves rapidly, sudden and unexpected movements can cost you if you don’t have corrective measures already in place. Market gaps, either trending upward or downward, can occur overnight or due to an unforeseen economic event. To prevent significant losses, stop-loss orders can be placed to automatically close a position when the market price hits a certain level.

Start small with leverage trading 

If you are new to leveraged CFD trading, it’s recommended that you start small and gradually increase your position over time until you fully understand the mechanics of this style of trading. 

VT Markets — trading made easy 

Whether you’re new to trading or a seasoned professional, having a reliable and dedicated platform that works for you is essential. VT Markets is a leading global multi-asset CFD broker, providing a superior trading environment for traders worldwide. 

We give you all the tools, resources and information you need to help you along your training journey, including the favoured trading platforms MetaTrader 4 and MetaTrader 5. With lightning-speed trade executions and spreads from 0.0 pips, VT Markets can support your trading goals. 

New to trading? Get comfortable with your CFD day trading strategies, test long-term methods by opening a VT Markets demo account to start trading with zero risk or kickstart your trading journey by opening a forex trading account. If you would like more information about our CFD brokerage service, contact us today.

FAQs

What are some of the common strategies when trading CFDs?

Common CFD strategies are either short or long-term, suitable for a wide range of traders. If you are interested in faster, more frequent trades, scalping and swing trading are popular strategies you can try. On the other hand, if you prefer to hold positions for a long period to maximise an asset’s value, the buy and hold technique may suit your trading needs.

Are some CFD trading strategies better than others?

There is no easy way to determine whether certain CFD strategies are ‘better’ than others, as no two traders have the same needs and goals. It will also come down to skill level, as beginner trades may be better suited to strategies that aren’t as intensive or require as much time commitment, compared to traders with more experience.

How do I start trading CFDs?

You can start trading CFDs by opening an account with VT Markets. We are a licensed and professional CFD broker with over 10 years of experience. We give traders access to free trading tools, analysis and top-tier market research, and have exposure to over 1,000 trading instruments.

CFDs vs. share dealing

Both CFDs and shares, or stocks, have advantages and disadvantages when it comes to trading. The two products are vastly different, so before deciding which is right for you, you’ll need to understand both the differences in the debate over CFDs vs. stocks, and also learn how the two are intertwined with and related to each other. 

In this article, we’ll break down the advantages both CFDs and shares have, their downsides and the difference between CFDs and share trading. 

CFDs vs. shares

The main difference between CFDs and shares is that CFDs – contracts for difference – are leveraged financial products, while shares are not. This one difference has huge ramifications for how each can be used within an investment portfolio, the knowledge you’ll need to trade them and the fundamental and technical analysis you’ll be required to perform in order to manage them successfully. 

Let’s get into more detail about each of these options for traders. 

What are shares?

Shares are probably familiar to most people, and even if you haven’t started trading or investing directly, you may be exposed to share trading through your superannuation fund. Shares are a unit of equity in a company or an ETF (exchange traded fund); owning them entitles you to certain voting rights and a share of that company’s profits.

The worth of your shares is derived from the value of the company on a stock exchange. This value, or share price, can move up and down, and you may also receive payouts, known as dividends, from your shares.

Leverage isn’t available when investing in shares; this means that your profits will likely be more modest, but also that your losses can not be more than your initial investment. If you invest £1,000 and the price of your shares drops to zero, the most you will lose is all £1,000, but will not exceed this amount.  

What are CFDs?

CFDs, or contracts for difference, do not represent ownership of a particular asset in the same way shares do. They are a financial instrument that works by allowing you to speculate on the movement of an asset or an index’s price. When trading CFDs, the trader does not take ownership of that underlying asset – any profit or loss is derived from the movement of the spot price itself. 

CFDs are often used for trading based on shorter term price movements, or to hedge your existing positions to mitigate against loss. Hedging is possible with CFDs, because they are a product which allows you to both go long or short (i.e. buy or sell), depending on how you think the market will move. 

As we’ve mentioned, CFDs are leveraged financial products. Trading with leverage means that only a percentage of the total trade’s value is needed to open a position. This is also known as the margin, and it is calculated by a company to produce a margin rate. 

If a CFD has a margin rate of 20%, for example, opening a £1,000 position would require a £200 deposit. Leveraged trading opens up the opportunity for larger profits, but also carries the risk of larger losses, because any outcome is based on the total value, not just your capital deposit.  

Learn the difference between CFDs and share trading

Another way of thinking about CFDs vs. shares is that trading shares is buying into a company’s equity, whereas CFDs are betting on an outcome of the market. This major difference means that there are lots of ways where trading shares or trading CFDs offer very different options: 

  • Leverage and cost of position — The fact that CFDs are leveraged means that they offer a lower barrier to entry; you only need to put up a margin in order to gain full market exposure. Shares require you to put down a larger cost of position by comparison; you’ll need to pay for the full amount that the stock is worth upfront.
     
  • Risk — Leverage amplifies everything: your potential profit and your risk. Shares can move to £0 value, but you will only ever stand to lose the value of your initial investment. If you open a position on a CFD and the market moves in the wrong way – against the position you were betting – you have the risk of absolute loss, with all of your CFD positions moving to zero. Your loss could also outstrip your initial outlay, just as your profits could be magnified if the market moves your way. 
  • Flexibility — CFDs are generally considered to offer more flexibility than shares, because you can bet on the success or failure of the market, you can go long or short and you can offset your trades relatively quickly and with less money required to gain full market exposure. This is why they’re a popular product for advanced traders looking to speculate on intraday market movements, a strategy known as day trading. 
  • Trading hours — CFDs can be traded outside of traditional market trading hours, however, there may be charges or extra fees associated with out-of-hours trading. With CFDs, you have the freedom to potentially trade 24 hours a day, while shares are normally constrained to local stock exchange trading hours.
  • Available markets — Both CFDs and shares have large available markets in which you can begin trading. Shares can be bought and sold on global markets, as can ETFs.

    CFDs are available in many international markets, and you can use CFD trading strategies to gain exposure to commodities, bonds, shares, indices, cryptocurrency, currency pairs, ETFs and more. 
  • Opportunities for short selling — If you’re looking to go short on a position, CFDs will likely be the right choice for you. Stocks do not offer short selling on all platforms, and the opportunities for shorting stocks are not as dramatic and therefore as attractive as with CFDs.
  • Privileges and dividends — When investing with the aim of receiving dividends and shareholder privileges, you’ll need to take ownership of stocks, rather than CFDs. CFDs are never connected to ownership of the underlying asset, whereas holding shares will pay out dividends and in some cases give you company voting rights.
  • Complexity — Shares are an abstract concept to a certain extent, but they are a tried and tested financial instrument with a fairly straightforward system of trading and of value fluctuation.

    CFDs, by comparison, are more complex by orders of magnitude. They also can quickly fluctuate in price, which increases the risk of suffering a rapid loss. Risk management strategies like stop orders and limit orders are helpful when controlling this level of complexity and protecting against loss. 
  • Diversity — Both stocks and CFDs are options for diversifying your portfolio, depending on how they are used. CFDs could be added to a portfolio to hedge your current positions, and for giving you full market exposure to an asset you may not already have open positions with.

    Because CFDs are traded purely on the movement of the market, it is more likely that a portfolio of exclusively CFDs would drop to absolute zero. Trading a combination of stocks and CFDs is one approach which would give you both long positions, short positions, opportunities for large profits and less volatility.  

What CFD markets are there?

CFDs are available to trade in a number of markets; soft commodities, energies, precious metals, bonds, stocks, indices and more. At VT Markets, we offer CFDs in markets around the world, including:

Because CFDs offer out-of-hours trading, it’s possible to open up an assertive suite of positions with share CFDs in an international market, even if it’s not within the same time zone as you. 

Now that you know which CFD markets are available, you’re ready to learn more about how to trade CFDs with our detailed guide. 

Trade your way with VT Markets

Whether you want to start trading stocks, CFDs or you’d like to diversify your portfolio with a range of both, VT Markets can help you. We’ve built our brokerage services around powerful trading platforms, MetaTrader 4 and MetaTrader 5, in order to give our clients an easy and flexible trading tool that’s transparent, competitively priced and completely reliable.   

Creating an account with us only takes a few minutes – simply fill out a few details and you’ll be ready to fund your account and start operating in a live trading environment. You’ll also gain access to state-of-the-art trading tools, daily market analysis, investor insights, guides to the fundamentals of trading, detailed economic calendars and so much more. 

If you’d like to practise opening and closing positions before you move into the markets, take advantage of our free demo account. When you sign up for a demo account, you’ll receive a free 90-day trial where you can get comfortable operating in a live trading environment, without any risk or obligation. Activate your live or demo account today, or talk to our team for all the help you need in building your trade portfolio. 

FAQs

Is it better to trade CFD or shares?

Both shares and CFDs have their own advantages and disadvantages that may or may not suit your goals and your style of trading.

Shares are considered to be a more straightforward financial instrument that are good for taking long positions, and grant you certain privileges as a shareholder in a company or ETF.

CFDs, on the other hand, are good for presenting short term opportunities, are easier to buy into with full market exposure and give you the flexibility to hedge your existing positions or go against a market if you so choose. 

Is trading CFDs better than investing?

Because CFDs require you to trade on the margin, it costs less upfront to get the same level of exposure to the equivalent value of shares. CFDs can also be used to offset other investments, and both CFD trades and share investments can be used together for a more diverse and protected portfolio.   

Are CFDs riskier than stocks?
Because CFDs are leveraged financial products, they amplify both your profit and loss margin. It’s important to have a good understanding of these complex financial instruments and how they work before you start trading with them. As with many financial products, their potential for high profits comes with an increased potential risk, and even small movements in the markets can be amplified as losses.

For this reason, risk management tools like stop loss orders and limit orders are useful when managing CFD positions.

Back To Top
server

Hello there 👋

How can I help you?

Chat with our team instantly

Live Chat

Start a live conversation through...

  • Telegram
    hold On hold
  • Coming Soon...

Hello there 👋

How can I help you?

telegram

Scan the QR code with your smartphone to start a chat with us, or click here.

Don’t have the Telegram App or Desktop installed? Use Web Telegram instead.

QR code