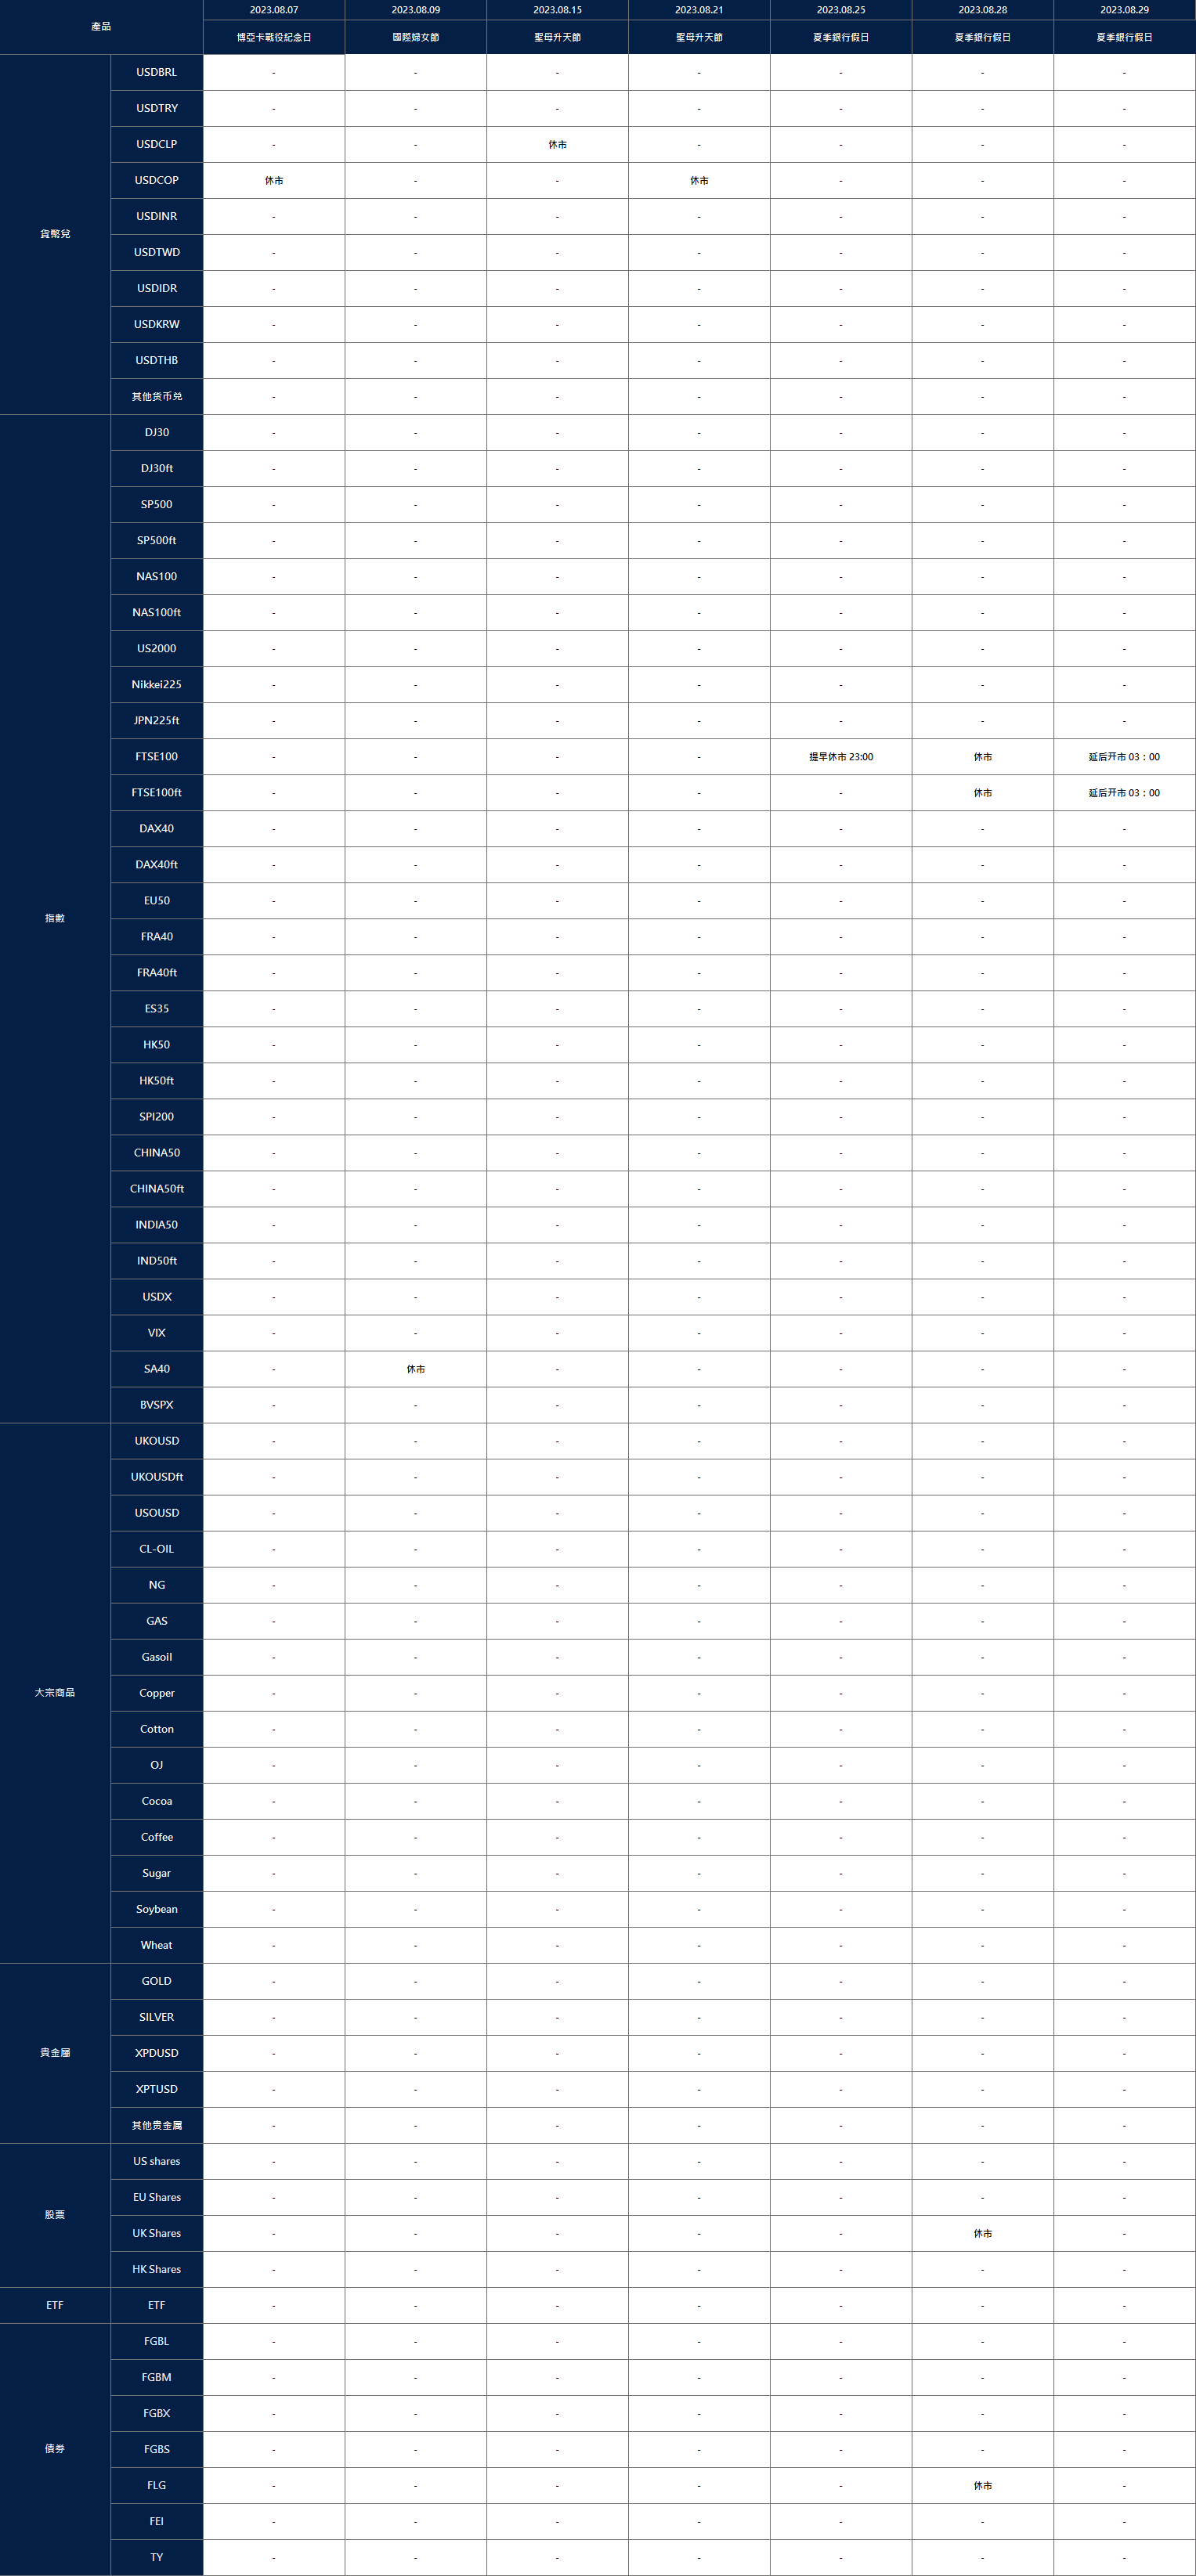
As part of our commitment to provide the most reliable service to our clients, there will be server maintenance this weekend.
Maintenance Hours :
5th of August 2023 (Saturday) 14:00 – 18:00 (GMT+3)
Please note that the following aspects might be affected during the maintenance:
1. The price quote and trading management will be temporarily disabled during the maintenance. You will not be able to open new positions, close open positions, or make any adjustments to the trades.
2. There might be a gap between the original price and the price after maintenance. The gaps between Pending Orders, Stop Loss and Take Profit will be filled at the market price once the maintenance is completed.
3. Please refer to MT4/MT5 for the latest update on the completion and market opening time. Our services will be back online once the maintenance is completed.
Thank you for your patience and understanding about this important initiative.
If you’d like more information, please don’t hesitate to contact [email protected].
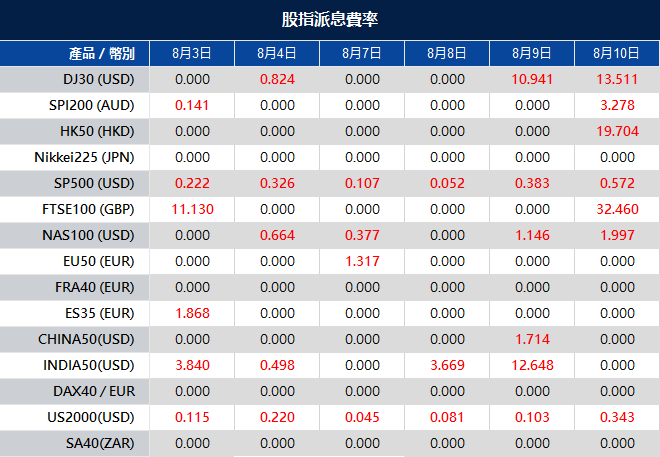
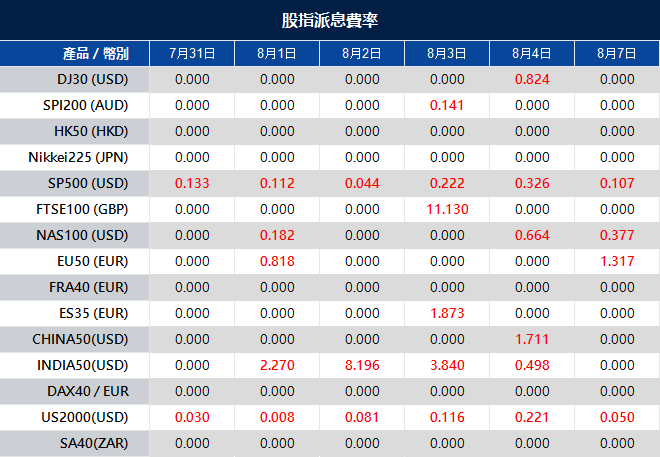
Please note that the dividends of the following products will be adjusted accordingly. Index dividends will be executed separately through a balance statement directly to your trading account, and the comment will be in the following format “Div & Product Name & Net Volume ”.
Please refer to the table below for more details:
The above data is for reference only, please refer to the MT4/MT5 software for specific data.
If you’d like more information, please don’t hesitate to contact [email protected].
A selloff gripped the stock market on Wednesday as the Nasdaq Composite suffered its worst day since February. The downturn was triggered by Fitch Ratings’ decision to downgrade the long-term rating for the U.S. from AAA to AA+, citing concerns about the expected fiscal deterioration over the next three years. This move fueled risk-off sentiment, causing the tech-heavy index to plummet by 2.17% and the S&P 500 to retreat by 1.38%. Leading the declines were technology stocks, including major players like Amazon, Alphabet, and Microsoft, which saw their share prices drop by more than 2% each. The 10-year Treasury yield also surged to its highest level since November, further exacerbating the sell-off.
Despite the rating downgrade, some experts viewed the market correction as a natural part of the market cycle after an extended period of growth. The economy demonstrated resilience, and conditions were notably different compared to the last time the U.S. experienced a rating downgrade. Earnings season proved robust, with approximately 82% of S&P 500 companies reporting positive surprises. While the downgrade did impact investor sentiment, many remained optimistic about the overall economic outlook and market trends, considering the selloff as a constructive rotation rather than a sign of an imminent market downturn.
On Wednesday, the overall stock market experienced a decline of 1.38%. Among the sectors, Consumer Staples showed a slight increase of 0.25%, while Health Care gained 0.06%. On the other hand, the Communication Services sector suffered the most significant drop of 2.07%, closely followed by Information Technology, which declined by 2.59%. Other sectors that experienced losses were Energy (-1.34%), Materials (-1.23%), Consumer Discretionary (-1.84%), Industrials (-1.08%), Financials (-0.89%), Real Estate (-0.44%), and Utilities (-0.01%).
Major Pair Movement
The dollar index surged by 0.5% as a safe-haven response to Fitch’s U.S. credit downgrade and positive ADP data boosted investor confidence. Despite stock market losses leading to a decline in Treasury yields, traders awaited upcoming ISM non-manufacturing and employment reports, considered better indicators of economic growth and the labor market. The chances of further Fed rate hikes remained low, and the rebound in Treasury yields was driven by higher longer-term tenors due to the Treasury’s unexpected borrowing plans. Although Fitch’s credit downgrade and increased borrowing estimates created concerns, portfolio managers were less likely to exit Treasury holdings due to the continued backing of the U.S. government.
EUR/USD experienced a 0.34% decline, approaching the uptrend line from May, reflecting worries about economic weaknesses in Germany and China versus hopes for a soft landing in the U.S. Market expectations showed limited possibilities of further ECB hikes and a higher peak for the Fed’s rates. USD/JPY initially dropped on haven yen gains following the Fitch news but later recovered as JGB yields rose despite BoJ buying. Sterling faced losses earlier but recovered slightly after a poll showing lower UK public inflation expectations. A 25bp hike was favored over a 50bp one in the upcoming BoE meeting due to higher inflation levels in the UK compared to the ECB and the Fed. The Australian dollar and yuan both depreciated against the dollar due to risk-off sentiment and uncertainty about Chinese economic stimulus plans.
Looking ahead, investors were awaiting several key economic reports on Thursday, including Challenger layoffs, jobless claims, ULC, and factory orders, as a prelude to Friday’s jobs report. These data points were expected to provide further insights into the state of the economy and may impact market sentiment and the performance of various currencies.
Picks of the Day Analysis
EUR/USD (4 Hours)
EUR/USD Breaks Key Support Levels Amid Strong US Dollar Performance and Risk Aversion
The EUR/USD pair experienced a significant drop below key support levels, reaching 1.0919, the lowest since July 7, due to the US dollar’s robust performance and risk aversion triggered by Fitch’s downgrade of the US sovereign rating. Despite initial gains after the announcement, the pair resumed its downward trend as the US dollar strengthened, breaking below 1.0960. The US Dollar Index rose to a four-week high above 102.50 following positive labor market data, with private employment increasing by 324K according to ADP. More US employment data is expected, making it crucial for market sentiment. On the horizon, Germany’s trade balance data, service PMIs, Eurostat’s Producer Price Index, and the Bank of England’s decision will be critical for the Euro’s performance.
According to technical analysis, the EUR/USD moved slightly lower on Wednesday and reached the lower band of the Bollinger Bands. Currently, the price is slightly above the lower band of the Bollinger Bands. The Relative Strength Index (RSI) currently stands at 34, suggesting that the EUR/USD is starting to move lower, indicating a bearish mode.
Resistance: 1.1038, 1.1121
Support: 1.0915, 1.0839
XAU/USD (4 Hours)
XAU/USD Faces Volatility Amid Mixed Market Sentiment and Encouraging US Data
The XAU/USD pair experienced volatility as market sentiment fluctuated and encouraging US data supported the US Dollar. Peaking at $1,954.81 per troy ounce, the pair currently trades around $1,935. The dismal market mood, driven by Fitch’s US debt rating downgrade and debt ceiling turmoil, contributed to risk-off sentiment, leading to red global indexes and a rally in government bond yields. However, the US Dollar recovered its poise after the release of positive ADP Employment Change data, showing the private sector added 324K new job positions in July, surpassing market expectations. As the labor market remains tight, speculation grows about further monetary tightening by the Federal Reserve, impacting the XAU/USD pair’s performance amid mixed outlooks and cautious optimism.
According to technical analysis, the XAU/USD fell on Wednesday and reached the lower band of the Bollinger Bands. Currently, the price is moving slightly above the lower band of the Bollinger Bands. The Relative Strength Index (RSI) currently stands at 36, which suggests that the XAU/USD pair is slightly bearish.
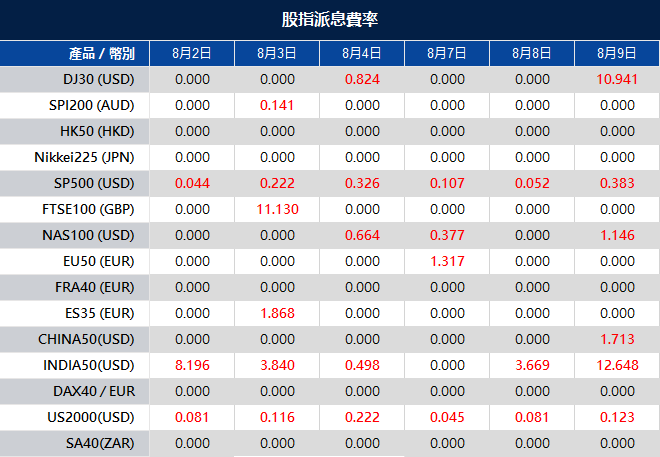
Please note that the dividends of the following products will be adjusted accordingly. Index dividends will be executed separately through a balance statement directly to your trading account, and the comment will be in the following format “Div & Product Name & Net Volume ”.
Please refer to the table below for more details:
The above data is for reference only, please refer to the MT4/MT5 software for specific data.
If you’d like more information, please don’t hesitate to contact [email protected].
Arguably more than any other sector, the world of forex trading has consistently been shaped by the onset of new technology. When the concept of trading assets in a public setting first came about, traders literally used to call out (yes, verbally!) the assets they intended to trade. However, the trading of currencies has evolved dramatically over time — from the days of trading via telegraph and phone, we have now progressed to the age of the internet and artificial intelligence (AI).
Within this new reality, an increasing number of trading platforms are embracing this cutting-edge technology by incorporating AI algorithms to automate specific functions. These AI-driven systems have revolutionised the forex trading landscape, enabling traders to access a wealth of data and analyses at their fingertips.
For those still coming to terms with this transition, here’s a quick guide to the upsides and downsides of AI in forex and what it means for the future:
Benefits of AI in Forex Trading
AI is sometimes viewed with some cynicism as a subpar replacement for human ingenuity. However, in fields like trading, where precision and speed of calculation plays a crucial role, AI can prove beneficial in a variety of ways.
1. Improved Market Analysis
With many companies fully investing in AI, several firms now offer trading platform solutions to automate the nitty-gritty technical analysis that traders used to perform manually. Today, numerous providers offer trading platforms equipped with machine learning and deep learning capabilities. These tools enable AI to utilise neural networks for evaluating a trader’s tendencies and then replicating and streamlining those decisions using algorithms.
Additionally, some AI app providers offer predictive programming tools that allow traders to input statistics and assess the viability of different algorithmic decisions. Utilising AI for technical analysis in these ways relieves the trader from performing laborious tasks, allowing them to focus on developing strategies or conducting more fundamental analysis of global market conditions.
2. Automated Trading Execution
One of the most prominent ways AI can benefit forex traders is through the utilisation of trading algorithms. Essentially, a trading algorithm is a set of rules that can form a foundation for a trading strategy. For example, you can have an algorithm designed around specific cues for when to sell or buy. Alternatively, you could create an algorithm that incorporates specific data sets from particular time periods, using that data as a reference for your trading decisions.
So, how does AI come into play here? AI trading bots provide the simplest way to execute trades based on specific algorithms. All you need to do is grant the trading bot access to your trading platform’s API, instruct it on the algorithms you want it to follow or perform, and it can handle the rest for you. This approach is considerably easier and smoother than coding your own scripts, and less time-consuming than conducting the trades manually.
3. Enhanced Risk Management
Aligned with automated trading, another significant benefit AI offers in forex trading is the creation of algorithms that help you to manage risk.
Minimising the risk of loss is a priority for any investor. Unfortunately, all traders can get caught up in emotions from time to time, leading them to make riskier trades than would normally be wise.
This is where AI comes to the rescue. You can include specific instructions in your AI setup to guide it in entering and exiting trades at specific points. In doing so, the use of AI can help you stick to a desired risk tolerance strategy with greater discipline, preventing you from making poorly thought-out trades that might be driven by emotion.
Challenges and Limitations of AI in Forex Trading
With all the benefits of AI in forex trading, it remains a relatively new technology and, therefore, imperfect tool. As a trader, you should be aware that AI is not a magic wand capable of doing everything, as there are several limitations to consider.
Firstly, the effectiveness of AI algorithms and tools heavily relies on the quality of their data sets. Despite AI’s capabilities with data, inaccurate or low-quality data can render any AI-based predictions unreliable. To avoid this, ensure your data set is clean and updated with current trends.
Secondly, a system must be in place for your AI tool to continually receive new data to adapt to market changes effectively. Strategies built around short-term price movements require a constant supply of new data that must be accurate and delivered with minimal delay.
Lastly, while one of AI’s strengths is its ability to eliminate the potential drawbacks of emotionally driven trading, its purely mechanical processes can sometimes diminish the value of human expertise. When trading forex with AI, it’s essential to maintain involvement in the trading process and analyse all data through your own eyes. After all, maths and engineering—great as they are—are unlikely to replace human intuition anytime soon.
The Future of Forex Trading With AI
With all this in mind, the question remains: What lies ahead? How will AI evolve, and how will these advancements impact forex trading?
While it’s challenging to predict precisely how AI will develop, it’s a safe bet that AI will continue to play a significant role in trading forex for years to come. A study by JP Morgan in 2020 revealed that over 60% of all forex trades that yielded at least US$10 million employed forms of AI. Leading investment banks earned about US$2 billion from algorithmic trading, and 10% of hedge funds in the US and Europe used algorithmic trading to handle over 80% of their total value.
These statistics are expected to climb even higher as AI becomes more refined and as more individuals pursue trading as a viable career or side venture. With the rising demand for AI-powered tools, the market for AI trading tools is likely to improve further, with some predictions estimating the total volume of algorithmic trading to reach US$19 billion in 2024.
In any case, it’s evident that AI is here to stay. As a trader, it’s essential to stay ahead of the game and consider leveraging all the possibilities they provide for your own trading needs. For the unprepared, the road forward might seem incredibly overwhelming. For those familiar with the power of AI, however, the world of tomorrow is filled with opportunity for the taking.
Test out your best AI-based trading strategies completely risk-free. Click here to create your VT Markets demo account and get $100,000 in free credits now.
Starting in August, the S&P 500 experienced a 0.27% decline, with the Nasdaq Composite also dropping by 0.43%, while the Dow Jones Industrial Average gained 0.2%. Several companies reported mixed results, leading to varied stock movements. Pharmaceutical giant Merck pulled back 1.3% despite exceeding revenue expectations, while Caterpillar’s strong results boosted shares by 8.9%. On the other hand, Pfizer fell 1.2% due to declining Covid product sales, and Uber slid 5.7% on mixed earnings. JetBlue also tumbled 8.3% after reducing its guidance due to slowing domestic travel.
Market analysts attributed these fluctuations to overbought conditions, given the market’s strong performance this year and solid quarterly earnings. Despite over 160 S&P 500 constituents reporting second-quarter results, with 82% exceeding earnings expectations, analysts anticipate a 7.1% earnings decline from a year ago and a third consecutive quarter of falling profits. Economic indicators, including job openings data and manufacturing data showing a continued contraction, were also closely assessed by Wall Street.
On Tuesday, all sectors experienced a 0.27% decline, except for Industrials, which rose by 0.32%, and Information Technology, which saw a slight increase of 0.09%. Financials and Real Estate both dipped by 0.03% and 0.13%, respectively. Communication Services and Materials experienced greater losses, with declines of 0.29% and 0.44% respectively. The Energy sector suffered a 0.46% decrease, while both Consumer Staples and Health Care declined by 0.51%. The Consumer Discretionary sector faced the most significant setback, with a notable 1.15% decline, and Utilities also experienced a considerable 1.26% drop.
Major Pair Movement
EUR/USD is trading lower due to influences from China’s yuan and U.S. interest rates. The yuan’s recent appreciation against the dollar stalled, raising concerns about China’s economy and leading to yuan selling. Eurozone data also indicates a slowdown, potentially resulting in a less hawkish ECB stance and weighing on EUR/USD rates.
U.S. yields remain elevated, and investors expect the Fed to keep rates higher for longer, increasing the dollar’s yield advantage over the euro. Key U.S. data risks are in focus, and upbeat data could further support U.S. rates and the dollar. USD/CAD eyes cloud base support at 1.3311 amid a gloomy global growth outlook, while GBP/USD faces relentless bearish pressure as the BoE’s more-hawkish rate outlook diminishes. USD/JPY is on track to revisit June’s 2023 peak with support at 142. Resilient U.S. data and a soft landing narrative are expected to strengthen the USD.
Picks of the Day Analysis
EUR/USD (4 Hours)
EUR/USD Holds Above Support Amid Mixed Data and Resilient Dollar
The EUR/USD dropped towards last week’s lows but rebounded during the American session, staying above the crucial support area of 1.0950. The US Dollar remains resilient, but its momentum against the Euro appears to be fading. The Final Eurozone PMI showed little change, while Germany’s unemployment rate fell to 5.6% in July. However, the interest rate market indicates low odds of another rate hike from the ECB. The Greenback lost strength against the Euro following mixed US data, with the JOLTS Job Openings report and ISM Manufacturing PMI coming in below expectations. Despite the numbers, US yields saw modest increases. The market focus now shifts to upcoming US employment data, including the ADP report and Nonfarm Payrolls on Friday.
According to technical analysis, the EUR/USD moved slightly higher on Tuesday and reached the middle band of the Bollinger Bands. Currently, the price is still at the middle band of the Bollinger Bands, indicating that the EUR/USD is in a consolidating mode. The Relative Strength Index (RSI) currently stands at 43, suggesting that the EUR/USD is starting to move back to a neutral stance.
Resistance: 1.1038, 1.1121
Support: 1.0915, 1.0839
XAU/USD (4 Hours)
XAU/USD Rebounds on US Credit Rate Cut Amid Economic Concerns
Gold has rebounded to around $1,950 in the Asian session after justifying the United States government’s rate cut by Fitch Ratings. The metal pared previous losses, but technical indicators suggest a bearish trend in the near term. The market sentiment turned negative due to disappointing earnings from big names, leading to a surge in demand for the safe-haven US Dollar. Additionally, US data disappointed, with manufacturing PMI missing estimates. The situation remains uncertain, and investors are closely watching employment clues for further market direction.
According to technical analysis, the XAU/USD fell on Tuesday and is now approaching the lower band of the Bollinger Bands. Currently, the price is moving in the middle between the lower and middle bands of the Bollinger Bands, indicating that there is still potential for Gold to move lower and reach the lower band. The Relative Strength Index (RSI) currently stands at 45, which suggests that the XAU/USD pair is in a neutral stance but slightly bearish.
Please note that the dividends of the following products will be adjusted accordingly. Index dividends will be executed separately through a balance statement directly to your trading account, and the comment will be in the following format “Div & Product Name & Net Volume ”.
Please refer to the table below for more details:
The above data is for reference only, please refer to the MT4/MT5 software for specific data.
If you’d like more information, please don’t hesitate to contact [email protected].
Stocks on Wall Street experienced a modest rise on Monday, kickstarting a busy earnings week and concluding a winning month. The Dow Jones Industrial Average climbed 0.28% to close at 35,559.53, while the S&P 500 and Nasdaq Composite registered slight gains of 0.15% and 0.21%, respectively. July’s positive performance was notable, with the S&P 500 recording its fifth consecutive positive month for the first time since August 2021, and the Nasdaq Composite marking its fifth straight winning month since April 2021. This bullish trend was attributed to investors’ growing optimism about a soft landing scenario, supported by strong economic data indicating ongoing labor market strength and cooling inflation. Better-than-expected second-quarter earnings also contributed to the market’s rally throughout the month.
Looking ahead, market participants are closely monitoring the earnings reports of tech giants Amazon and Apple, as their performance could significantly impact the market’s trajectory. Positive guidance from these companies may propel the bull market further and sustain momentum into the fall. Alongside earnings, investor focus remains on the upcoming jobs report, with economists projecting the U.S. economy to have added 200,000 jobs in July, following a 209,000 increase in nonfarm payrolls in June. These factors, along with the Federal Reserve’s recent rate hike, will continue to influence investors’ decisions and shape the market’s direction as the earnings season nears its end.
On Monday, the overall stock market showed a modest increase of 0.15% across all sectors. Energy stocks saw the most significant gain, surging by 2.00%, followed by real estate with a rise of 0.70%. The consumer discretionary and materials sectors also performed well, each recording gains of 0.56% and 0.52%, respectively. Financials and industrials showed moderate growth with increases of 0.44% and 0.23%, while information technology and utilities experienced more modest gains at 0.13% and 0.03%, respectively. On the other hand, communication services and consumer staples sectors experienced slight declines, both decreasing by -0.03% and -0.46%, respectively. The health care sector saw the most significant decrease, falling by -0.79%.
Major Pair Movement
On Monday, the dollar slightly declined against the euro and sterling, as these currencies rebounded from July lows following below-forecast U.S. core PCE and ECI data, which suggested a lower likelihood of further rate hikes by the Federal Reserve. Despite Chair Jerome Powell’s emphasis on data dependence, rate cuts are deemed unlikely this year. The yen weakened for a second day against most other currencies, driven by yen longs taken before the Bank of Japan’s (BoJ) meeting, where the policy shift underwhelmed expectations. The BoJ’s purchase of 10-year Japanese Government Bonds (JGBs) at 60bps, closer to its prior 50bp cap than the new hard cap at 100bps, led to renewed quantitative easing and favored the yen as a funding currency.
In the foreign exchange market, USD/JPY, EUR/JPY, GBP/JPY, and AUD/JPY all rose, while USD/CNH fell slightly as investors remained cautious about China’s renewed growth prospects. Bond yields, including Bunds, gilts, and Treasury yields, initially rose due to JGB yields’ post-BoJ meeting surge, but they later drifted lower as the month-end and key U.S. data approached.
Picks of the Day Analysis
EUR/USD (4 Hours)
EUR/USD Pulls Back Below 1.1000 Despite Eurozone’s Return to Growth
On Monday, the EUR/USD currency pair failed to maintain its gains and retreated, falling below the key level of 1.1000. The Euro initially gained momentum after Eurozone economic data revealed growth in the second quarter, but it couldn’t reclaim the 20-day Simple Moving Average (SMA) and eventually weakened. Eurostat reported that the GDP grew by 0.3% in Q2, surpassing market consensus expectations of 0.2%, while headline inflation decreased from 5.5% to 5.3% YoY in line with predictions. However, the core inflation rate remained higher than expected at 5.5%. In contrast, German retail sales disappointed, showing a 0.8% drop in June against a forecasted 0.2% decline.
The mixed data released for the European Central Bank (ECB) implies no significant shifts in monetary policy, as inflation slowed while the core rate remained elevated, and GDP experienced marginal growth. Market pricing currently suggests that the likelihood of another rate hike during the September meeting is below 40%. In the US, the Dollar displayed a mixed performance on Monday, rising against the Euro, Pound, and Yen, but weakening against the Australian Dollar, Canadian Dollar, and New Zealand Dollar, possibly indicating some risk appetite and a rebound in commodity prices. This week, market participants await a series of labor market data releases, including JOLTS Job Openings, ADP, Jobless Claims, and Nonfarm Payrolls, which could influence the currency’s movements.
According to technical analysis, the EUR/USD falls on Monday and reached the middle band of the Bollinger Bands. Currently, the price is moving just below the middle band of the Bollinger Bands indicating there’s a potential lower movement to the lower band. The Relative Strength Index (RSI) currently stands at 39, indicating that the EUR/USD is starting to enter the bearish moment.
Resistance: 1.1038, 1.1121
Support: 1.0915, 1.0839
XAU/USD (4 Hours)
XAU/USD Gains Momentum as Optimism Weakens US Dollar Amid Easing Inflation Signs
At the beginning of the week, XAU/USD, the gold-to-dollar exchange rate, rose higher as investor optimism led to a shift away from the US Dollar. The precious metal traded around $1,972, recovering most of its losses inspired by the European Central Bank (ECB), and further gained momentum with Wall Street’s opening as stocks maintained a positive tone from the previous week, supported by signs of easing global inflation.
Following the release of German and US inflation-related data on Friday, the Eurozone reported a decline of 0.1% MoM in July’s Harmonized Index of Consumer Prices (HICP) according to preliminary estimates, with the annual figure easing to 5.3% from the previous 5.5%. The upbeat market sentiment exerted pressure on the US Dollar, causing it to lose ground unevenly against all major rivals, with commodity-linked currencies performing the best and European counterparts performing the worst. As market participants await American employment-related figures, the focus remains on upcoming reports such as June JOLTS Job Openings, the ADP survey on private job creation, and the July Nonfarm Payrolls report (NFP) expected to show 200K new jobs created in the month.
According to technical analysis, the XAU/USD rises slightly on Monday and moves above the middle band of the Bollinger Bands. Currently, the price is slightly above the middle band, indicating that there is still potential for Gold to move even higher. The Relative Strength Index (RSI) currently stands at 50, which indicates that the XAU/USD pair is moving back to the neutral stance.
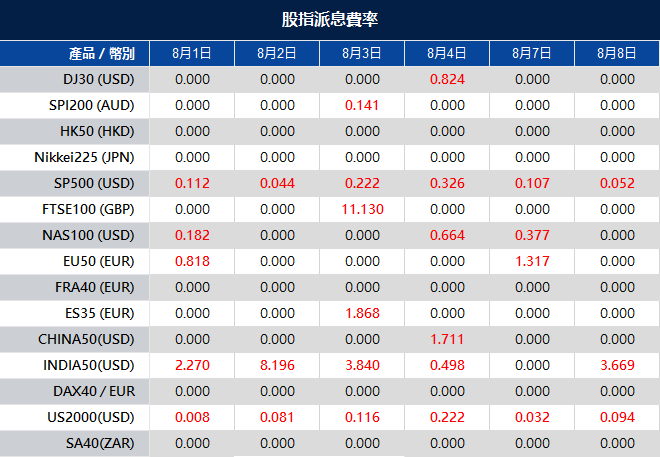
Please note that the dividends of the following products will be adjusted accordingly. Index dividends will be executed separately through a balance statement directly to your trading account, and the comment will be in the following format “Div & Product Name & Net Volume ”.
Please refer to the table below for more details:
The above data is for reference only, please refer to the MT4/MT5 software for specific data.
If you’d like more information, please don’t hesitate to contact [email protected].