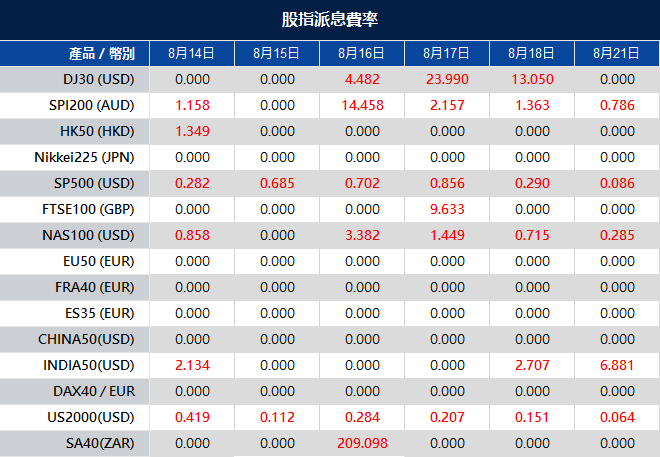
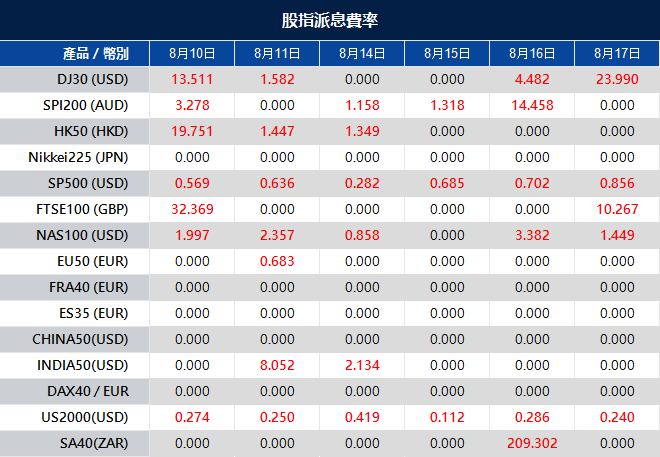
Please note that the dividends of the following products will be adjusted accordingly. Index dividends will be executed separately through a balance statement directly to your trading account, and the comment will be in the following format “Div & Product Name & Net Volume ”.
Please refer to the table below for more details:
The above data is for reference only, please refer to the MT4/MT5 software for specific data.
If you’d like more information, please don’t hesitate to contact [email protected].
Important economic events will have a significant impact on the forex market this week. Keep an eye out for the Reserve Bank of New Zealand’s (RBNZ) Rate Statement and the US data for retail sales. This information could greatly influence the markets, so it’s crucial for traders to be cautious and stay on top of the latest developments for a successful week of trading.
Here are some notable highlights for the week:
Australia Wage Price Index (15 August 2023)
The seasonally adjusted Wage Price Index in Australia showed that wages increased by 3.7% year-on-year in Q1 2023, following a year-on-year growth of 3.4% in Q4 2022.
Data for Q2 2023 is scheduled for release on 15 August, with analysts anticipating another increase of 3.8%.
Canada Consumer Price Index (15 August 2023)
Canada’s Consumer Price Index (CPI) increased by 0.1% in June 2023 compared to the previous month.
Analysts anticipate a 0.2% increase in the figures for July, which are set to be released on 15 August.
US Retail Sales (15 August 2023)
Retail sales in the US rose by 0.2% month-on-month in June 2023, following a 0.5% increase in May.
Analysts expect a 0.3% growth in the figures for July, scheduled for release on 15 August.
UK Consumer Price Index (16 August 2023)
Consumer price inflation in the UK dropped to 7.9% in June 2023, marking the lowest level since March 2022.
The upcoming CPI figures are expected to show a further decline to 7.4%.
Reserve Bank of New Zealand Rate Statement (16 August 2023)
During its July meeting, the Reserve Bank of New Zealand maintained the official cash rate (OCR) at 5.5%.
Analysts predict that the RBNZ will keep the OCR unchanged at 5.5% following its upcoming meeting on 16 August.
Federal Funds Rate (17 August 2023)
The Federal Reserve raised the target range for the federal funds rate by 25 bps to 5.25–5.5%, in line with market expectations.
Additionally, the central bank also resumed its tightening campaign after a pause in June.
Employment in Australia (17 August 2023)
Employment in Australia surged by 32,600 in June 2023. Meanwhile, the unemployment rate stood at 3.5%, remaining unchanged from May. It continues to hover close to the 50-year lows reached in October 2022.
Analysts anticipate that employment figures for July 2023 will show an increase of 25,100, with the data scheduled for release on 17 August.
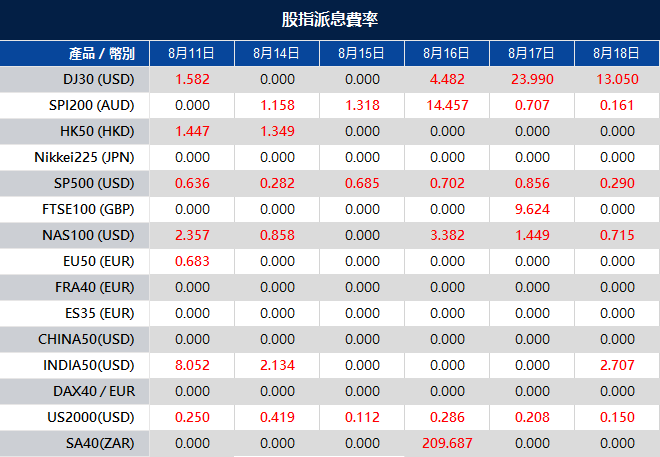
Please note that the dividends of the following products will be adjusted accordingly. Index dividends will be executed separately through a balance statement directly to your trading account, and the comment will be in the following format “Div & Product Name & Net Volume ”.
Please refer to the table below for more details:
The above data is for reference only, please refer to the MT4/MT5 software for specific data.
If you’d like more information, please don’t hesitate to contact [email protected].
Chess and trading might be two vastly different activities, but a surprising number of similarities lie beneath the surface. Not only do they provide thrilling mental stimulation within a fast-paced environment, but they also demand the same vital skills essential for success: pattern recognition, visual analysis, and lightning-quick decision-making. Just like top chess players, the most skilled traders possess the remarkable ability to analyse situations on the fly and make sound decisions, giving them a strategic advantage in the market.
When seeking an exemplary role model for trading, it’s hence difficult to look beyond Magnus Carlsen, the world’s current number-one-ranked chess grandmaster. His multiple achievements—five World Chess Championships, four World Rapid Chess Championships, and six World Blitz Chess Championships— solidify his position as the best player in modern times, perhaps even of all time.
Taking inspiration from the world’s leading chess player, here are four key insights that traders can use to their own advantage when trying to beat the markets:
1. Unlock Success with Thorough Preparation
Parse through any of Magnus Carlsen’s interviews and you’ll see just how much he sincerely loves chess. Ask him to name any historical (and even fictional) games and he can effortlessly recall every move. Some might attribute these incredible skills simply to the natural gifts of a brilliant mind, but to do so would be to diminish the sheer work ethic that goes into honing Magnus’ genius. More than anything, Magnus is a student of the game, and his passion for learning more is what drives him to memorise plays and compete at the highest level.
Trading requires a similar level of preparation. While it’s probably unrealistic to expect the average trader to memorise price fluctuations and graphs from years and decades past, there’s still significant value to be had in doing fundamental research, staying on top of trends, and performing other forms of due diligence.
Much like Carlsen, many of the world’s most successful traders attribute their achievements to their genuine love for learning. They soak up knowledge like sponges and apply well-researched insights in their analyses. Embracing a similar approach—prioritising continuous learning and harnessing the wisdom of past trends—can immensely benefit any trader, regardless of knowledge or experience.
2. Outmanoeuvre the Odds with Calm, Strategic Thinking
We cannot discuss Magnus Carlsen without delving into his strategic and tactical brilliance. A prime example of this was his remarkable victory in the finals of the Clutch Chess International in 2020. Carlsen managed to bounce back after being defeated four times in a row by Fabiano Caruana. Instead of simply defending his threatened pieces, Carlsen decided to take a daring position with his rook, setting off a sequence that eventually led Caruana to throw in the towel.
It’s plays like these that really demonstrate the brilliance of Magnus Carlsen. When the chips are down and the stakes run high, he remains composed and exploits opponents’ blunders, relying on reason and a cool head to persevere amid adversity.
Trading, with all its parallels to chess, also bodes well for those with a strategic and analytical mindset. Facing the uncertain ebb and flow of the markets, it is the trader who can keep a cool head who is most likely to capitalise on hidden opportunities and avoid the emotionally driven decision-making that so often leads to ruin.
3. Master the Game of Risk
Strategic thinking aside, trading and chess also share a common emphasis on risk management. However, there is no one-size-fits-all approach to handling risk in either domain. Some traders might find themselves aligned with the daring spirit of Mikhail Tal or Wesley So, both known for their bold sacrifices and swashbuckling approach on the chessboard. On the other hand, more conservative traders might find comfort in the cautious approach of the late Tigran Petrosian, notably reserved in his approach to positional play.
Alternatively, some traders might also find a middle ground similar to Magnus Carlsen, whose approach to chess blends both styles to spectacular effect. While Magnus generally leans towards a patient strategy, he is not averse to taking calculated risks when the situation demands it. For instance, in a 2022 game against grandmaster Sam Shankland, Carlsen employed the rarely-played Von Hennig-Schara gambit, catching Shankland off guard and setting the tone for the rest of the match. However, Magnus has also experienced the consequences of being too risky, as seen in his 2016 series against Sergey Karjakin when he turned down a draw, leading to a loss. This experience prompted him to become more risk-averse, opting for a draw in the next game.
As a trader, it is essential to follow Magnus’s lead and understand your own risk tolerance. Are you comfortable making bold moves, and do you have the resources to manage potential risks? Conversely, are you hindering your progress by being too conservative in your trading approach? These are questions only you can answer, but Magnus’ own approach to chess is a valuable reminder that a flexible approach to risk can be immensely rewarding as long as it is managed prudently.
4. Keep Your Emotions in Check
Magnus Carlsen’s long-standing rivalry with the world’s second-ranked grandmaster, Hikaru Nakamura, is undeniably one of the most captivating in chess. However, it is admittedly not much of a rivalry in terms of competition. Carlsen has consistently dominated Nakamura in their head-to-head clashes, suffering only one loss in Classical chess. Moreover, he boasts an impressive record of 87 wins to Nakamura’s 37 (with 114 draws) in exhibition games.
While Carlsen’s victories over Nakamura undoubtedly highlight his exceptional chess technique, there is also an evident psychological advantage that Carlsen holds over the notably emotional Nakamura. Multiple instances in the past have seen Nakamura cracking under intense pressure while facing Carlsen. In contrast, Carlsen has earned a reputation for being cool and calculating, even exploring a career as a poker player in recent years.
Of course, emotions are a natural part of being human, and we cannot always control their presence. But when it comes to both trading and chess, emotions can often be detrimental. As Nakamura and Carlsen have demonstrated, emotions can interfere with making sound analytical decisions, while composure can be the key to navigating stressful situations.
In the unpredictable arena of the financial markets, traders will undoubtedly encounter intense emotional pressures from time to time. Should you find yourself in such a situation, consider drawing inspiration from Magnus Carlsen, floating above emotion to make room for your game-winning move.
Checkmate the markets with your trading skills. Click here to open your account and begin your quest for financial victory.
The Dow Jones Industrial Average saw a modest increase on Thursday, propelled by a surge in Disney’s stock following their post-earnings announcement of a price hike for ad-free Disney+ subscriptions. The market was also buoyed by a key inflation report that revealed slightly lower year-over-year inflation growth than economists had predicted. The blue-chip index gained 52.79 points, or 0.15%, closing at 35,176.15. While all three major indexes had initially climbed more than 1% earlier in the day, the Nasdaq Composite and S&P 500 are projected to conclude the week with slight declines of 1.2% and 0.2%, respectively, while the Dow is set for a 0.3% advance.
The inflation report for July showed an annual consumer price increase of 3.2%, slightly under the 3.3% consensus projected by economists polled by Dow Jones. Despite this moderate figure, the core July CPI reading, which excludes food and energy, marked a substantial increase of 4.7% on an annual basis, well above the Federal Reserve’s targeted 2% inflation rate. Additionally, Disney’s positive earnings announcement drove a 4.9% surge in their stock, making them the top performer in the Dow. Other positive contributors included Wynn Resorts, which advanced 2.6% due to better-than-expected earnings. As earnings season continued, more than 90% of S&P 500 companies had reported their quarterly earnings, with around 80% surpassing Wall Street expectations, according to FactSet data.
On Thursday, the overall market saw a slight uptick of 0.03%. Among the sectors, Communication Services led the gains with a notable increase of 0.43%, followed by Consumer Discretionary at 0.28%, and Materials at 0.09%. Energy, Financials, and Information Technology all saw minor gains of 0.08% and 0.01%, respectively.
However, Health Care experienced a slight decline of -0.04%, while Consumer Staples, Industrials, Real Estate, and Utilities encountered more notable drops, with decreases of -0.20%, -0.28%, -0.31%, and -0.32% respectively.
Major Pair Movement
During the NorAm session, the dollar index initially weakened due to a near-forecast U.S. CPI reading causing a brief drop in Treasury yields, almost touching last Friday’s lows. However, the dollar swiftly rebounded, erasing its losses along with rising Treasury yields. The expected and confirmed 0.2% monthly rise in both all-items and core CPI led to an initial decline in Treasury yields and a temporary weakening of the dollar against the euro and other currencies supported by risk-on sentiment. But the dollar regained strength, propelled by hawkish comments from San Francisco Federal Reserve Bank President Mary Daly and driven by a de-risking event after Treasury yields surged post a lackluster 30-year Treasury auction. This shift favored the dollar, causing EUR/USD to lose its earlier gains, while USD/JPY bounced back from intraday lows toward 2023’s highs.
Meanwhile, sterling’s early gains turned into a 0.3% loss as risk sentiment waned, compounded by concerns about the BoE’s potential economic slowdown following its final rate hikes. EUR/JPY approached a 15-year high due to the BoJ’s unchanged policy rate and steady cap on 10-year JGB yields, which was unaffected by a post-BoJ meeting peak. Amid ongoing worries about China’s hesitant economic recovery and trade conflicts, the Australian dollar shed its earlier gains, and the Chinese yuan (CNH) fell 0.2%.
Picks of the Day Analysis
EUR/USD (4 Hours)
EUR/USD Reverses Gains Amidst US Inflation Data and Stronger Dollar
The EUR/USD initially surged above 1.1050 following US inflation data, but later retreated, erasing its daily gains as the US Dollar gained strength. The pair remained confined within a well-known range, influenced by key moving averages, while the robust US Dollar continued to limit its movement. The US inflation report for July indicated an annual Consumer Price Index (CPI) rate of 3.2%, slightly below the market consensus of 3.3%, with a monthly increase of 0.2%. Despite the rise, the report resembled pre-pandemic levels and did not signal the end of deflationary pressures. The US Dollar strengthened during the American session due to worsening market sentiment and higher US Treasury yields, with the US 10-year yield reaching 4.10%, its highest in three days. The US Dollar Index was on track for its strongest daily close in a month, surpassing 102.50. The report also highlighted an increase in Initial Jobless Claims to 248,000, above the expected 230,000. The upcoming US Producer Price Index data and Europe’s July inflation readings are expected to impact further developments. The EUR/USD’s price action hinges on USD dynamics, with potential weakening tied to improved risk sentiment and ongoing deflation in the US. However, current momentum still indicates Dollar strength.
Based on technical analysis, the EUR/USD created a higher spike as the US CPI data was released lower than expected and reached the upper band of the Bollinger Bands. However, it then moved lower to reach the middle band and is currently experiencing a slight upward movement above the middle band of the Bollinger Bands. The Relative Strength Index (RSI) is currently at 51, indicating that the EUR/USD is in a consolidation phase.
Resistance: 1.1038, 1.1121
Support: 1.0915, 1.0839
XAU/USD (4 Hours)
XAU/USD Prices React to US CPI Release and Dollar Fluctuations
Gold prices experienced selling pressure, hovering around $1,920 after reaching a peak of $1,930.09 post the United States Consumer Price Index (CPI) release. The XAU/USD pair initially rose as China’s eased travel restrictions lifted sentiment and speculative interest shifted away from the US Dollar ahead of the inflation update. The CPI data, in line with expectations, showed a 0.2% monthly increase in July and a 3.2% yearly rise, slightly below the anticipated 3.3%. The core annual reading, at 4.7%, was a slight decline from June’s 4.8%. These figures supported the idea of a prolonged pause in Federal Reserve monetary tightening, leading to a decline in the US Dollar against major counterparts. However, Dollar strength returned later, erasing rivals’ gains influenced by the CPI data. Optimism waned after comments by Federal Reserve Bank of San Francisco President Mary Daly, emphasizing data-dependent rate decisions and noting that the CPI data, though as expected, doesn’t signal victory on inflation.
Based on technical analysis, the XAU/USD witnessed a slight decrease on Thursday following a previous upward movement triggered by the release of the US CPI data. The price managed to reach the middle band of the Bollinger Bands during this movement. At present, the price is retracing lower and is marginally positioned above the lower band of the Bollinger Bands. The Relative Strength Index (RSI) is currently at 37, indicating that the XAU/USD pair is exhibiting a somewhat bearish sentiment.
As part of our commitment to provide the most reliable service to our clients, there will be server maintenance this weekend.
Maintenance Hours :
12th of August 2023 (Saturday) 14:00 – 18:00 (GMT+3)
Please note that the following aspects might be affected during the maintenance:
1. The price quote and trading management will be temporarily disabled during the maintenance. You will not be able to open new positions, close open positions, or make any adjustments to the trades.
2. There might be a gap between the original price and the price after maintenance. The gaps between Pending Orders, Stop Loss and Take Profit will be filled at the market price once the maintenance is completed.
3. Please refer to MT4/MT5 for the latest update on the completion and market opening time. Our services will be back online once the maintenance is completed.
Thank you for your patience and understanding about this important initiative.
If you’d like more information, please don’t hesitate to contact [email protected].
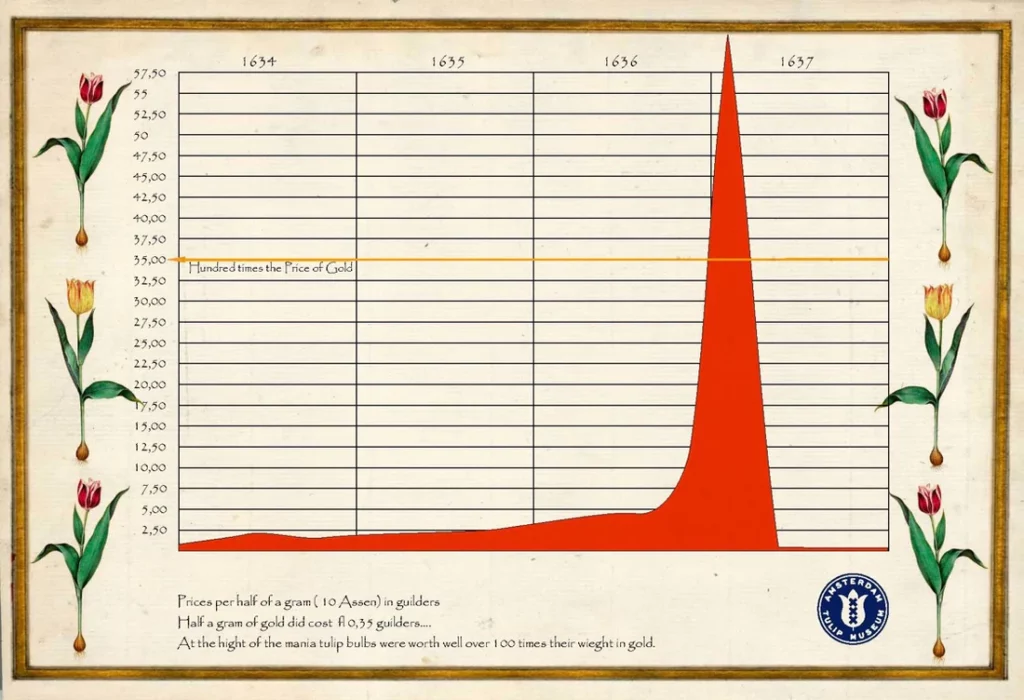
In the 17th-century Dutch Golden Age, a mesmerising phenomenon called “Tulip Mania” took centre stage, forever changing economic history.
Tulips, normally beloved for their beauty, became the focus of an astonishing speculative bubble. Prices soared to unimaginable heights, with a single rare bulb fetching the value of a grand house in Amsterdam.
source: Amsterdam Tulip Museum
Enthusiastic investors rushed into the tulip trade, lured by the promise of untold riches. However, reality intervened, and the bubble burst, leaving many penniless as prices plummeted.
Tulip Mania remains a powerful lesson in speculative trading and the impact of soft commodities on markets and human behaviour. Soft commodities, the backbone of the global economy and vital for human sustenance throughout history, have a longstanding history of trade spanning centuries.
Today, the soft commodities market has evolved into a highly sophisticated arena, surpassing the archaic bartering systems of the past. Its allure lies in the remarkable liquidity and critical significance of these commodities, presenting traders with abundant opportunities to capitalise on profitable ventures in the global markets.
This article aims to provide a comprehensive understanding of soft commodities, elucidating their definition and elucidating the avenues for trading them directly or through financial derivative instruments. Moreover, we will explore the various factors that wield influence over soft commodity prices and delve into effective strategies for managing a diversified portfolio that includes these valuable assets.
Understanding Soft Commodities
Soft commodities refer to natural resources that are cultivated and harnessed for various purposes, including food production, construction, manufacturing consumable goods, and facilitating other human activities.
These products are derived from the earth’s resources but necessitate human effort to be transformed into marketable goods that can be traded. They are commonly referred to as ‘softs’ within the trading industry.
Examples of Soft Commodities
Soft commodities encompass a diverse range of products, originating from various geographical regions worldwide, where optimal conditions favour their production. Despite their distinct origins, these commodities are categorised together due to their indispensable role in human sustenance and their natural composition, which allows for further refining or processing to yield other goods.
Here are some noteworthy examples of soft commodities: Coffee beans, Wheat, Cocoa, Sugar, Rough rice, Palm and kernel oil, Cotton, Hogs, Soybeans, Live cattle, Oats, Corn, Lumber.
Given the global nature of their sourcing, soft commodities are subject to price fluctuations influenced by factors such as weather conditions, disruptions in supply chains, and economic uncertainties. These fluctuations create ample opportunities for traders to speculate on the short and long-term movements of their prices.
What Are Hard Commodities?
To grasp the concept of commodities comprehensively, it is essential to distinguish between hard and soft commodities.
Unlike soft commodities that require cultivation and human intervention, hard commodities are directly extracted or mined from the earth and used in their raw, unprocessed state.
These commodities consist of finite natural resources, including crude oil, natural gas, as well as renewable energies such as solar, hydro, wind, and geothermal power.
Factors Influencing Soft Commodities Prices
The price of soft commodities is subject to the influence of various natural and human-related elements. Some key factors include:
Weather Conditions: Weather plays a crucial role in determining soft commodity prices. Favourable weather is essential for achieving expected harvests and yields to meet supply demands. Conversely, excessively favourable conditions can lead to an oversupply, causing a significant drop in prices.
Consumer Demand: Changes in consumer preferences can impact the popularity of specific soft commodities, affecting their prices. For instance, a rise in foodie culture and increased awareness of different cocoa bean types and flavour profiles can influence cocoa prices.
Political Instability: Political unrest and the threat of conflicts can disrupt soft commodity production and trading, leading to fluctuations in prices. For example, the recent war in Ukraine impacted wheat prices.
source: Financial Times
Supply Chain Disruptions: Issues such as increased transport costs, instability in developing nations, and other supply chain challenges can cause scarcity of soft commodities in the market, driving prices up.
Climate Change: Soft commodities cultivated on land are susceptible to climate change-related problems, such as poor soil quality, natural disasters, changing climate zones, floods, or droughts, impacting prices.
Labor Issues: Labor-related problems in supply countries can significantly influence soft commodity prices. Changes in wages due to new legislation can have a direct effect on the cost of raw materials.
Government Regulations: National governments may impose quotas on commodity production for specific markets. Such regulations or sanctions can disrupt supply and affect prices in other regions.
Seasonality: Soft commodities are influenced by seasonal cycles in their harvesting regions, causing prices to fluctuate accordingly.
Global Development: Rapidly developing regions experiencing population growth create new markets with increasing demands for soft commodities, leading to long-term shifts in supply and demand dynamics.
Exploring the Advantages of Soft Commodity Trading
The soft commodity market presents compelling opportunities for traders worldwide due to the indispensable nature of these commodities in meeting human needs. The market’s inherent unpredictability and vulnerability to various forces offer both heightened risks and substantial rewards.
While not every trader seeks to embrace such risks, those who thrive on navigating volatile markets can capitalise on lucrative prospects through soft commodity trading.
In today’s sophisticated trading landscape, much of the soft commodities trade occurs through futures markets rather than immediate spot transactions. Futures entail binding contracts that establish fixed prices for soft commodities to be executed on a future date, mutually agreed upon by the buyer and seller.
Initially devised to aid farmers and the agricultural industry in securing favourable prices during off-peak periods, futures have evolved into an integral part of a complex trading ecosystem.
Although futures contracts involve eventual asset delivery, many traders opt to offset futures before the delivery date, leveraging the instrument to speculate on anticipated price movements rather than the intrinsic value of the underlying asset itself. This strategic approach enables traders to engage in dynamic and forward-looking soft commodity trading practices.
Navigating Soft Commodity Trading: Strategies and Risk Management
Soft commodity trading via futures involves significant risk and requires careful consideration of leverage. Futures contracts enable traders to invest only a percentage of the asset’s full value, yet profits and losses are calculated based on the total price.
Successful predictions can yield magnified profits when offsetting soft commodity futures. However, sudden unpredictable factors may cause price fluctuations, potentially leading to losses surpassing the initial investment.
To mitigate risk, implementing robust risk management strategies is paramount before commencing soft commodity trading. Utilising tools like stop-loss orders can automatically close positions once they reach an unaffordable level, safeguarding against excessive losses.
Additionally, deciding whether to go long or short while trading soft commodities is crucial in formulating an effective strategy.
To gain practical experience, traders can begin with a demo account before transitioning to real trading with a live trading account. VT Markets simplifies this process by providing access to over a thousand financial instruments within an institutional-grade environment.
It’s important to recognise that each soft commodity possesses unique characteristics, including production methods, supply sources, vulnerabilities, and consumer behaviour. For those interested in specific commodities like coffee, comprehensive guides focusing on these particular markets are available to enhance understanding and proficiency.
In conclusion, soft commodity trading offers a rich history and exciting opportunities. From the historic “Tulip Mania” to today’s sophisticated futures markets, these commodities have a significant impact on global economies.
Traders must navigate risks and employ strategies for successful trading. With diverse soft commodities and their unique market influences, there are abundant chances to capitalise on global dynamics. Embrace the allure of soft commodities, learn from history, and explore the complexities of modern trading. Join this exciting journey and seize remarkable opportunities.
Summary:
Soft commodities have a rich history, including the famous “Tulip Mania” in the 17th-century Dutch Golden Age.
The modern soft commodities market offers diverse opportunities for traders to capitalise on price fluctuations.
Soft commodities are natural resources cultivated and utilised for various human needs, such as food production and manufacturing, requiring human effort to become marketable goods.
Soft commodities encompass a diverse range of products originating from various geographical regions worldwide, such as coffee beans, wheat, cocoa, sugar, palm oil, cotton, soybeans, and more.
Understanding factors influencing soft commodity prices is crucial, including weather, consumer demand, political instability, and more.
Please note that the dividends of the following products will be adjusted accordingly. Index dividends will be executed separately through a balance statement directly to your trading account, and the comment will be in the following format “Div & Product Name & Net Volume ”.
Please refer to the table below for more details:
The above data is for reference only, please refer to the MT4/MT5 software for specific data.
If you’d like more information, please don’t hesitate to contact [email protected].
On Wednesday, the stock market witnessed a downward shift as investors braced themselves for upcoming inflation data and evaluated a series of diverse earnings reports. The Dow Jones Industrial Average concluded the trading session with a loss of 0.54%, shedding 191.13 points to reach a closing figure of 35,123.36. Similarly, the S&P 500 registered a decline of 0.7%, settling at 4,467.71, while the Nasdaq Composite faced a 1.17% dip, concluding at 13,722.02.
As the market eagerly awaits the imminent release of the U.S. inflation report, all eyes are on the consumer price index data for July, scheduled for unveiling on Thursday. This data holds a critical role as it provides vital insights into potential adjustments in the Federal Reserve’s interest rate strategy. Economists, surveyed by Dow Jones, have projected a 3.3% increase in the inflation gauge for July, prompting market participants to meticulously assess its implications. Meanwhile, in parallel, the corporate landscape is being shaped by a wave of earnings reports, with Disney and Wynn Resorts poised to disclose their quarterly results. Against this backdrop, a sense of cautious prudence pervades the investor sentiment, as they navigate the intricate interplay between economic indicators and the outcomes of corporate performances.
On Wednesday, across all sectors, the market experienced a decrease of 0.70%. However, there were some sectors that saw gains: Energy increased by 1.22%, Real Estate by 0.20%, Utilities by 0.17%, and Consumer Staples by 0.13%. On the other hand, several sectors faced declines: Health Care decreased by 0.05%, Industrials by 0.09%, Materials by 0.47%, Financials by 0.78%, Consumer Discretionary by 1.20%, Communication Services by 1.24%, and Information Technology by 1.51%.
Major Pair Movement
The dollar index remained below Tuesday’s risk-off highs as U.S. bank stocks continued to decline following Moody’s downgrade, while Italian bank stocks rebounded due to a capped windfall tax. While European markets regained some ground, U.S. stocks, led by banks, experienced a decline, and yield spreads between bunds and Treasuries increased. The rebound in the yuan from recent lows was attributed to the prospect of China’s first deflation reading in 2 years prompting stronger government stimulus, though the extent of this remains uncertain.
Market focus now turns to the upcoming U.S. Consumer Price Index (CPI) report on Thursday, which will either confirm or challenge prevailing expectations of the Federal Reserve’s future rate actions. The dollar has nearly recouped its losses triggered by weaker June data, and July’s CPI is expected to provide clearer insights into inflation trends and the Fed’s stance. In currency movements, EUR/USD rose, and USD/CNH fell, while sterling declined, USD/JPY rose, and AUD/USD fell due to global derisking. Key points of interest include the status of EUR/USD above its support level, the surge in Dutch gas prices potentially boosting the dollar, sterling breaching its 55-day moving average amid concerns about UK inflation, and USD/JPY’s attempt to surpass previous peaks, with CPI data potentially playing a role. Additionally, the near real-time indicator of labor demand provided by initial jobless claims will be observed on Thursday.
Picks of the Day Analysis
EUR/USD (4 Hours)
EUR/USD Gains Momentum Ahead of Key US Inflation Data
The EUR/USD rose as the Euro demonstrated strength and market focus turned to impending US inflation data. While the currency pair currently lacks a distinct trend, the upcoming US figures could spark notable movement.
Boosted by Italy’s decision to partially reverse a banking sector windfall tax, the Euro outperformed other G10 currencies on Wednesday. Market attention now shifts to the European Central Bank’s economic bulletin and Italy’s final July inflation reading. Anticipation surrounds the release of the US July Consumer Price Index, projected at 3.3%, and the weekly Jobless Claims report. These releases could significantly impact the EUR/USD pair’s trajectory, taking into account both the data itself and its context within recent consolidation.
Based on technical analysis, the EUR/USD remained steady on Wednesday as the market awaited upcoming US inflation data for the week, specifically CPI and PPI, while also attempting to move toward the middle band of the Bollinger Bands. Right now, the price is slightly below the middle band, creating a small gap between the upper and lower bands of the Bollinger Bands. The Relative Strength Index (RSI) is currently at 47, showing that the EUR/USD is in a phase of consolidation.
Resistance: 1.1038, 1.1121
Support: 1.0915, 1.0839
XAU/USD (4 Hours)
XAU/USD Prices Drop as US Dollar Gains Amid Economic Uncertainty
Gold prices fell to a one-month low of around $1,917 per troy ounce during the American session. The US Dollar initially weakened but later stabilized, particularly against safe-haven currencies. Market uncertainty prevails due to economic concerns and central bank policies, with expectations for potential rate hikes lingering despite recent pauses. The US focus remains on a tightening labor market and the upcoming release of the July Consumer Price Index, which could impact the Federal Reserve’s future rate decisions.
Based to technical analysis, the XAU/USD experienced a minor decrease on Wednesday, managing to touch the lower band of the Bollinger Bands. Currently, the price is slightly above the lower band of the Bollinger Bands. The Relative Strength Index (RSI) stands at 33, suggesting that the XAU/USD pair is somewhat in a bearish mode.