Back

Oil Stays Bid as Market Waits on Hard Deadline

Key Points

  • CL-OIL trades at 115.027, up 2.472 (+2.20%), after printing a session high of 115.447.
  • Brent crude rose 0.4% to $110.19, while WTI futures climbed 0.8% to $113.31 as traders waited for Tuesday’s deadline.
  • The Strait of Hormuz still carries about one-fifth of the world’s oil and natural gas supply, keeping the market focused on physical disruption rather than diplomacy alone.

Crude is still trading like supply risk has not eased. CL-OIL is holding above 115, and the broader futures market stayed firm as traders waited for Trump’s Tuesday deadline for a deal with Iran.

Brent held near $110.19 and WTI near $113.31, which kept the market in the upper end of the recent war-driven range.

The price action shows that the market is not willing to remove the risk premium ahead of an event that could escalate again within hours. Traders have seen enough failed diplomacy and partial relief headlines over the past month to keep paying for protection until Hormuz flows are clearly safer.

A cautious near-term view still favours elevated prices while the deadline remains live and the shipping picture stays unclear.

Hormuz Still Sets the Tone

The market is still trading the Strait of Hormuz first and everything else second. The route carries about 20% of global oil and natural gas supply, so any restriction there quickly feeds into shipping rates, insurance costs, and prompt crude pricing.

Iran has signalled that it wants a lasting outcome rather than a temporary ceasefire, and pressure to reopen the waterway has not yet produced a breakthrough.

That leaves physical supply as the main variable. A market can tolerate aggressive rhetoric for a while. It reacts much more sharply when the main export artery for Gulf energy stays constrained.

That is why oil has stayed firm even when equities have tried to stabilise. The market still lacks a credible path to normal flows.

Equities Waver While Oil and the Dollar Stay Firm

Broader risk sentiment reflects the same hesitation. Asian equities moved in mixed fashion, with MSCI Asia-Pacific ex-Japan up 0.4%, while the Nikkei slipped 0.2%. At the same time, US stock futures fell 0.55%, showing traders were still reducing risk rather than fully buying the truce story.

The dollar also stayed supported. The dollar index held around 100.06, while the euro traded at $1.1538 and USDJPY hovered near 159.91, close to the level that keeps Tokyo sensitive to intervention risk.

That pattern is consistent with a market still pricing inflation pressure and slower growth together. Oil remains high enough to keep that stagflation mix in focus.

Inflation Risk is Starting to Show Up in US Data

The macro backdrop has started to absorb the energy shock. US services-sector growth slowed in March, while business prices paid rose at the fastest pace in more than 13 years, giving markets an early read on how the Iran war is feeding inflationary pressure.

That helps explain why traders are no longer pricing Fed cuts this year. Oil at these levels does not just hit fuel bills. It feeds into logistics, chemicals, transport, and broader input costs. Once that happens, central banks lose flexibility quickly.

A cautious forecast still points to tighter financial conditions if crude remains around current levels into the next inflation prints.

Technical Analysis

CL-OIL is trading near 115.03, continuing its strong upward trajectory after the sharp breakout from the late-February base. Price action shows sustained bullish momentum, with the market pushing steadily higher following the surge toward 119.43, and now consolidating just below that recent peak.

The structure remains clean, with higher highs and higher lows forming, indicating buyers are still in firm control.

From a technical standpoint, the trend remains firmly bullish. Price is trading well above all key moving averages, with the 5-day (107.97) leading the move higher, followed by the 10-day (101.92) and 20-day (97.81), all sloping upward in strong alignment. This reflects a persistent trend strength, while the current consolidation above the $110 region suggests the market is continuing to build rather than showing signs of exhaustion.

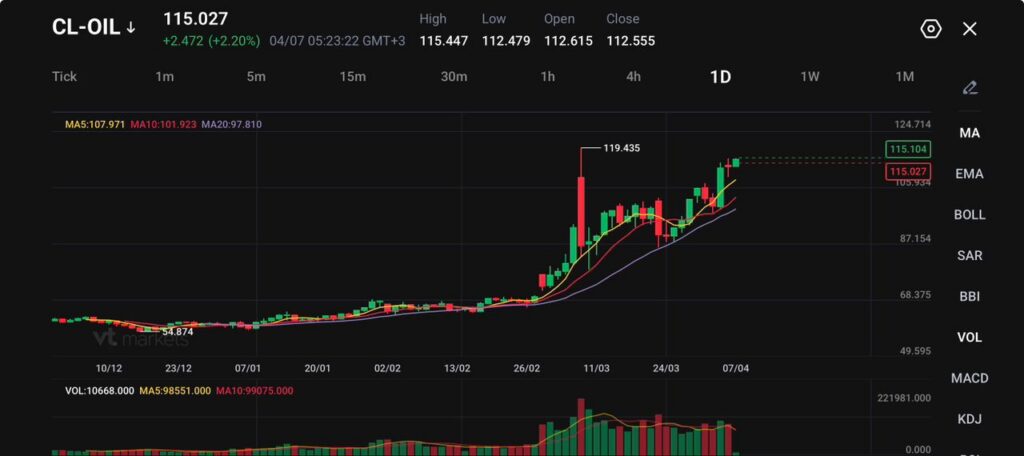
Key levels to watch:

  • Support: 110.00 → 105.90 → 101.90
  • Resistance: 115.50 → 119.40 → 124.70

The immediate focus is on the 115.50 area, which is acting as short-term resistance. A clean break above this level could open the path toward a retest of 119.40, with further upside potential if momentum accelerates.

On the downside, 110.00 is the key psychological and structural support. A break below this level could trigger a pullback toward 105.90, though such a move would likely remain corrective within the broader uptrend.

Overall, oil remains in a strong uptrend with consolidation at elevated levels. As long as price holds above the $110 zone, the bias stays firmly to the upside, with the market positioning for a potential continuation move toward recent highs.

What Traders Should Watch Next

The next move depends on whether the deadline produces a real reopening path for Hormuz or another escalation headline. Brent and WTI are already trading at levels that keep inflation fears alive, while the dollar and rates market continue to price that stress into the macro outlook.

If the deadline passes without progress and the waterway stays constrained, oil can keep pressing toward the recent highs.

If a deal emerges and traffic begins to normalise, the market can unwind part of the premium quickly, but it will likely need proof in flows rather than promises.

Learn more about trading Energies on VT Markets here.

Trader Questions

Why is Oil Still Holding Above $110?

Oil is holding high because traders still see a real risk of further disruption to Gulf energy flows while the Iran deadline remains unresolved. Brent was recently quoted at $110.19 and WTI at $113.31 in the wider futures market, which shows the risk premium is still firmly in place.

Why Does The Iran Deadline Matter So Much For Oil Prices?

A fixed deadline forces the market to price a near-term escalation risk. If no deal is reached and the Strait of Hormuz stays constrained, traders have to assume supply disruption could last longer and push prices higher.

Why is the Strait of Hormuz So Important for Crude?

The Strait carries about one-fifth of the global oil and natural gas supply, so even a partial disruption can lift freight costs, insurance premiums, and prompt crude prices very quickly.

Why Has Oil Stayed Firm Even Though Talks Are Still Happening?

The market is no longer reacting to diplomacy alone. It wants proof that energy flows will normalise. Until shipping risk clearly falls, traders are reluctant to strip out the premium from crude.

How Are Higher Oil Prices Affecting Broader Markets?

Higher crude prices are feeding inflation fears, tightening financial conditions, and keeping pressure on equities and central banks. Markets have already started pricing slower growth and firmer inflation together, which is why stagflation concerns keep resurfacing.

Why is the Dollar Staying Supported Alongside Oil?

The dollar is holding firm because investors are still using it as the main haven trade while the conflict remains live. The dollar index was recently around 100.06, which shows traders are still leaning defensive rather than moving fully back into risk assets.

Start trading now – Click here to create your real VT Markets account

February saw Japan’s household spending fall 1.7% year on year, missing the expected 0.7% decline

Japan’s overall household spending fell by 1.7% year on year in February. This was weaker than the forecast decline of 0.7%. The result indicates a larger drop in spending than expected for the month. It compares the actual figure (-1.7%) directly against the forecast (-0.7%).

Household Spending Signals Cooling Growth

The drop in household spending for February 2026, which was significantly worse than forecasted, suggests a cooling Japanese economy. This data confirms the fragility of the consumer sector, a trend we also observed in the latter half of 2025. Derivative traders should anticipate that this will weigh on future growth-sensitive assets. This reinforces our view that the Bank of Japan will be extremely cautious about any further monetary tightening after its recent policy shift in March 2026. The widening interest rate differential with the U.S., where the Federal Reserve is holding firm, supports strategies that bet on a weaker yen. We are looking at USD/JPY call options as the exchange rate, currently around 152, could test higher levels. For equity markets, this consumer weakness is a headwind for the Nikkei 225, particularly for retail and domestic service stocks. We saw how similar spending data in Q4 2025 preceded a brief market correction, reminding us that the index is not immune to domestic fundamentals. Buying put options on the Nikkei 225 offers a way to hedge against a potential downturn in the coming weeks. Conversely, this weak economic signal is bullish for Japanese Government Bonds (JGBs). The data makes it less likely the BoJ will aggressively sell its bond holdings, potentially putting a cap on the 10-year JGB yield, which has been hovering around 0.75%. We expect to see increased interest in JGB futures from those anticipating a more dovish central bank stance.

Volatility May Reprice Higher

The surprise negative data increases overall economic uncertainty, which could cause market volatility to rise from its current low levels. The Nikkei Volatility Index, recently trading near 17, may see an upward move as investors re-price risk. This environment could make long volatility strategies, such as purchasing straddles on the index, attractive. Create your live VT Markets account and start trading now.

Start trading now – Click here to create your real VT Markets account

Trump said Iran’s ceasefire offer was insufficient, warning of strikes unless the Strait of Hormuz reopens

US President Donald Trump said the latest US ceasefire proposal with Iran is “not good enough”, CNBC reported on Monday. He set a deadline for Iran to reopen the Strait of Hormuz or face attacks on civilian infrastructure. At a White House press conference, Trump was asked whether the war with Iran was winding down or ramping up. He replied: “I can’t tell you.”

Hormuz Deadline And Market Stakes

Trump said Iran “can be taken out in one night, and that might be tomorrow night”. He repeated that the US would strike Iran’s energy and transportation infrastructure on Tuesday at 8 PM Eastern Time (ET) if the strait is not reopened. Iran rejected the proposal and called for a permanent end to the war, according to Iranian state media. A spokesperson for Iran’s top joint military command described Trump’s threats as “delusional” and referred to “disgrace and humiliation” for the US in the region. At the time of publication, WTI was down 0.21% on the day at $103.65. With the 8 PM ET deadline just hours away, the immediate focus is on the Strait of Hormuz, a chokepoint for global energy. Given that nearly 21 million barrels of oil, or about 21% of global petroleum liquids consumption, pass through the strait daily, a closure would trigger a historic supply shock. We are therefore holding long positions in oil futures and adding short-term call options on crude to capture the upside from a potential military strike.

Volatility Hedging And Scenario Trades

Beyond oil, we expect a major risk-off event across all markets, pushing volatility indices sharply higher. Looking back at the initial phase of the Red Sea shipping crisis in late 2025, we saw the VIX jump over 40% as uncertainty paralyzed the markets. Consequently, we are buying VIX call options as a direct hedge against our equity exposure and to profit from rising fear. There remains an outside chance this is political theater, and a last-minute agreement could be reached. A de-escalation would cause oil to plummet and equities to rally significantly. To prepare for this less likely outcome, we are purchasing a small number of cheap, far out-of-the-money put options on WTI, which act as a low-cost lottery ticket against a sudden peace dividend. We are also targeting specific sectors that have a clear stake in the outcome. Call options on major defense contractors are prudent, as their valuations will rise with any sustained conflict. Conversely, we are buying puts on airline and shipping stocks, as their fuel costs would become unsustainable if crude prices were to spike past the $120 mark we saw in mid-2025. The extremely high implied volatility right now makes outright buying of options very expensive. Therefore, we are using debit spreads to define our risk and lower our entry cost on these trades. This allows us to make directional bets on oil and the broader market without overexposing capital to volatility crush if the situation resolves peacefully tonight. Create your live VT Markets account and start trading now.

Start trading now – Click here to create your real VT Markets account

Gold rises towards $4,660 in Asia as traders monitor Trump’s Iran strike deadline after Hormuz closure

Gold (XAU/USD) rose to about $4,660 in early Asian trading on Tuesday. Trading was cautious ahead of US President Donald Trump’s Tuesday deadline linked to Iranian actions affecting the Strait of Hormuz. On Monday, Trump said a latest US ceasefire proposal with Iran was “not good enough”. He set a deadline of Tuesday at 8 p.m. ET for Iran to reopen the strait, or face attacks on civilian infrastructure. Oil prices have risen on supply concerns tied to the Strait of Hormuz. Higher oil can add to inflation worries and affect expectations for US interest rates, which can pressure non-yielding assets such as gold. CME FedWatch data showed futures pricing virtually no chance of a move at the April 28–29 FOMC meeting. It also showed a 77.5% probability the Fed will stay on hold through the end of the year. Gold is often used as a store of value in periods of stress and is also used in jewellery. Central banks added 1,136 tonnes of gold worth about $70 billion in 2022, the highest yearly purchase on record. We are seeing gold trade near $4,660 as we monitor rising geopolitical tensions in the South China Sea. The current naval standoff is creating significant market uncertainty, which is increasing demand for safe-haven assets. This situation puts gold in a strong position if the conflict escalates further. However, the latest U.S. inflation data from March showed core CPI holding at 3.1%, keeping the Federal Reserve in a cautious stance. With the Fed funds rate at 4.75%, the high cost of money makes holding a non-yielding asset like gold less attractive. This is creating a classic tug-of-war between geopolitical fear and restrictive monetary policy. For derivative traders, this means implied volatility is likely to climb in the coming weeks as uncertainty builds. The CBOE Volatility Index (VIX) has already risen to 22, reflecting broad market anxiety over the situation. We believe strategies that benefit from a large price move, such as buying options straddles on gold ETFs, could be positioned well. We saw a very similar dynamic back in 2025 during the U.S. and Iran standoff over the Strait of Hormuz. Looking back, gold surged on the initial military threats but its rally stalled as rising oil prices sparked inflation fears, limiting expectations for Fed rate cuts. That event is a key reminder of how monetary policy can act as a brake on a fear-driven rally. A major underlying support for gold is the continued strong buying from central banks. New data shows that global central banks added another 1,050 tonnes to their reserves through 2025, continuing the trend of diversification away from the dollar. While this provides a solid floor for the price, the U.S. Dollar’s reaction to the current crisis will be the key driver for gold in the short term.

Start trading now – Click here to create your real VT Markets account

GBP/JPY holds above 211.00, capped at 211.50 as risk mood and 50-day SMA attract flows

GBP/JPY is trading above 211.00 but has not moved above 211.50. The 50-day SMA at 211.26 is close to current price, and market talk includes possible Japanese FX intervention. The RSI is near neutral, suggesting unclear momentum in the near term. Price action remains range-bound unless 211.50 is broken. A break above 211.50 would open the way to the 20-day SMA at 211.90 and then 212.00. Further upside levels include 213.31 and 214.00. If price falls below the 50-day SMA, 211.00 may be tested. Below that, support sits around 210.50–65, with the 100-day SMA at 210.31 next. We are seeing GBP/JPY struggle below the 211.50 resistance level, creating a period of sideways consolidation. This suggests that option sellers could look at strategies like writing short strangles to collect premium, capitalizing on the current lack of direction. The neutral RSI indicator supports this view that momentum is undecided for the moment. For a bullish outlook, a decisive break and close above 211.50 would be the key trigger for buying call options. The initial target would be the 212.00 mark, with a move toward the late March 2026 highs near 213.31 possible if risk appetite continues to improve. This would signal that the market is ignoring the threat of intervention from Japanese authorities. On the other hand, the risk of intervention from Tokyo to strengthen the Yen remains very real, making us cautious. We remember the sudden, sharp drops in this pair in late 2025 when officials last stepped into the market. A failure to hold above the 211.00 level would prompt us to look at buying put options to hedge against a sharp decline toward support around 210.50. The fundamental picture is tense, as recent UK inflation data for March 2026 came in at 2.3%, keeping the Bank of England on a hawkish path. This policy difference with the Bank of Japan is the main factor supporting the pair. However, official Japanese data from last week showed currency reserves have been built up, giving them plenty of firepower for intervention. Given the tight range and the potential for a sudden, sharp move, traders could consider volatility plays. Buying a straddle, which involves purchasing both a call and a put option at the same strike price, could be effective. This strategy would profit from a significant breakout in either direction over the next few weeks, which seems increasingly likely.

Start trading now – Click here to create your real VT Markets account

Gold nears $4,660 in Asia as traders monitor Trump’s Iran strike deadline after Hormuz Strait closure

Gold (XAU/USD) rose towards $4,660 in early Asian trading on Tuesday. The move came as markets watched a US deadline set by President Donald Trump linked to possible military action on Iranian infrastructure after the Strait of Hormuz was closed. On Monday, Trump said the latest US ceasefire proposal with Iran was “not good enough”. He set a deadline for Iran to reopen the Strait of Hormuz or face attacks on civilian infrastructure.

Gold Rises On Geopolitical Deadline

Trump repeated on Tuesday that he could target Iran’s energy and transport infrastructure at 8 p.m. ET if the strait is not reopened. Higher crude oil prices tied to supply worries in the Strait of Hormuz may add to inflation fears. Those inflation concerns could affect expectations for Federal Reserve rate cuts. Gold is often bought during geopolitical risk, but it pays no interest and can face pressure when rates stay high. CME FedWatch data showed futures pricing almost no chance of a move at the April 28-29 FOMC meeting. It also showed a 77.5% probability the Fed will stay on hold through the end of the year. We are seeing gold prices stabilize around the $4,500 mark after the intense volatility we experienced last year. The situation surrounding the Strait of Hormuz, with the US-Iran deadline, pushed gold to its peak of $4,660. That crisis has de-escalated for now, but the market memory keeps a floor under the price.

Inflation And Fed Policy In Focus

The spike in crude oil that followed the 2025 Strait closure has had a lasting effect, with WTI crude futures still trading above $145 a barrel. This has kept inflation stubbornly high, with the latest Consumer Price Index (CPI) report showing a 3.8% annual increase, well above the Fed’s target. This persistent inflation is the primary factor influencing central bank policy today. Given this environment, implied volatility on gold options remains elevated. The CBOE Gold Volatility Index (GVZ) is holding near 19, significantly higher than its historical average, reflecting ongoing uncertainty. This makes selling premium through strategies like covered calls on gold miners or iron condors on gold ETFs an interesting, though risky, proposition for generating income. Looking ahead, the Federal Reserve’s stance has become the main driver. While last year the market expected rates to hold steady, the CME FedWatch tool now shows a 65% probability of a 25-basis-point rate cut by the September FOMC meeting to support a slowing economy. This potential shift to a more dovish policy is creating bullish undercurrents for non-yielding gold. For the coming weeks, we should consider using long-dated call options on gold futures to position for this potential rate-cut rally while clearly defining our risk. Buying December $4,700 calls offers exposure to the upside if the Fed does signal an easing cycle. This strategy protects capital if renewed inflation fears delay any planned cuts. At the same time, the high energy prices continue to pressure corporate earnings and economic growth. We can hedge broader portfolio risk by purchasing put options on the S&P 500. This provides a counterbalance in case stagflationary fears take hold and trigger a downturn in equities. Create your live VT Markets account and start trading now.

Start trading now – Click here to create your real VT Markets account

Haven demand leaves GBP/JPY steady above 211.00, yet capped below 211.50, near its 50-day SMA

GBP/JPY is trading above 211.00 but has not moved past 211.50. Price action is being pulled towards the 50-day SMA at 211.26, with market caution around possible Japanese FX intervention. The RSI is near neutral, pointing to mixed short-term momentum. The pair is expected to stay range-bound unless 211.50 is cleared.

Upside Levels And Breakout Triggers

A break above 211.50 would open moves towards the 20-day SMA at 211.90 and then 212.00. Further gains would target the March 26 high at 213.31, with 214.00 after that. If the pair drops below the 50-day SMA, 211.00 becomes the next level to watch. Below there, support sits near a trendline around 210.50–65, followed by the 100-day SMA at 210.31. This week, the Japanese Yen recorded percentage changes against major currencies and was strongest versus the New Zealand Dollar. A heat map was used to show these percentage moves between base and quote currencies. We are seeing GBP/JPY consolidate below the 205.00 handle, with the market showing indecisiveness similar to the sideways action we observed back in 2025 below the 211.50 level. The key tension remains the same: a relatively strong pound against a persistently weak yen, capped by the constant threat of Japanese intervention. This range-bound trading suggests that momentum is balanced for now, but pressure is building for a breakout. Recent UK inflation data is providing a floor for the pair, as the March CPI came in at a stubborn 2.8%, higher than the 2.5% that was expected. This is pushing back market pricing for a Bank of England rate cut, keeping UK bond yields elevated and supporting the pound. This fundamental backing makes sharp sell-offs less likely without a major catalyst.

Options Positioning And Intervention Risk

On the other hand, Japanese officials are again making verbal warnings against excessive yen weakness, echoing the same rhetoric used throughout 2025. The Bank of Japan has been slow to normalize policy since ending negative rates, and the wide interest rate differential continues to weigh on the yen. Commitment of Traders data from last week shows that speculative net short positions against the yen remain near multi-year highs, making it vulnerable to a sharp reversal if authorities act. For derivative traders, this setup suggests positioning for a volatility spike rather than a specific direction in the immediate term. Buying a one-month at-the-money straddle could be an effective strategy to capture a large move, whether it’s a breakout above 205.00 or a sharp drop from intervention. With one-month implied volatility currently at a moderate 9.5%, the cost of such a position is not yet prohibitive. For those with a bullish directional bias, buying call options with a strike price just above 205.00 offers a limited-risk way to play for a move toward the 206.80 resistance from late 2025. This allows traders to benefit from the underlying strength of the pound while capping their potential loss to the option premium paid. This is a prudent approach given the risk of a sudden, intervention-led drop. Conversely, if the pair shows a clear rejection at the 205.00 level, put options offer a defined-risk method to trade a move lower. A decisive break below the 50-day moving average, currently near 203.80, could be a trigger for a slide towards the 202.50 support zone. These puts would also serve as an effective hedge against long GBP/JPY exposure should Japanese authorities finally decide to step into the market. Create your live VT Markets account and start trading now.

Start trading now – Click here to create your real VT Markets account

Australia’s S&P Global Services PMI came in at 46.3, undershooting the 46.6 forecast for March

Australia’s S&P Global Services PMI came in at 46.3 in March. This was below the forecast of 46.6. A reading below 50 indicates contraction in activity. The March result remained under this threshold.

Implications For Markets

The March services PMI reading of 46.3 shows a deeper contraction than the market anticipated, signaling clear weakness in the Australian economy. This negative surprise suggests that bearish sentiment will likely dominate in the short term. We believe this warrants a defensive posture and an outlook for increased market volatility. This data significantly raises the probability of a future interest rate cut by the Reserve Bank of Australia to stimulate the economy. We should therefore consider positioning for falling yields through interest rate futures. This contrasts with the cautious optimism we saw during parts of 2025 when the economy appeared more resilient. For currency traders, a slowing economy and the prospect of lower rates will likely put downward pressure on the Australian dollar. We see opportunities in shorting the AUD/USD pair or buying put options to profit from a potential decline. This move is supported by recent data showing a widening trade deficit in the fourth quarter of 2025, which has already been a drag on the currency. The weakness in the services sector, a major component of the ASX 200, points to potential headwinds for corporate earnings. We are looking at shorting index futures or buying protective put options on major Australian ETFs. This view is reinforced by the latest unemployment data, which ticked up to 4.3% in February 2026, suggesting that softening economic conditions are beginning to impact the labor market.

Volatility Strategy Considerations

Given the increased uncertainty, we expect market volatility to rise from its current levels. This environment makes strategies like purchasing straddles or strangles on key financial and consumer discretionary stocks more attractive. These sectors are particularly sensitive to shifts in domestic economic health. Create your live VT Markets account and start trading now.

Start trading now – Click here to create your real VT Markets account

S&P Global reported Australia’s composite PMI at 46.6, undershooting the expected 47 in March data

Australia’s S&P Global Composite PMI was 46.6 in March. This was below the expected reading of 47. A PMI figure below 50 indicates overall business activity fell compared with the previous month. The March result points to a contraction in combined services and manufacturing activity.

Implications For Growth Momentum

This March purchasing managers’ index reading signals a contraction in private sector output for the second straight month. The figure coming in below 47, and under expectations, suggests the economic slowdown is gathering pace more quickly than anticipated. We should therefore anticipate a bearish sentiment shift in the near term. The data significantly increases the probability that the Reserve Bank of Australia will pivot to a more dovish stance in its upcoming meetings. With inflation having already cooled to 3.1% in the first quarter and the unemployment rate recently ticking up to 4.2%, this weak growth signal will weigh heavily on any hawkish sentiment. We should be watching interest rate futures to price in a higher chance of a rate cut before the end of the year. This outlook is negative for the Australian dollar, which is highly sensitive to both domestic growth and interest rate differentials. A similar dynamic played out back in late 2024 when weak data from China sent the AUD/USD tumbling below 0.6400. Traders should consider using options to position for a weaker AUD against the US dollar, perhaps targeting a move towards the 0.6550 level initially. For equities, this points to headwinds for the ASX 200, particularly for cyclical sectors like financials and materials which are reliant on a strong domestic economy. We saw how miners were hit last year by falling iron ore prices, and this report suggests domestic demand will not be picking up the slack. Consequently, buying put options on the XJO index offers a direct way to hedge or speculate on broad market downside in the coming weeks.

Volatility And Options Positioning

Given the surprise nature of the data miss, we should expect a spike in implied volatility. This makes long volatility strategies, such as buying straddles on key index ETFs, an attractive way to trade the upcoming uncertainty. This approach allows a trader to profit from a large market move in either direction as the market digests whether this is a temporary blip or the start of a more pronounced downturn. Create your live VT Markets account and start trading now.

Start trading now – Click here to create your real VT Markets account

Australia’s S&P Global Services PMI came in at 46.3, under the 46.6 forecast in March

Australia’s S&P Global Services PMI came in at 46.3 in March. This was below the forecast of 46.6. A reading below 50 indicates contraction in services activity. The March result therefore points to a decline in the sector.

Services Sector Signals Growing Weakness

The services sector contracting faster than expected is a clear signal of economic weakness. This figure, at 46.3, marks the third consecutive month of contraction, a concerning trend for the economy. We should anticipate this will put downward pressure on the Australian dollar. This weak data makes it highly unlikely the Reserve Bank of Australia will consider a rate hike in the near term. In fact, it strengthens the case for a potential rate cut later in the year, a scenario the market is beginning to price in more aggressively. We will be watching for any dovish shift in the RBA’s language at its next meeting. For currency traders, this suggests positioning for further AUD/USD weakness, especially as the US Federal Reserve appears committed to holding its rates higher for longer. Buying put options on the AUD/USD pair can provide a defined-risk way to profit from a potential decline. The Australian dollar has already fallen below 0.6500 against the US dollar this week on the back of broad US dollar strength. On the equities front, a slowing services sector is a headwind for corporate profits, particularly for consumer-facing and financial companies. We should consider buying protective puts on the ASX 200 index or specific bank ETFs. This strategy can help hedge existing long positions against a potential market downturn in the coming weeks.

Key Data And Risk Signals Ahead

We remember the brief recovery we saw in the services sector during the second half of 2025, but this new data confirms that momentum has stalled. The latest jobs report, which showed the national unemployment rate ticking up to 4.2%, corroborates this slowdown. The upcoming Q1 CPI data release will be the next critical datapoint to watch. The increased uncertainty could lead to a rise in market volatility. This environment makes strategies like long straddles on the index attractive, particularly ahead of major economic announcements. Such a move would profit from a significant price swing in either direction. Furthermore, recent data showing a slowdown in Chinese industrial production adds another layer of concern. As China is Australia’s largest trading partner, any weakness there directly impacts demand for Australian exports and weighs on the overall economy. This external pressure reinforces the bearish domestic signals. Create your live VT Markets account and start trading now.

Start trading now – Click here to create your real VT Markets account

Back To Top
server

Hello there 👋

How can I help you?

Chat with our team instantly

Live Chat

Start a live conversation through...

  • Telegram
    hold On hold
  • Coming Soon...

Hello there 👋

How can I help you?

telegram

Scan the QR code with your smartphone to start a chat with us, or click here.

Don’t have the Telegram App or Desktop installed? Use Web Telegram instead.

QR code