As part of our commitment to provide the most reliable service to our clients, there will be server maintenance this weekend.
Maintenance Hours :
21st of October 2023 (Saturday) 02:00 – 04:00 (GMT+3)
Please note that the following aspects might be affected during the maintenance:
1. The price quote and trading management will be temporarily disabled during the maintenance. You will not be able to open new positions, close open positions, or make any adjustments to the trades.
2. There might be a gap between the original price and the price after maintenance. The gaps between Pending Orders, Stop Loss and Take Profit will be filled at the market price once the maintenance is completed.
3. Please refer to MT4/MT5 for the latest update on the completion and market opening time. Our services will be back online once the maintenance is completed.
Thank you for your patience and understanding about this important initiative.
If you’d like more information, please don’t hesitate to contact [email protected]
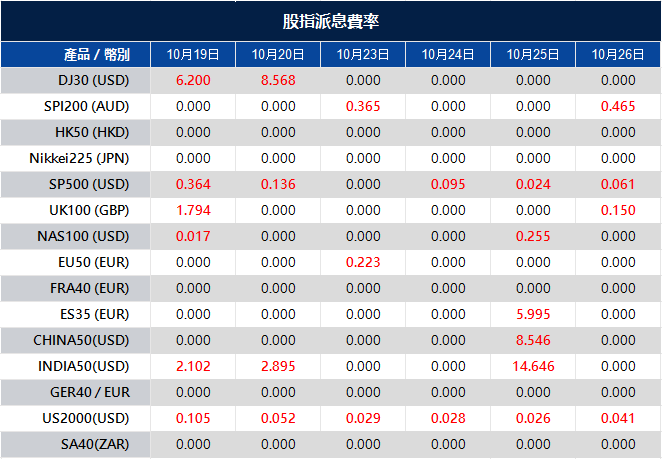
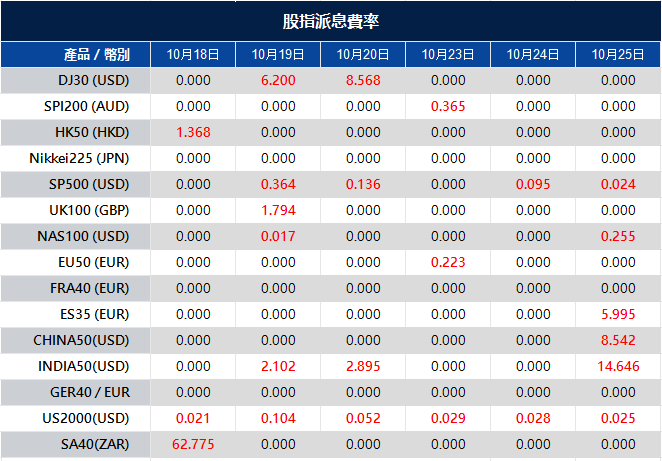
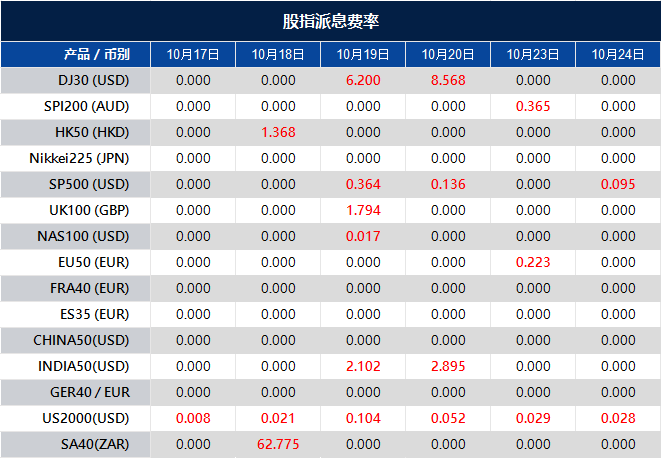
Please note that the dividends of the following products will be adjusted accordingly. Index dividends will be executed separately through a balance statement directly to your trading account, and the comment will be in the following format “Div & Product Name & Net Volume ”.
Please refer to the table below for more details:
The above data is for reference only, please refer to the MT4/MT5 software for specific data.
If you’d like more information, please don’t hesitate to contact [email protected].
In a tumultuous day for the stock market, major indexes, including the Dow Jones Industrial Average, S&P 500, and Nasdaq Composite, saw significant declines as corporate earnings reports fell short of expectations. The 10-year Treasury yield reached levels not seen since 2007, signaling rising interest rates, while mortgage rates hit a two-decade high. Individual companies were impacted by their earnings reports, with some facing notable declines and others, like Procter & Gamble, experiencing stock gains. The market’s focus has now shifted to revenue growth during the earnings season, and geopolitical factors, such as the Israel-Hamas conflict and U.S. President Joe Biden’s visit to Israel, also influenced market sentiment. Meanwhile, in the currency market, the U.S. dollar saw a modest increase, driven by losses in the EUR/USD and GBP/USD pairs. The rise in Treasury yields compared to bunds attracted investors seeking safety amid growing geopolitical risks.
Stock Market Updates
Stocks experienced a decline on Wednesday as corporate earnings reports continued to roll in, and Treasury yields reached multiyear highs. The Dow Jones Industrial Average fell 332.57 points, or 0.98%, to close at 33,665.08. Similarly, the S&P 500 dropped 1.34% to 4,314.60, while the Nasdaq Composite slipped 1.62% to 13,314.30. None of these major indexes traded in positive territory throughout the day. A key development was the 10-year Treasury yield surpassing 4.9%, a level not seen since 2007, signaling rising interest rates. Simultaneously, the average 30-year fixed mortgage rate hit 8%, the highest rate since 2000.
Earnings reports had a notable impact on individual companies’ stock prices. Companies like J.B. Hunt and United Airlines faced significant declines due to disappointing earnings and soft guidance. In contrast, Procter & Gamble’s stock rose after beating analyst expectations. The market’s attention is now shifting to revenue growth during this earnings season, as investors assess which companies are experiencing increased demand and which are merely improving earnings through cost-cutting measures. Additionally, chip stocks faced challenges as restrictions on the sale of advanced artificial intelligence chips to China were announced by the U.S. Department of Commerce, leading to continued selling in the sector. Geopolitical factors, such as the ongoing Israel-Hamas conflict and U.S. President Joe Biden’s visit to Israel, also contributed to market sentiment.
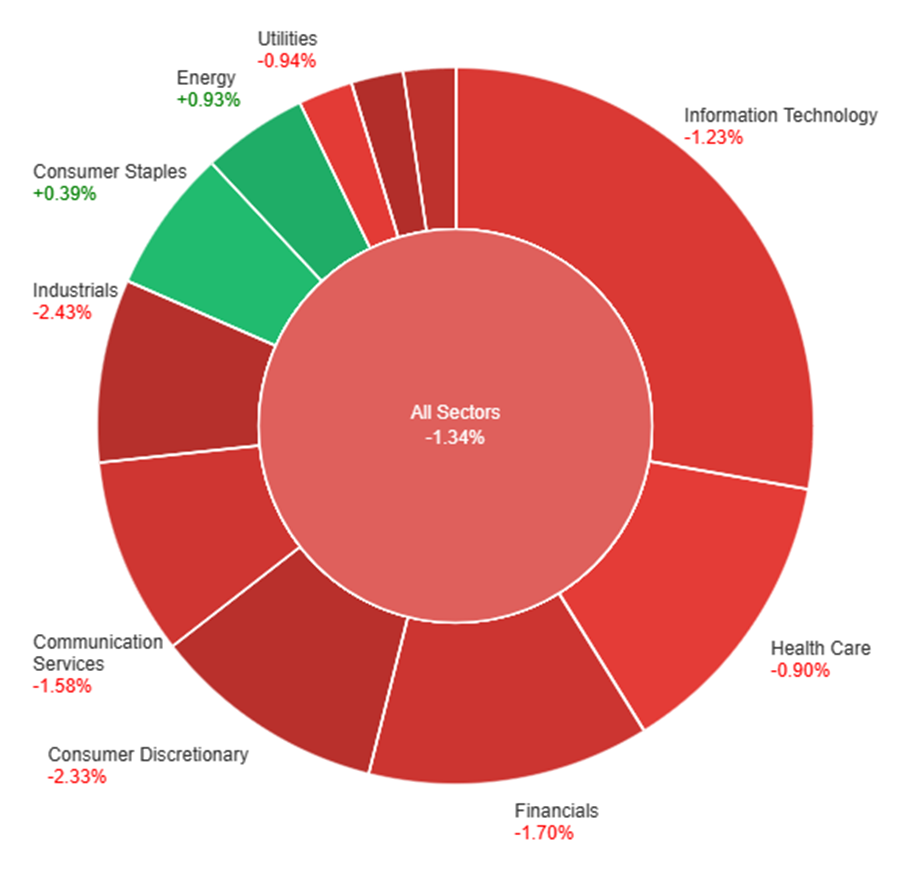
On Wednesday, the overall market experienced a decline of 1.34%. Among the various sectors, there was a mixed performance. Energy and Consumer Staples saw gains of 0.93% and 0.39%, respectively. In contrast, there were losses in several sectors, with the largest declines in Consumer Discretionary (-2.33%), Industrials (-2.43%), and Materials (-2.58%). Other sectors, including Health Care, Utilities, Information Technology, Communication Services, Financials, and Real Estate, also saw losses ranging from -0.90% to -2.18%.
Currency Market Updates
In recent currency market updates, the US dollar experienced a modest increase, with the dollar index rising by 0.16%. This rise was primarily driven by losses in the EUR/USD and GBP/USD currency pairs. The increase in Treasury yields compared to bunds attracted investors seeking safety amid growing geopolitical risks. However, it’s worth noting that the yen and Swiss franc appreciated more against other currencies than the US dollar did, particularly against high-beta currencies. EUR/USD faced a decline of 0.23% as the spreads between 2-year bund and Treasury yields reached their most negative levels since August. Additionally, 10-year spreads were at their lowest point since May 2022, but a late pullback in Treasury yields may influence the overall trend. Notably, there hasn’t been a close below 1.0500 for EUR/USD since October 3.
The market also observed that concerns over the Israel-Hamas conflict potentially impacting energy supplies posed a greater threat to eurozone countries that rely more heavily on energy imports than the United States. Meanwhile, the rise in 2-year Treasury yields was influenced by stronger-than-expected US economic data and comments from Federal Reserve speakers favoring maintaining higher interest rates for an extended period while monitoring economic indicators. Unless the Fed decides to raise rates again in January, which is currently priced at a 50% probability, there may be limited upside left for 2-year yields. Other notable movements included a decline in the British pound (GBP) as risk-off sentiment prevailed, though gilt-treasury yield spreads rebounded slightly due to above-forecast UK inflation data. The Australian dollar and other risk-sensitive currencies also fell, while the Chinese yuan slipped following brief gains on above-forecast Chinese data. Upcoming economic events include jobless claims, existing home sales, and comments from Federal Reserve Chair Jerome Powell.
Picks of the Day Analysis
EUR/USD (4 Hours)
EUR/USD Slips Below Key Moving Average as US Dollar Strengthens Amid Geopolitical Concerns and Soaring Treasury Yields
EUR/USD dropped below the 20-day Simple Moving Average (SMA) as it faced resistance at 1.0600, primarily due to the US Dollar’s overall strength driven by deteriorating market sentiment and rising Treasury yields. The initial boost in market sentiment from positive Chinese growth data was short-lived, with geopolitical concerns taking center stage and further supporting the US Dollar. The 10-year Treasury yield reached its highest level since 2007 at 4.92%, adding to the Greenback’s momentum. The upcoming economic data releases and a speech by Federal Reserve Chair Powell, underscore the continuing bearish trend for the EUR/USD pair due to favorable fundamentals for the US Dollar.
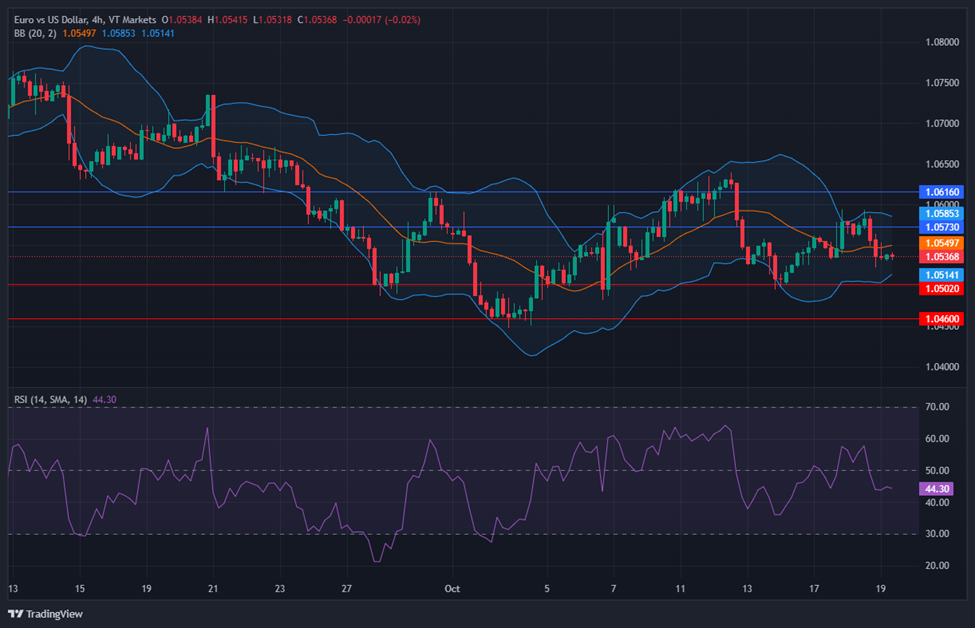
Based on technical analysis, the EUR/USD was slightly lower on Wednesday, pushing towards the middle band of the Bollinger Bands. Currently, the EUR/USD is trading just below the middle band, suggesting the potential for another lower movement. The Relative Strength Index (RSI) stands at 44, indicating that the EUR/USD is still in neutral bias.
Resistance: 1.0573, 1.0616
Support: 1.0502, 1.0460
XAU/USD (4 Hours)
XAU/USD Surges to Two-Month High Amid Escalating Middle East Tensions
Gold (XAU/USD) made a strong resurgence, hitting a fresh two-month high at $1,962.62 per troy ounce as Middle East tensions escalated. Despite some mid-American session retracement to around $1,949, XAU/USD maintained its gains, partly due to the U.S. Dollar’s uptick following a decline in stock markets. Meanwhile, President Joe Biden’s brief visit to Israel further heightened the geopolitical situation in the region. Mixed macroeconomic data, including robust Chinese growth and higher-than-expected UK inflation, added to market uncertainty, leading to a 0.52% decline in the Dow Jones Industrial Average amid a challenging day for earnings reports.
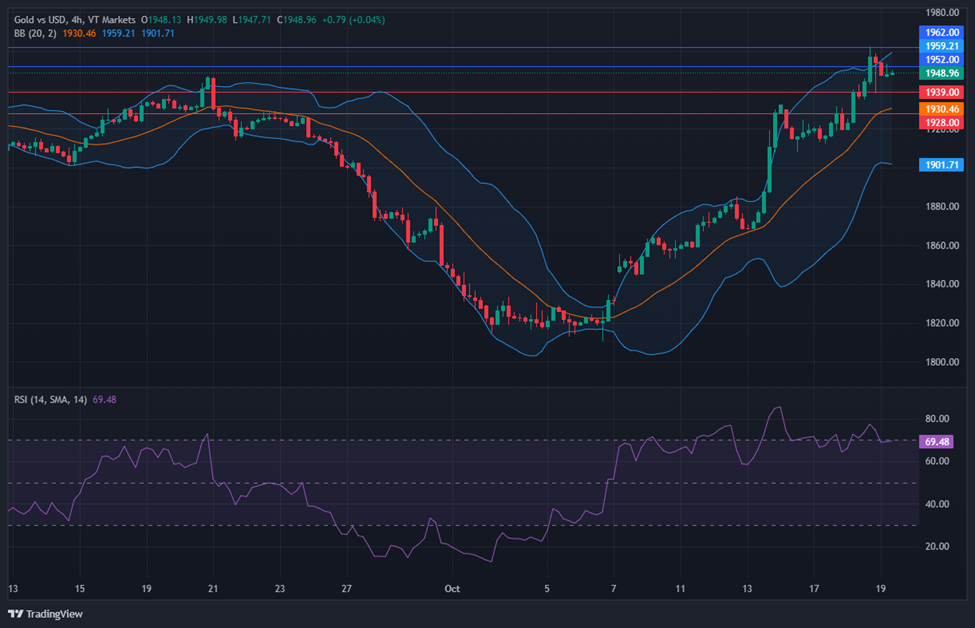
Based on technical analysis, XAU/USD is moving slightly higher on Wednesday and is able to reach the upper band of the Bollinger Bands. Currently, the price of gold is moving just below the upper band, suggesting a possible correction to reach the middle band. The Relative Strength Index (RSI) currently registers at 69, indicating a bullish bias for the XAU/USD pair.
The story of Japanese candlesticks unfolds in 18th century Japan, a time when rice trading was a pivotal economic activity. Merchants and traders required a reliable method to analyse and predict price movements of rice, a commodity of immense importance. This necessity led to the development of what we now know as Japanese candlesticks.
Dojima Rice Exchange in Japan, 18th century source: JPX
Japanese traders, in their quest for a more intuitive and visual way to interpret market movements, created a graphical representation that would later revolutionise the world of financial analysis. The candlestick charting technique was born, allowing them to observe the price action in a structured and insightful manner.
Fast forward to the present day, Japanese candlesticks have become an integral part of technical analysisin financial markets across the globe, particularly in the vast arena of Forex trading. The elegance and effectiveness of this tool have stood the test of time, making it a cornerstone of modern trading strategies.
Understanding Japanese candlesticks is more than just learning about patterns and shapes. It’s about delving into a historical narrative that encapsulates the evolution of financial markets and the human desire to decode the enigma of market behaviour.
By grasping the essence of Japanese candlesticks, traders gain a powerful lens through which they can decipher price movements, enabling them to make informed and strategic trading decisions.
In this guide, we will explore the fundamentals of Japanese candlesticks and equip you with the knowledge needed to navigate the Forex market confidently.
Understanding Japanese Candlesticks
Japanese candlesticks serve as the cornerstone of technical analysis in the realm of Forex trading. These simple yet powerful graphical representations offer invaluable insights into price movements, making them an essential tool for traders.
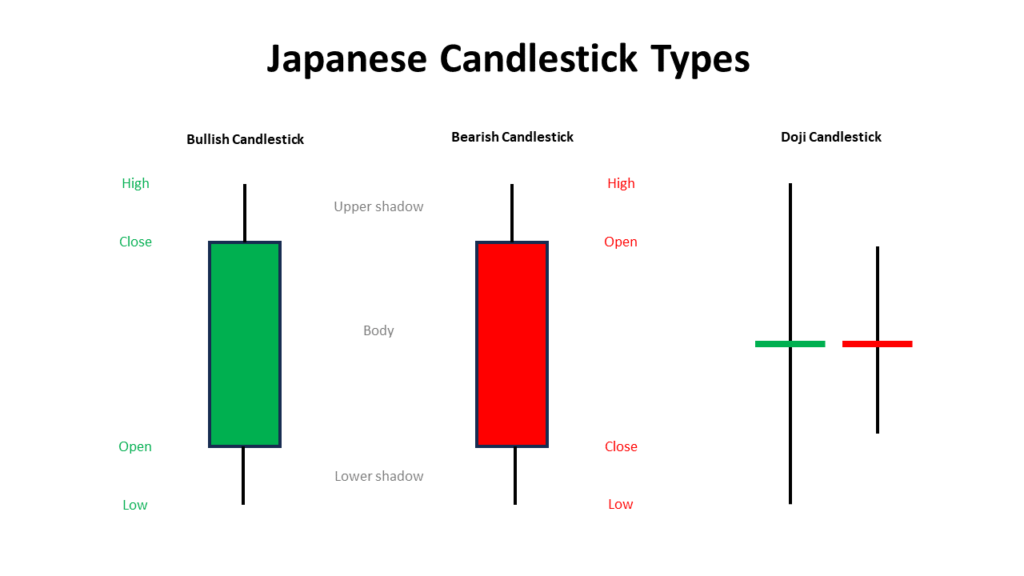
Japanese Candlestick Types
Structure of a Candlestick
A candlestick is like a visual snapshot of the price movement over a specific time period. It encapsulates three crucial components that provide a comprehensive view of market dynamics:
Body: The central, solid part of the candlestick represents the price range between the opening and closing prices during the given time frame. If the closing price is higher than the opening price, the body is typically coloured green or white, indicating a bullish movement. Conversely, if the closing price is lower than the opening price, the body is coloured red or black, indicating a bearish movement.
Wick (Upper and Lower Shadows): The thin lines, often referred to as the wicks or shadows, extend from the body at both ends. The upper shadow denotes the highest price reached during the time period, while the lower shadow represents the lowest price. These wicks help visualise the price fluctuations and volatility.
Shadow: The entire length from the highest point of the upper shadow to the lowest point of the lower shadow is termed as the shadow, signifying the entire price range for that period.
Types of Candlesticks
Candlesticks come in various shapes and forms, each conveying unique market sentiments. They are broadly categorised into three types:
Bullish Candlesticks: These candlesticks signal a price increase during the specified time period. Their bodies are usually green or white, illustrating a positive market sentiment and a potential uptrend.
Bearish Candlesticks: Conversely, bearish candlesticks indicate a price decrease over the designated time frame. Their bodies are commonly red or black, symbolising a negative market sentiment and a potential downtrend.
Doji Candlesticks: The Doji candlestick is a special case where the opening and closing prices are nearly equal, resulting in a very short or non-existent body. Doji candlesticks signify market indecision and often precede significant price movements.
Colour Coding of Candlesticks
Understanding the colour coding of candlesticks aids traders in swiftly identifying market trends and interpreting price movements:
Bullish Candlesticks: Typically, these candlesticks are portrayed in green or white, signifying optimism and an upward price movement.
Bearish Candlesticks: Conversely, bearish candlesticks are usually depicted in red or black, indicating a pessimistic outlook and a downward price movement.
Interpreting Japanese Candlesticks
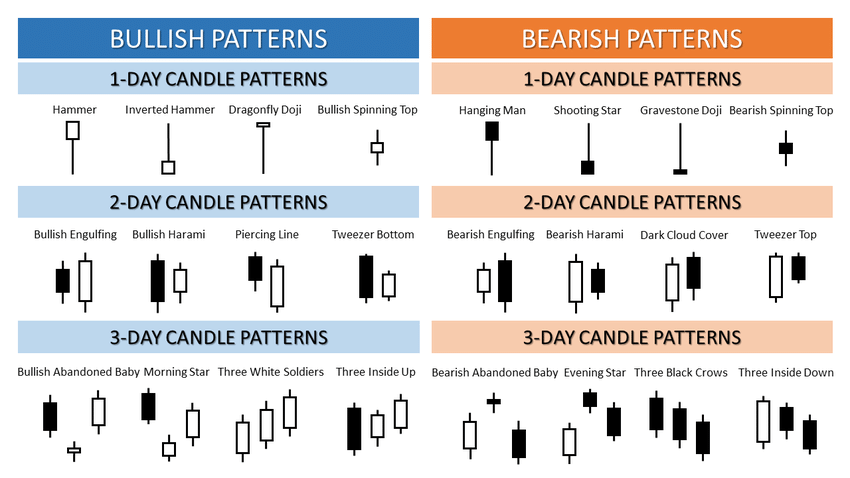
To effectively utilise Japanese candlesticks in Forex trading, understanding common candlestick patterns and their implications is crucial. These patterns can provide valuable insights into market sentiment and potential trend changes, aiding traders in making informed decisions.
Japanese Candlestick Patterns source: ResearchGate
Common Candlestick Patterns
The Doji candlestick is a significant pattern that signifies market indecision. It occurs when the opening and closing prices are very close to each other, resulting in a candlestick with a very short or non-existent body. Doji patterns suggest that neither buyers nor sellers have gained control, often preceding major price movements.
The Hammer candlestick pattern is characterised by a small body at the top and a long lower shadow, resembling a hammer. It typically occurs after a downtrend and signals a potential price reversal. Hammers indicate that sellers drove the price lower during the session, but buyers managed to push the price up, showcasing potential buying interest.
A Shooting Star candlestick pattern is the opposite of a hammer. It has a small body at the bottom and a long upper shadow, resembling an inverted hammer. This pattern occurs after an uptrend and implies a potential bearish reversal. It suggests that although buyers pushed the price higher during the session, sellers entered the market and pushed the price down, indicating potential selling pressure.
The Engulfing candlestick pattern involves one candle completely “engulfing” the previous one. In a bullish engulfing pattern, the first candle is smaller and bearish, followed by a larger bullish candle. This suggests a reversal in the current downtrend. Conversely, a bearish engulfing pattern occurs during an uptrend, indicating a potential reversal to a downtrend.
A Spinning Top candlestick is characterised by a small body and long upper and lower shadows. This pattern reflects market indecision, showcasing a battle between buyers and sellers. Spinning tops suggest that neither buyers nor sellers were able to dominate, leaving the market uncertain about its direction.
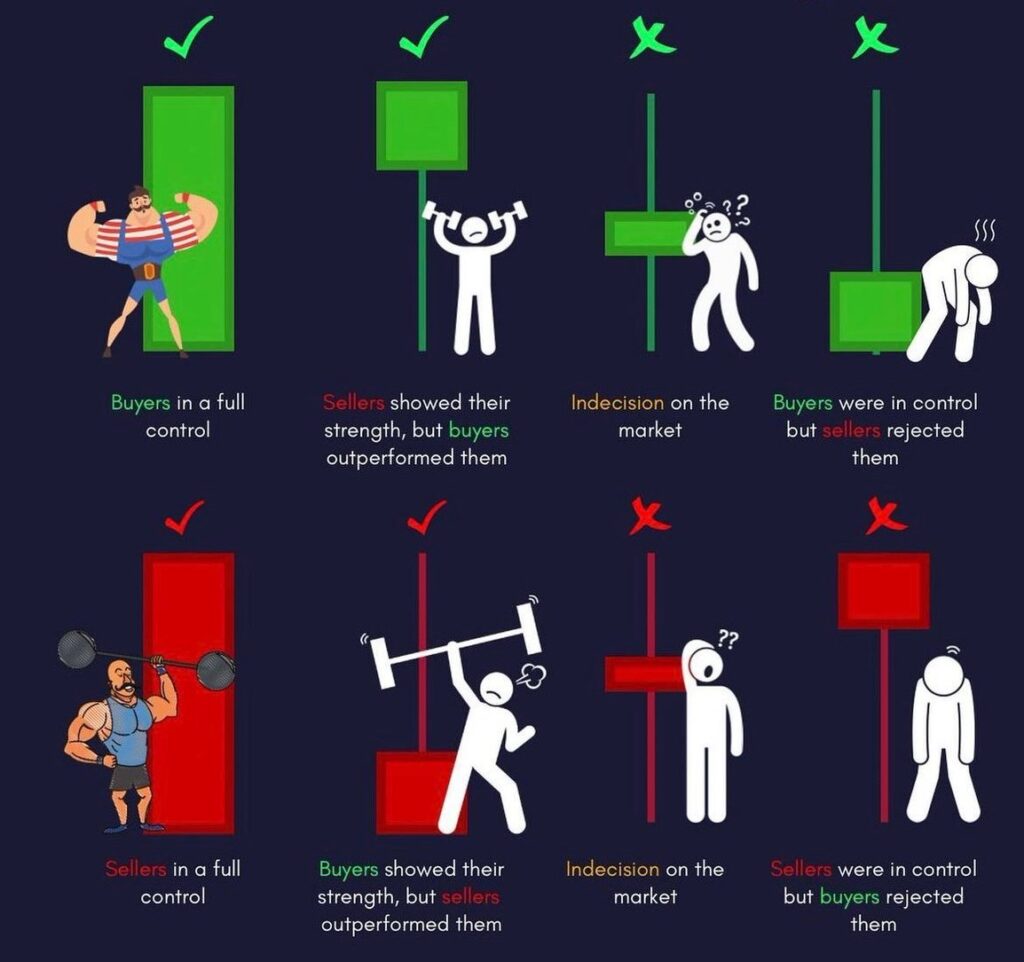
Analysing Length and Shape
Apart from candlestick patterns, the length and shape of the candlestick body and wicks provide additional insights into market sentiment:
Candlestick Body Length: A long bullish (green or white) or bearish (red or black) body indicates strong buying or selling activity during the session, reflecting market conviction.
Wick Length: Long wicks signify price fluctuations and uncertainty. Longer upper shadows indicate potential resistance levels, while longer lower shadows indicate potential support levels.
Japanese Candlesticks Strength source: priceNpedia on x.com
Applying Japanese Candlesticks in Forex Trading
To leverage Japanese candlesticks effectively in your trading strategy, follow these tips:
1. Identify Trends
Identifying Trend Reversals: Look for reversal patterns like the Hammer or Shooting Star after a prolonged trend. For instance, a Hammer after a downtrend could signal a potential trend reversal to the upside.
Spotting Continuation Patterns: Patterns like Bullish or Bearish Engulfing can suggest that the existing trend is likely to continue. If the pattern aligns with the current trend direction, it provides confidence in holding or adding to a position.
2. Combine with Indicators
Moving Averages: Utilise moving averages to identify the overall trend direction. When a candlestick pattern aligns with the moving average direction, it provides a more robust confirmation of potential market movements.
Relative Strength Index (RSI): RSI is excellent for gauging overbought or oversold conditions. When a candlestick pattern suggesting a reversal aligns with RSI indicating an overbought or oversold market, it strengthens the reversal signal.
3. Set Entry and Exit Points
Entry Points: Use bullish patterns like Bullish Engulfing or Hammer as signals to enter a trade, especially if they align with a trend confirmation from other indicators. Place your entry point just above the high of the pattern.
Exit Points: For exit points, utilise bearish patterns like Bearish Engulfing or Shooting Star. These patterns can indicate potential price declines, prompting you to exit a trade. Set your exit point just below the low of the bearish pattern.
Implement Stop-loss and Take-profit Strategies: Always incorporate stop-loss and take-profit levels to manage your risk effectively. Determine your stop-loss based on the pattern’s low for bullish trades and high for bearish trades. Adjust your take-profit levels based on the potential price movement indicated by the pattern.
Common Mistakes and How to Avoid Them
Avoid these common errors to enhance your candlestick analysis:
Overcomplicating Analysis: Keep your analysis simple and focused on the most essential patterns. Overcomplicating can lead to confusion and poor decision-making.
Ignoring Market Context: Consider broader market trends and economic indicators alongside candlestick patterns to make well-informed trading decisions.
Trading Solely Based on Candlestick Patterns: While candlesticks are powerful, relying solely on them can be risky. Always consider a holistic approach to your analysis.
In conclusion, mastering Japanese candlesticks is a fundamental step towards becoming a successful Forex trader. By understanding their structure, interpreting patterns, and applying them effectively, you can gain valuable insights into market sentiment and potential trends. Avoiding common mistakes and integrating candlestick analysis into a comprehensive trading strategy will set you on the path to success in the dynamic world of Forex trading. Keep learning and practicing to refine your skills and achieve your trading goals.
Summary:
Japanese candlesticks, originating in 18th century Japan, are crucial in modern financial analysis, especially in Forex trading.
Understanding candlestick structure and types is vital for interpreting market movements.
Colour coding (green/white for bullish, red/black for bearish) helps identify trends quickly.
Common candlestick patterns provide insights into market sentiment and trend changes.
Analysing length and shape of candlestick components (body, wicks) offers additional market insights.
Applying candlesticks in Forex involves identifying trends, combining with indicators, and setting entry/exit points with stop-loss/take-profit strategies.
Avoid overcomplicating analysis and integrate candlestick analysis into a comprehensive trading strategy for success in Forex trading.
Please note that the dividends of the following products will be adjusted accordingly. Index dividends will be executed separately through a balance statement directly to your trading account, and the comment will be in the following format “Div & Product Name & Net Volume ”.
Please refer to the table below for more details:
The above data is for reference only, please refer to the MT4/MT5 software for specific data.
If you’d like more information, please don’t hesitate to contact [email protected].
The world of trading can sometimes feel near-impossible to navigate. With charts, figures, and strange new jargon at every turn, trying to figure all of this stuff out can be as intimidating as facing off against Thanos himself. Thankfully—in classic comic-book tradition—the heroes are here to save the day. Here are 4 must-know trading concepts, simplified with a little assistance from Marvel’s Avengers:
1. Thor’s Mjolnir: Trading Style
In the Marvel Universe, Thor’s legendary hammer, Mjolnir, can only be lifted by an extremely select few. Of all the super-powered energy blasters and mystical blades on offer, the Asgardian god of thunder has found a weapon almost exclusively suited to him.
As with Thor and the mighty Mjolnir, every trader’s trading methodology should be uniquely suited to them. Depending on factors like capital, appetite for risk, and investment runway, the perfect trading strategy for one trader might be a terrible idea for another.
Conversely to what inexperienced traders might think, there is no magic bullet or one-size-fits-all solution: anything from short-term day trading to longer-term position trading can all yield results—as long as it’s a good fit for an individual’s specific needs and circumstances.
2. Iron Man’s Suit: Risk Management
It’s a trope any fan of Tony Stark will be familiar with: Iron Man finds himself stuck in what seems like a hopeless situation. Just before inevitable doom occurs, Tony’s famous metal suit whirs to life and delivers the perfect solution to get him out of a pinch.
While most of us are unlikely to have a billion-dollar utility suit at the ready, the value of having a backup plan cannot be overstated. For traders who are about to take their first steps into volatile markets, healthy risk management is comparable to the plethora of failsafes and functionalities incorporated into Iron Man’s suit.
By wisely managing capital and sufficiently diversifying their portfolios, traders can ensure that an unforeseen dip in a single asset doesn’t put all of their funds at risk. Much like Iron Man doesn’t rely on his repulsors alone, the savvy trader spreads their resources across a range of contingencies, ensuring they always live to fight another day.
3. Captain America’s Serum: Leverage
Much like the Super-Soldier Serum that transformed frail Steve Rogers into the formidable Captain America, leverage is a game-changing tool that can put great power in the hands of traders. When used judiciously, leverage amplifies your trading potential, allowing you to control larger positions with a smaller amount of capital.
However, just as the serum’s effects can be disastrous if mishandled (remember Red Skull?), leverage can also magnify losses. For instance, 10x leverage means a 1% decline in the asset’s value could lead to a 10% loss—disaster for just about anybody.
Ultimately, just as with Captain America, those who accept this power should do so with a clarity of purpose and full awareness of what they are getting into. Guided by caution, control, and a clear understanding of potential risks, leverage could well be the difference between the desire to succeed and the means to do so.
4. The Hulk’s Transformations: Market Signals
As Bruce Banner often reminds us: you almost certainly won’t like him when he’s angry. Thankfully, there are typically a few warning signs that can give innocent bystanders a chance to seek cover before any Hulk-smashing ensues.
For the most part, Bruce only transforms into the Hulk when triggered by specific stimuli like anger or stress. Additionally, the transformations aren’t instantaneous, involving a violent metamorphosis from mild-mannered scientist to rampaging behemoth courtesy of Marvel magic.
Should you ever find yourself in the vicinity of a real-life Hulk, all of these signs should (hopefully) give you enough time to run for safety. Similarly, traders who are able to recognise market signals can often identify calamity drawing near, giving themselves a chance to escape before it’s too late.
While detecting these signals could involve identifying complex patterns on trading charts, it can often also be as simple as watching out for major economic events in the news. For instance, if a specific sector is going through a rough patch, it would stand to reason that assets tied to that sector are likely to drop in price. If this isn’t straightforward enough, traders can also just rely on our daily market analyses for a quick roundup of the day’s most significant economic events. We’re pretty sure even the Hulk himself would be pleased with that.
Ready to start your own superheroic trading journey? Open your live account now—5 minutes is all it takes.
Stock futures showed a slight decline in anticipation of crucial financial reports, with Dow Jones Industrial Average futures falling by 0.1% and both S&P 500 and Nasdaq-100 futures edging lower by the same margin. United Airlines and J.B. Hunt faced notable declines due to soft guidance and disappointing results, respectively. As earnings season continues, companies are exceeding earnings and sales expectations, while investors are closely monitoring interest rates. In the currency market, the US dollar remained stable despite brief fluctuations, the EUR/USD pair saw a minimal increase, and the GBP/USD pair depreciated due to concerns about the UK’s economic conditions. The USD/JPY pair recorded modest gains, influenced by various factors, including monetary policies and the situation in the Israel-Hamas conflict. Federal Reserve Chair Jerome Powell’s statements later in the week are eagerly anticipated.
Stock Market Updates
In the stock market update, stock futures showed a slight decline as Wall Street was anticipating key financial reports. Dow Jones Industrial Average futures dipped 0.1%, or 37 points, while S&P 500 futures and Nasdaq-100 futures both edged lower by 0.1%. Notable stocks that faced declines included United Airlines, which fell more than 4% due to soft guidance, and J.B. Hunt, which lost more than 3% due to disappointing results. The previous trading session saw modest movement, with the Dow Jones Industrial Average rising 0.04%, the S&P 500 inching 0.01% lower, and the Nasdaq Composite falling 0.25%. Bond yields rose on stronger-than-expected September retail sales, and the yield on the 10-year U.S. Treasury note reached its highest level since October 6. Chip stocks like Nvidia and Advanced Micro Devices declined as the U.S. announced plans to tighten restrictions on AI chip exports to China. Wall Street was also monitoring the impact of the Israel-Hamas conflict and analyzing third-quarter earnings reports, with many companies surpassing earnings and sales expectations.
As earnings season continues, the outlooks and the direction of interest rates will play a crucial role in determining the near-to-intermediate term direction of stocks. So far, 83% of companies have exceeded earnings expectations, and approximately 70% have exceeded sales estimates. The reporting season continued with results expected from Morgan Stanley, Procter & Gamble, and Travelers before the opening bell on Wednesday, with Netflix and Tesla set to release their results after the market close. Additionally, the market was awaiting housing starts and building permits data for September on the economic front.
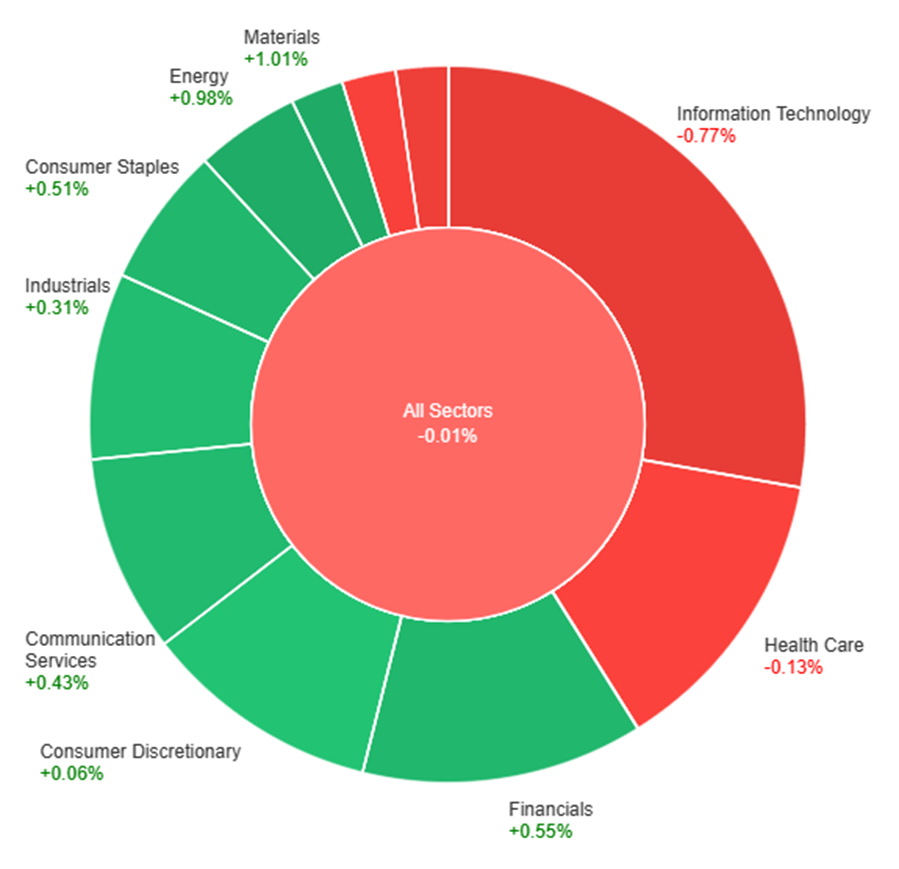
On Tuesday, the overall performance of the stock market showed a slight decline of 0.01%. Among the sectors, Materials and Energy had the most significant gains, with increases of 1.01% and 0.98%, respectively. Financials and Consumer Staples also saw positive returns, rising by 0.55% and 0.51%. Communication Services and Industrials followed with smaller gains of 0.43% and 0.31%. Consumer Discretionary had a marginal increase of 0.06%. However, Health Care, Utilities, Real Estate, and Information Technology sectors all experienced declines, with Health Care and Utilities decreasing by 0.13% and 0.24%, respectively, and Real Estate and Information Technology declining by 0.54% and 0.77%.
Currency Market Updates
In recent currency market updates, the US dollar remained relatively stable despite a brief dip. This stability came despite favorable US data, except for a miss in the NAHB data. The dollar has been consolidating its substantial gains since July. The Federal Reserve’s stance that rising Treasury yields have diminished the necessity for another interest rate hike has contributed to this consolidation. The EUR/USD pair experienced a minimal 0.01% increase. It briefly dipped in response to unexpectedly strong US retail sales data but subsequently rebounded to reach a high of 1.0595 on EBS. However, it faced resistance just below the 1.0600 level and along the downtrend line from July’s highs. To initiate a more significant correction to the upside, a close above October’s high at 1.0640 is required.
The GBP/USD pair depreciated by 0.35% due to concerns over the UK’s economic conditions, particularly amid upcoming inflation data. Meanwhile, the USD/JPY pair recorded a 0.2% rise but struggled to surpass the high established on October 3, 2023, at 150.165, as well as the more formidable 32-year peak from 2022 at 151.94. The modest gains were attributed to growing spreads between Treasury and JGB yields, even as 10-year JGB yields reached their highest point since 2013 at 82bp, nearing the Bank of Japan’s hard yield cap of 100bp. Speculation regarding the Bank of Japan raising its inflation forecasts, the divergence in monetary policies, and the possibility of Ministry of Finance (MoF) foreign exchange intervention all played a role in these developments. Additionally, market participants continue to monitor the situation in the Israel-Hamas conflict and eagerly await statements from Federal Reserve Chair Jerome Powell and other policymakers regarding monetary policy later this week.
Picks of the Day Analysis
EUR/USD (4 Hours)
EUR/USD Surges Despite Positive US Data and Rising Treasury Yields; ECB Policy Meeting Looms
The EUR/USD pair defied positive US economic data and surging Treasury yields on Tuesday, reaching a high of 1.0595 before retreating slightly. The Eurozone exhibited encouraging signs with the ZEW survey reporting an improved Eurozone Sentiment Index, while the German ZEW also exceeded expectations. The European Central Bank (ECB) is expected to maintain its interest rates unchanged next week. Although both US and European bond yields increased significantly, the robust US data may limit the EUR/USD pair’s upside potential, as it experienced a brief drop before reversing course. Upcoming economic indicators and the ECB meeting will likely continue to influence this currency pair.
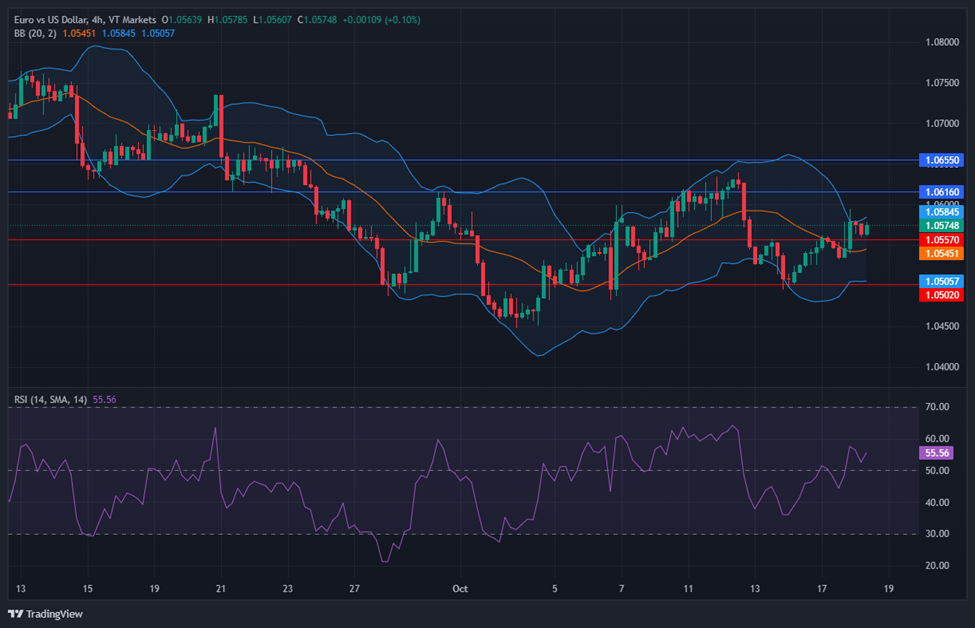
Based on technical analysis, the EUR/USD was slightly higher on Tuesday, pushing towards the upper band of the Bollinger Bands. Currently, the EUR/USD is trading just below the upper band, suggesting the potential for another higher movement. The Relative Strength Index (RSI) stands at 55, indicating that the EUR/USD is still in neutral bias.
Resistance: 1.0616, 1.0655
Support: 1.0557, 1.0502
XAU/USD (4 Hours)
XAU/USD Rebounds to Weekly High as Strong US Data Boosts Market Sentiment Despite Rising Bond Yields
In the world of precious metals, spot Gold (XAU/USD) made a significant recovery, trading around $1,923 per troy ounce and hitting a fresh weekly high of $1,913.57, though still slightly below the previous week’s peak. The rally was fueled by upbeat US data, including a 0.7% increase in September Retail Sales, surpassing market expectations, and positive reports on Capacity Utilization and Industrial Production. Meanwhile, global concerns over inflation eased as New Zealand and Canada reported declining inflation rates, providing a further boost to market sentiment. However, rising government bond yields, particularly the 10-year Treasury note, which reached 4.80%, tempered the decline of the US Dollar.
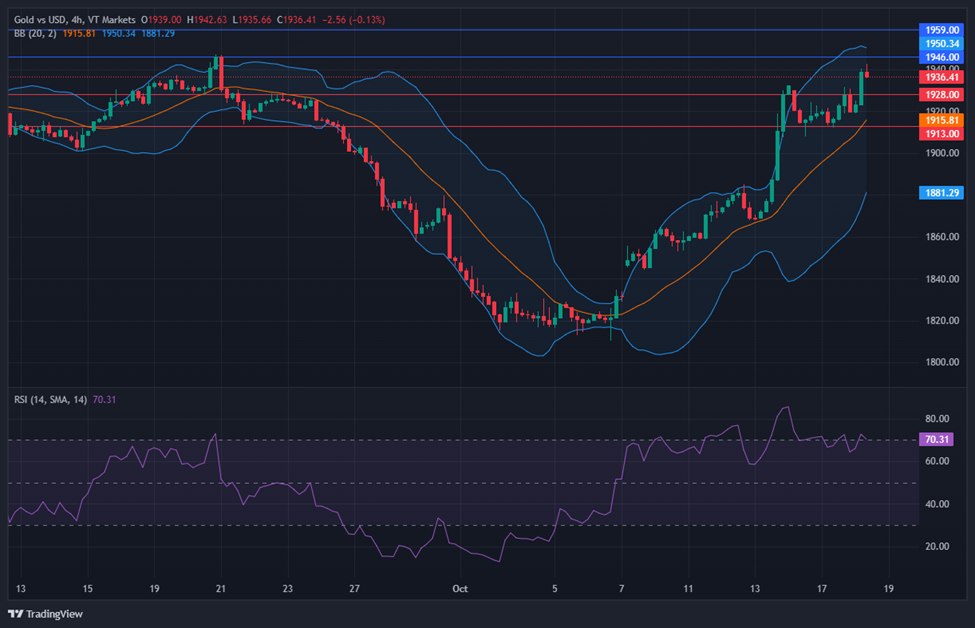
Based on technical analysis, XAU/USD is moving slightly higher on Tuesday and consolidating between the upper and middle bands of the Bollinger Bands. Currently, the price of gold is moving higher with the potential of reaching the upper band. The Relative Strength Index (RSI) currently registers at 70, indicating a bullish bias for the XAU/USD pair.
Silver, often referred to as the “poor man’s gold,” has captivated traders and investors for centuries due to its unique characteristics and historical significance. Recently, it has gained attention as an alternative investment, aligning with the growing interest in precious metals amid economic uncertainties and inflation concerns, highlighting its potential as a viable trading option. The current estimated market cap of silver stands at approximately $1.3 trillion.
Silver bullion bars source: Share Market Express
Traders utilise silver for diverse purposes such as investment, speculation, and hedging against economic volatility. It acts as a potential store of value and a hedge against inflation, appealing to those diversifying portfolios or managing risk during uncertain economic times.
In this guide, we will delve into the world of silver trading, offering valuable insights and essential knowledge for those embarking on their silver trading journey.
Historical Significance of Silver
Silver, often referred to as the “white metal,” boasts a rich historical legacy dating back thousands of years. Its journey from ancient civilisations to the modern world is deeply entwined with human society and economic development.
Silver has been a prized commodity since ancient times. In Mesopotamia around 2500 BC, the first known silver mines were established, signifying the early recognition of silver’s value. It was used for various purposes, including as jewellery, utensils, and as a form of currency.
Silver’s role as a medium of exchange evolved across civilisations. The Greeks, Romans, and other ancient civilisations used silver in their coinage systems. The Roman denarius, for instance, was a widely recognised silver coin. In medieval Europe, the ‘Troy pound’ of silver emerged as a standard measurement, emphasising its importance in trade and commerce.
Ancient Greece silver coins source: CoinsHome.net
During the 19th and early 20th centuries, many nations adopted the silver standard, tying their currency values to a specific amount of silver. The United States, for example, had a bimetallic standard where both gold and silver were used to back the value of the dollar. However, due to economic challenges, many countries later shifted to the gold standard.
The Industrial Revolution in the 18th century brought about a transformation in silver’s significance. Its exceptional electrical conductivity and other physical properties made it crucial for various applications. Silver became an essential component in photography, electronics, batteries, and more. This transition from primarily being a monetary asset to an indispensable industrial metal significantly impacted its demand and market dynamics.
In contemporary times, silver’s historical significance continues to influence its trading appeal. Traders and investors appreciate silver not only for its industrial applications but also for its enduring value as a precious metal. This dual nature positions silver as a unique and versatile asset in the modern financial landscape.
Understanding Silver as a Commodity
Silver, a unique commodity, combines both precious and industrial metal qualities. This dual identity drives diverse demand and holds a crucial role in various industries.
A miner with a silver nugget source: The Motley Fool:
Historically treasured for its rarity and aesthetic appeal, silver’s shiny appearance and scarcity make it a preferred material for crafting jewellery, ornaments, and prized artifacts. In industry, its exceptional conductivity is indispensable for electronics, solar panels, medical devices, and chemical production. Additionally, silver’s reflective properties make it a fundamental component in specialised mirrors.
Several factors influence the prices of silver, making it essential for traders and investors to stay informed and analyse these aspects for effective decision-making in the silver market.
Supply and Demand Dynamics
The interplay between the supply and demand for silver is a fundamental determinant of its price. Factors such as mining production, recycling rates, industrial demand, and investor interest all impact the overall supply and demand equilibrium.
Geopolitical Events
Silver prices can be significantly influenced by geopolitical events, including political instability, wars, trade tensions, and policy changes. These events can create uncertainty in the market, affecting both demand and supply.
Economic Indicators
Key economic indicators like GDP growth, employment rates, inflation, and monetary policies directly affect silver prices. Silver often experiences increased demand during times of economic growth and stability.
Technological Advancements
Technological advancements play a vital role in shaping silver’s demand. Emerging technologies that rely on silver, such as electric vehicles and renewable energy solutions, can substantially impact its price.
The Gold-Silver Ratio
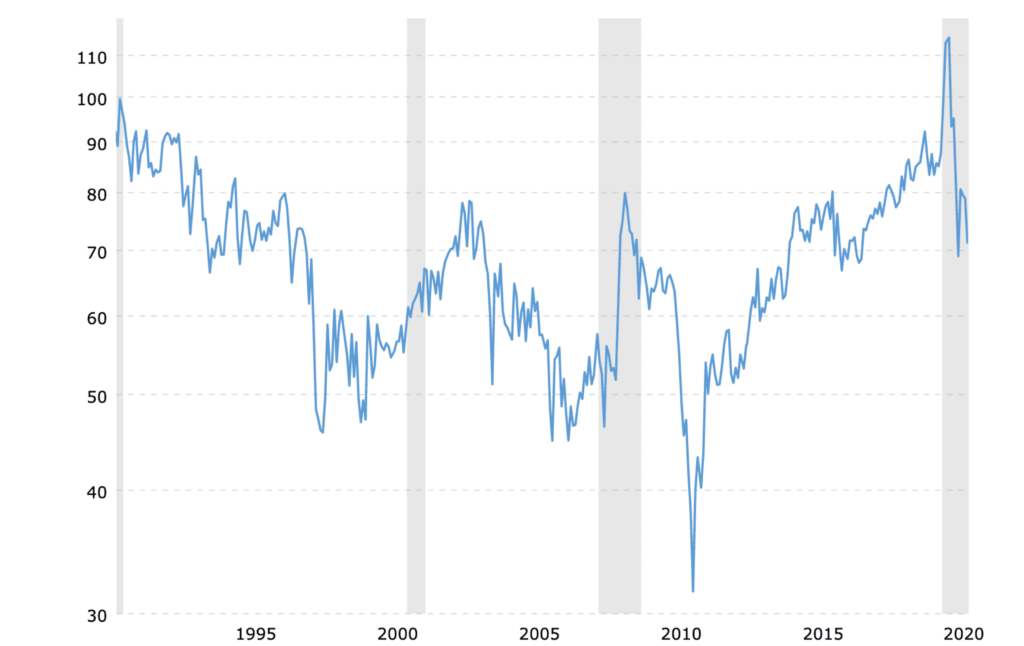
The gold-silver ratio is a fundamental metric in silver trading, indicating the amount of silver needed to purchase one ounce of gold. This ratio is a valuable tool for traders, offering insights into market sentiment and potential overbought or oversold conditions in the silver market.
The gold-silver ratio source: Commodity.com
A higher ratio implies that silver is undervalued compared to gold, suggesting it might be an opportune time to buy silver or sell gold. Conversely, a lower ratio suggests silver is overvalued compared to gold, potentially signalling an opportunity to sell silver or buy gold.
Traders utilise this ratio to strategise their investments, deciding whether to focus on gold or silver based on market conditions. Additionally, shifts in the gold-silver ratio can reflect broader economic trends and investor sentiment, offering valuable insights for traders navigating the silver market.
Correlation with Other Markets
Understanding the correlation between silver and other markets is crucial for predicting price movements and making informed trading decisions in the silver market.
Silver has significant correlations with various markets, including:
Precious Metals Market: Silver shares a close relationship with other precious metals like gold and platinum. It often follows similar trends due to its status as a precious metal.
Commodities Market: Silver’s price can be affected by the broader commodities market, especially other industrial metals. Economic indicators influencing the commodities market often have an indirect impact on silver.
Stock Market: There can be a correlation between the stock market’s performance and silver prices. During economic uncertainties, investors may turn to silver as a safe-haven asset, impacting its demand and price.
Silver market correlation source: Investopedia
What is the Silver Market?
Various avenues exist for trading silver, each offering unique opportunities and considerations. Understanding the diverse forms of silver trading and their respective advantages and risks is essential for navigating the silver market effectively.
Physical Silver
Involves purchasing and owning tangible silver bars, coins, or jewellery. Provides ownership and acts as a hedge against inflation. Requires storage and insurance for safeguarding the physical silver.
Advantages: Ownership, hedge against inflation.
Risks: Storage and insurance requirements, potential for physical damage or loss.
Spot Silver
Involves buying or selling silver at the current market price for immediate delivery. Provides immediate transactions, enabling quick buying or selling of silver.
Involves agreeing to buy or sell silver at a predetermined future date for a set price. Provides price stability and a defined contract for future transactions.
Allow traders to invest in silver without owning physical silver by tracking the performance of silver prices. Offer diversification within the silver market without direct ownership.
Advantages: Diversification, no need for physical storage.
Risks: Market risk, management fees.
Silver Stocks
Involve investing in shares of silver mining companies, providing indirect exposure to silver by owning shares in silver production companies. Traders can benefit from the performance of silver mining companies’ stocks.
Advantages: Exposure to silver mining industry, potential dividends.
Enable traders to speculate on silver price movements without owning the actual silver. Provide leverage, allowing traders to potentially amplify gains, but they carry varying levels of risk due to leverage.
Advantages: Potential for higher returns due to leverage.
Risks: High leverage risk, potential losses exceeding initial investment.
Forex trader source: Canva
How to Trade Silver with VT Markets?
When it comes to venturing into the silver market, having a reliable and regulated broker is paramount. VT Markets offers silver spot and CFD trading with tight spreads, low commissions, and leverage of up to 100:1.
Start trading with VT Markets today by following these three simple steps:
1. Register: Select your preferred account type and submit your application.
2. Fund: Choose from a variety of methods to fund your account.
3. Trade: Select silver in the Precious Metals section or explore more than 1000 instruments across all asset classes.
Additionally, you can test your silver trading strategies with our risk-free demo account. Wishing you the best of luck!
In conclusion, trading silver offers a diverse range of opportunities for both seasoned and novice traders. By understanding the historical significance, dual nature, and trading dynamics of silver, and by following effective trading strategies and risk management, you can successfully navigate the silver market. Consider partnering with reputable brokers like VT Markets to enhance your trading experience and embark on your silver trading journey with confidence and knowledge. Happy trading!
Summary:
Traders use silver for investment, speculation, and hedging against economic volatility, valuing it as a store of value and a hedge against inflation.
Factors influencing silver prices include supply and demand dynamics, geopolitical events, economic indicators, and technological advancements.
The gold-silver ratio is a crucial metric in silver trading, indicating the amount of silver needed to purchase one ounce of gold, offering insights into market sentiment and potential trading strategies.
Silver has correlations with the precious metals market, commodities market, and stock market, affecting its price movements.
Various forms of silver trading exist, including physical silver, spot silver, silver futures, silver ETFs, silver stocks, and silver CFDs, each with its advantages and risks.
Please note that the dividends of the following products will be adjusted accordingly. Index dividends will be executed separately through a balance statement directly to your trading account, and the comment will be in the following format “Div & Product Name & Net Volume ”.
Please refer to the table below for more details:
The above data is for reference only, please refer to the MT4/MT5 software for specific data.
If you’d like more information, please don’t hesitate to contact [email protected].
On Monday, the stock market surged as traders eagerly awaited corporate earnings reports, pushing the Dow Jones Industrial Average to its best day since September. Despite concerns about rising Treasury yields, oil prices, inflation, and conflicts in the Middle East, investors were focusing on earnings reports, offering short-term optimism. The US dollar faced a decline due to geopolitical tensions, while the British pound rose, reflecting increased risk appetite. Meanwhile, the currency market monitored the USD/JPY pair and the movements in Treasury-JGB yield spreads, with expectations of higher interest rates driving the push towards a significant breakout at 150. Additionally, the Aussie, Kiwi, and Polish zloty all saw gains.
Stock Market Updates
On Monday, the stock market saw a positive surge as traders eagerly anticipated a wave of corporate earnings reports, seemingly unfazed by an increase in Treasury yields. The Dow Jones Industrial Average experienced its best day since September, climbing 314.25 points, or 0.93%, to close at 33,984.54. Likewise, the S&P 500 recorded a 1.06% gain, ending the day at 4,373.63, and the Nasdaq Composite rose by 1.2% to reach 13,567.98. Leading the Dow’s ascent were Nike and Travelers Companies, both posting gains of approximately 2.1%, while all 11 S&P 500 sectors traded higher during the session. Earnings season was set to intensify, with 11% of the S&P 500 slated to report results, including notable names like Johnson & Johnson, Bank of America, Netflix, and Tesla. A focus on earnings reports was offering investors optimism in the short term, amid concerns about rising yields, oil prices, inflation, and conflicts in the Middle East.
Although the previous week had been marked by mixed performance in the stock market, with the S&P 500 experiencing a 0.5% gain for its second consecutive positive week and the Dow gaining 0.8%, it appeared that the market was beginning to normalize after reacting to geopolitical surprises. Despite potential volatility into the year’s end, investors were increasingly focusing on the fundamentals and corporate performance as the market appeared to adapt to recent uncertainties in the geopolitical landscape.
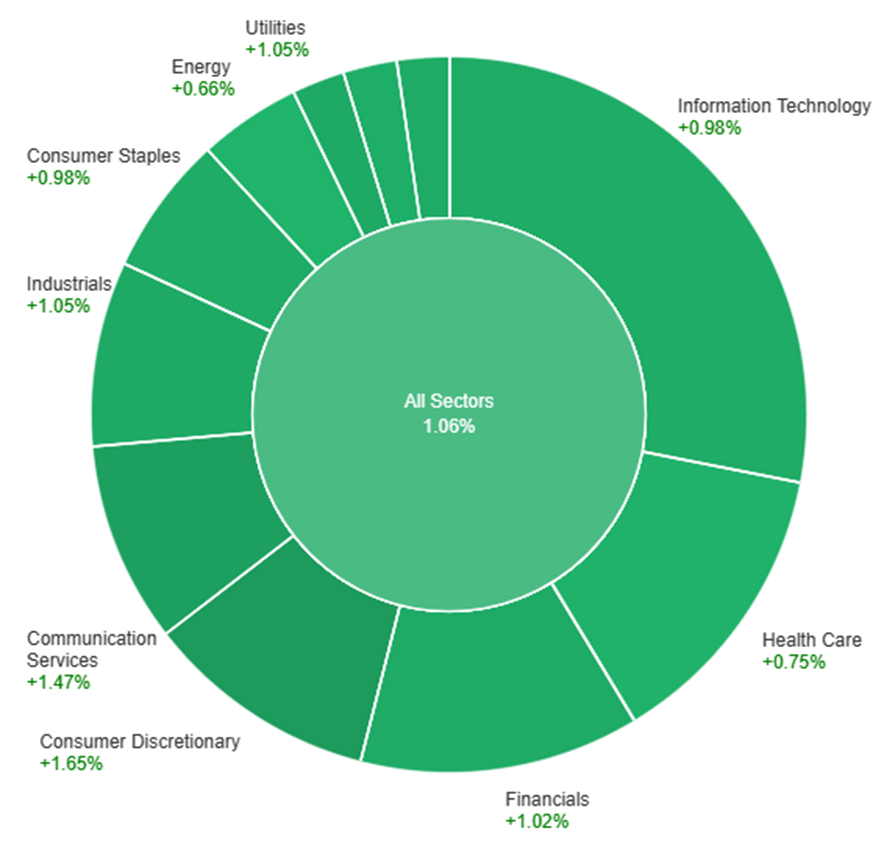
On Monday, across all sectors, the market experienced a positive trend with an overall increase of 1.06%. The highest gains were observed in the Consumer Discretionary sector, which saw a rise of 1.65%, followed by Communication Services at 1.47%, and Industrials at 1.05%. Other sectors also saw positive but relatively smaller gains, such as Utilities, Real Estate, Financials, Consumer Staples, Information Technology, Materials, Health Care, and Energy, with increases ranging from 0.66% to 0.98%.
Currency Market Updates
In the currency market, the US dollar faced a decline of 0.37% as part of a broader retreat triggered by widespread derisking flows, largely connected to the Israel-Hamas conflict. This geopolitical tension had previously bolstered the US dollar late in the previous week. Despite a slight dip in bund-Treasury yield spreads, the EUR/USD pair managed to rise by 0.4% during this period, as demand for the safe-haven US dollar diminished. Notably, this surge came after eleven consecutive weeks of losses for the EUR/USD pair, a trend potentially signaling an oversold condition. It was also noted that the market sentiment had shifted, with expectations of the Federal Reserve halting its interest rate hikes.
On a similar note, the British pound (GBP) witnessed a 0.55% rise, benefiting from increased risk appetite and wider gilts-Treasury yield spreads. Huw Pill, the Chief Economist of the Bank of England (BoE), issued a warning against prematurely declaring victory over inflation. Sterling traders were anticipating the release of UK inflation data, with market expectations leaning towards the BoE being the sole major central bank likely to implement rate hikes. This expectation effectively ruled out the possibility of a UK rate cut until late 2024. Meanwhile, the USD/JPY pair remained relatively unchanged, lingering below the peak observed in October 2023 at 150.165 and the significant resistance point at 151.94, which had last been reached in 2022. The market was closely monitoring the movements in Treasury-JGB yield spreads, as they played a pivotal role in the carry trade dynamics of the currency pair. Strong US retail sales and other data that fueled expectations of higher interest rates from the Federal Reserve appeared to be the key factor driving the push towards a significant breakout at 150, with 151.94 serving as a major resistance level. Additionally, the absence of Japanese foreign exchange intervention was a critical piece of the puzzle in this scenario. Amid these developments, the Australian and New Zealand dollars, colloquially known as the Aussie and Kiwi, rose by approximately 0.7% as risk appetite rebounded in the market. Furthermore, the Polish zloty witnessed a remarkable increase of 2.2% following weekend election results that were perceived as likely to lead to improved relations within the European Union (EU).
Picks of the Day Analysis
EUR/USD (4 Hours)
EUR/USD Edges Higher Amid Middle East Tensions and Economic Uncertainty
The EUR/USD pair saw a slight uptick, reaching 1.0554 on Monday as it closed trading below this peak. A stronger US Dollar at the start of the week, driven by ongoing Middle East tensions, initially led to a demand for safety. However, as the day progressed, the USD weakened against major currencies. The escalating conflict in the Middle East, marked by attacks from Hezbollah in addition to the ongoing Israel-Palestine conflict, created global economic uncertainty and added pressure on central banks. Data releases were limited, with Germany’s Wholesale Price Index edging up, the Euro Zone showing an improved trade balance, and the US reporting a decline in the NY Empire State Manufacturing Index. Upcoming releases include Germany’s ZEW Survey on Economic Sentiment and US Retail Sales for September, Industrial Production, Capacity Utilization, and Business Inventories for August.
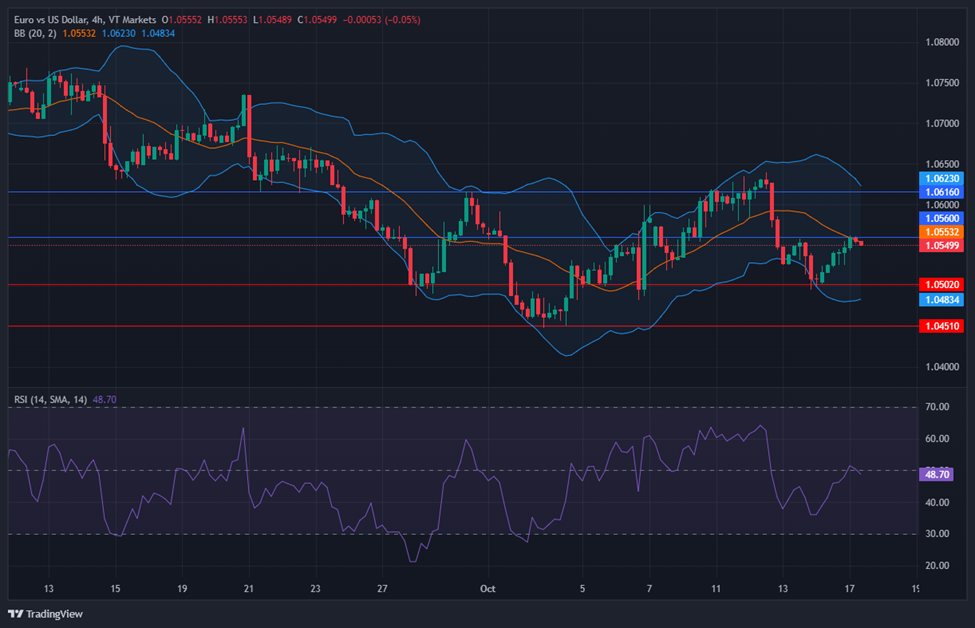
Based on technical analysis, the EUR/USD was slightly higher on Monday, pushing towards the middle band of the Bollinger Bands. Currently, the EUR/USD is trading at the middle band, suggesting the potential for a consolidating move. The Relative Strength Index (RSI) stands at 48, indicating that the EUR/USD is back to neutral bias.
Resistance: 1.0560, 1.0616
Support: 1.0502, 1.0451
XAU/USD (4 Hours)
XAU/USD Faces Volatility Amid Geopolitical Tensions and Fragile Market Sentiment
Spot Gold, represented as XAU/USD, started the week with a gap lower, retreating from a recent multi-week high. Geopolitical concerns in the Middle East, particularly the escalating conflict between Israel and Hamas, kept financial markets on edge. However, the demand for the US Dollar decreased during European trading hours, allowing XAU/USD to recover around the $1,920 price range. While US stock markets posted gains, the market sentiment remains delicate due to uncertainty in the economic outlook and future monetary policies. Major central banks have paused tightening, but the potential for additional rate hikes lingers, given persistent inflationary pressures. This week’s inflation reports from New Zealand, Canada, and the UK will play a crucial role in determining the precious metal’s performance in the face of mounting price pressures.
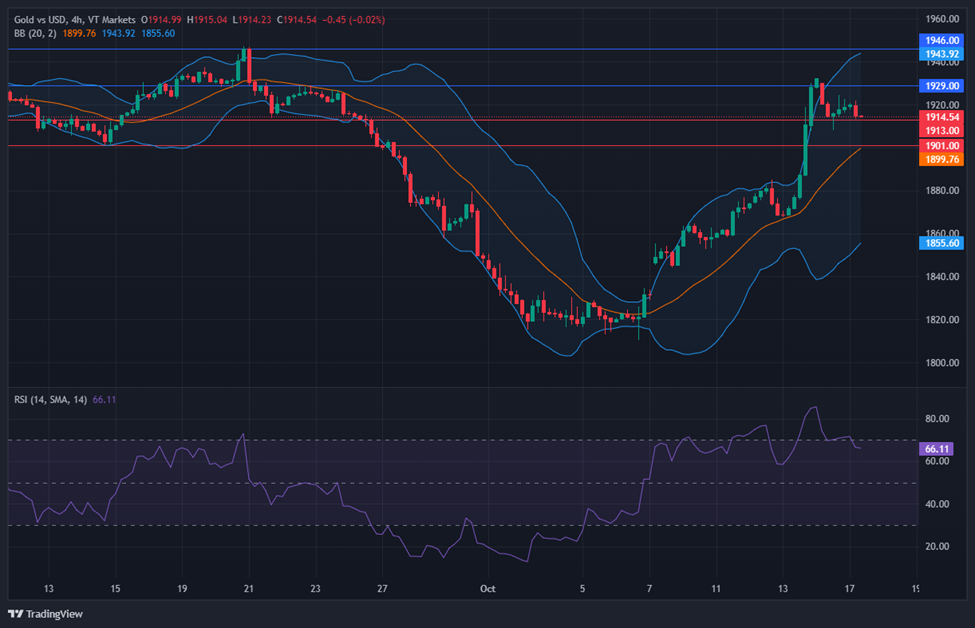
Based on technical analysis, XAU/USD is moving slightly lower on Monday and consolidating between the upper and middle bands of the Bollinger Bands. Currently, the price of gold is still moving near the support level with the potential of moving lower. The Relative Strength Index (RSI) currently registers at 66, indicating a bullish bias for the XAU/USD pair.