Back

From stocks to share CFDs: Your roadmap to profitable trading 

In the shadows of the 17th-century Amsterdam, a groundbreaking financial experiment unfolded, forever altering the course of economic history. The year 1602 saw the birth of the Amsterdam Stock Exchange, a brainchild of the Dutch East India Company, marking the world’s inaugural official stock exchange. 

The Amsterdam Stock Exchange
source: The Low Countries

Under the canopy of a buttonwood tree on Wall Street, 24 stockbrokers laid the groundwork for organised securities trading, introducing the novel concept of issuing shares to the public. 

Fast forward to today, where the once humble origins have burgeoned into a global financial behemoth. With a staggering size surpassing $100 trillion, the modern stock market stands as a testament to the enduring legacy of those early investors and the evolution of financial markets through centuries. 

Whether you’re a novice or a seasoned investor, understanding the basics is key to navigating the complexities of the stock market. In this comprehensive guide, we’ll delve into the essentials of stocks and Share CFDs, with a special focus on popular trading strategies. 

source: ABC News

Stocks: Unlocking Ownership and Dividend Potential 

At its core, a stock symbolises ownership in a company, with popular names like Apple (AAPL), Microsoft (MSFT), Amazon (AMZN), and Google’s Alphabet (GOOGL) exemplifying this ownership’s profound impact. Investors holding these stocks actively participate in globally influential companies. 

Beyond theoretical ownership, shareholders hold significant rights. This includes voting on corporate decisions and attending pivotal annual shareholder meetings, allowing active engagement in corporate governance. 

Stock ownership’s allure extends to the potential for dividends, a feature prominent in dividend-paying stocks like Johnson & Johnson (JNJ), Coca-Cola (KO), Procter & Gamble (PG), and McDonald’s (MCD). These stocks appeal to investors seeking a steady income stream, enhancing the overall return on investment. 

In essence, owning stocks aligns investors with a company’s success and prosperity. It’s not just financial; it’s a connection to brands and businesses shaping our daily lives. Investors in these well-known companies become integral contributors to ongoing success and innovation in the business world. 

Stock Exchanges: The Pulsating Heart of Global Trading 

Major stock exchanges worldwide serve as the epicentres where the world’s most influential stocks are bought and sold, shaping the landscape of global finance. Two giants stand out in this domain – the New York Stock Exchange (NYSE) and NASDAQ. 

The Largest Stock Exchanges in the World 2023
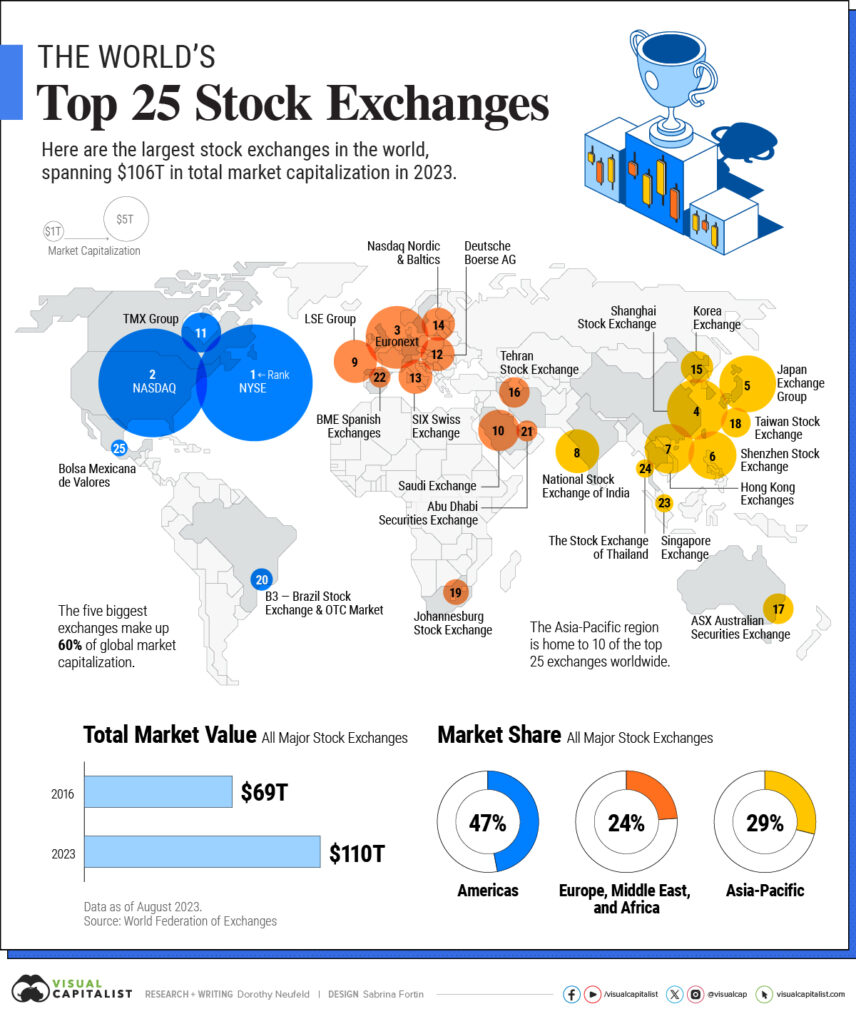
source: Visual Capitalist

The New York Stock Exchange (NYSE), located on Wall Street in New York City, is the largest and most prestigious stock exchange globally. It boasts a rich history dating back to 1792, providing a platform for some of the most prominent and established companies. 

NASDAQ, on the other hand, is renowned for its technology-focused listings and electronic trading platform. Born in 1971, it has become synonymous with innovation and hosts many of the world’s leading technology companies. 

In Europe, the London Stock Exchange (LSE) stands as a financial powerhouse, hosting a diverse array of companies. Meanwhile, the Euronext group, spanning Amsterdam, Brussels, Dublin, Lisbon, Milan, and Paris, plays a pivotal role in European trading. 

Turning our attention to Asia, the Tokyo Stock Exchange (TSE) in Japan and the Hong Kong Stock Exchange (HKEX) command significant influence. These exchanges contribute to the vibrancy and dynamism of the Asian financial markets. 

These exchanges are more than mere facilitators; they are the driving forces shaping stock prices globally. The dynamic interplay of supply and demand on these platforms directly influences the valuation of stocks. 

Understanding the mechanics of stock exchanges, particularly the NYSE and NASDAQ, is essential for investors seeking to decipher the intricate forces that shape market trends and individual stock prices. As investors, being attuned to the activities on these exchanges equips us to navigate the complexities of the global financial arena. 

Stocks and Other Financial Instruments: Navigating the Financial Landscape 

In the expansive realm of financial instruments, it’s vital to differentiate between various assets. Beyond stocks, investors encounter bonds and Exchange-Traded Funds (ETFs), each with its unique characteristics. 

Bonds, in contrast to stocks, represent debt rather than ownership. When an investor buys a bond, they are essentially lending money to a company or government entity. In return, the bondholder receives periodic interest payments and the eventual return of the principal amount. 

Exchange-Traded Funds (ETFs), on the other hand, are investment funds that trade on stock exchanges. ETFs offer a diversified investment approach by bundling together a collection of stocks, bonds, or other assets. They provide investors with a way to gain exposure to a broad market or sector without directly owning individual securities. 

Understanding these financial instruments allows investors to tailor their portfolios to match their risk tolerance, investment goals, and preferences. 

Stocks vs Share CFDs: Navigating Investment Avenues 

Share CFDs, or Contracts for Difference, are financial derivatives that allow traders to speculate on the price movements of underlying stocks without actually owning the shares. 

Unlike traditional stock trading, where investors physically buy and own shares in a company, CFDs are contracts between traders and brokers. 

The derivative nature of CFDs lies in their ability to derive their value from the underlying asset, in this case, stocks. This derivative structure opens up a world of advantages for traders, enabling them to profit from both rising and falling markets. 

Advantage 1: Leverage 

One of the key advantages of share CFDs is the ability to trade with leverage. Leverage allows traders to control a larger position size with a smaller amount of capital. While this magnifies potential profits, it’s crucial to note that it also amplifies potential losses. This feature makes CFDs an attractive choice for traders seeking to maximise their market exposure without the need for a substantial upfront investment. 

Advantage 2: Short Selling 

Share CFDs provide a unique opportunity for traders to profit from falling prices through short selling. In traditional stock trading, short selling is often complex and may involve borrowing shares, but with CFDs, this process is streamlined. Traders can take advantage of market downturns by selling CFDs on stocks they anticipate will decline in value, potentially yielding profits even in bearish market conditions. 

Advantage 3: Diversification 

Diversification is a cornerstone of sound investment strategy, and share CFDs offer a compelling way to achieve it. With CFDs, traders can access multiple assets with a smaller capital requirement compared to traditional stock trading. This not only enhances risk management but also provides the flexibility to explore diverse markets and sectors. 

If you’re an active, short-term trader seeking flexibility and leverage, share CFDs are ideal. Designed for day and swing traders comfortable with increased risk, CFDs allow you to profit in both rising and falling markets. With 24/5 trading, global market exposure, and lower transaction costs, they suit those wanting diverse opportunities. 

Share CFDs Trading Tips: A Strategic Approach 

Engaging in share CFDs trading demands a strategic mindset. To streamline your approach, focus on these five essential tips: 

1. Thorough Research: Prioritise in-depth research on underlying assets, staying informed about market trends, company performance, and global economic factors. 

2. Effective Risk Management: Set clear stop-loss and take-profit levels to manage risks diligently. Discipline in risk management is crucial in the unpredictable world of CFD trading. 

3. Understand Leverage: Use leverage judiciously, considering its impact on both profits and potential losses. Avoid excessive leverage to mitigate significant financial risks. 

4. Stay Informed: Regularly check economic calendars and major market events. Earnings reports, economic indicators, and geopolitical developments can significantly influence asset prices. 

5. Continuous Learning: Embrace ongoing education to stay current on market trends, trading strategies, and industry developments. A commitment to learning enhances trading proficiency and adaptability over time. 

Incorporating these key tips into your trading strategy will provide a solid foundation for navigating the dynamic landscape of Share CFDs with confidence. 

Trading Share CFDs with VT Markets 

Discover a wealth of share CFDs trading opportunities with VT Markets, offering access to over 800 leading companies from the US, UK, EU, and Hong Kong. 

Leverage up to 20:1 to maximise your trading potential, taking both long and short positions for as low as $0 per trade. This flexibility empowers you to profit from fluctuations in share prices, whether they rise or fall. 

Ready to embark on live trading? Open a live trading account with VT Markets for real-time market access. If you’re still refining your strategies, take advantage of the risk-free demo account. Test your approaches and get acquainted with the platform before committing real capital. 

VT Markets provides a user-friendly experience for traders of all levels, ensuring you have the tools needed to navigate the dynamic world of share CFDs with confidence. 

In conclusion, success in trading stocks and share CFDs demands a strategic approach, disciplined risk management, and continuous learning. Whether you prefer traditional stocks or the flexibility of CFDs, confidence stems from knowledge and a well-crafted strategy. Happy trading! 

Dividend Adjustment Notice – January 17, 2024

Dear Client,

Please note that the dividends of the following products will be adjusted accordingly. Index dividends will be executed separately through a balance statement directly to your trading account, and the comment will be in the following format “Div & Product Name & Net Volume ”.

Please refer to the table below for more details:

The above data is for reference only, please refer to the MT4/MT5 software for specific data.

If you’d like more information, please don’t hesitate to contact [email protected].

Dow Jones Declines, Boeing Slumps, and Currency Markets React to Fed’s Rate Hints

On Tuesday, the Dow Jones Industrial Average faced a 0.62% dip, closing at 37,361.12, influenced by increased bond yields and mixed fourth-quarter earnings. Boeing shares plummeted 7.9% due to a Wells Fargo downgrade, while AMD soared 8.3% on a positive semiconductor demand outlook. Goldman Sachs outperformed profit expectations, boosting its shares, while Morgan Stanley saw a 4% decline despite revenue beats. The USD index rose by 0.75%, driven by higher U.S. Treasury yields and shifting Fed rate expectations. Currency pairs experienced notable movements, with EUR/USD dropping 0.76%, USD/JPY rising by 1%, and GBP/USD weakening. In the cryptocurrency landscape, BTC rose 1.4%, ETH increased by 2.2%, and gold fell 1% following SEC approval of spot ETFs and market focus on ether spot ETF approvals.

Stock Market Updates

The stock market experienced a decline on Tuesday, with the Dow Jones Industrial Average dropping 0.62%, closing at 37,361.12. Bond yields increased, contributing to the negative sentiment as investors examined fourth-quarter earnings. Boeing shares fell sharply by 7.9% following a downgrade by Wells Fargo, citing ongoing issues with its 737 Max 9 model. On a positive note, AMD shares surged 8.3% due to optimistic analyst commentary on semiconductor demand. The benchmark 10-year Treasury note yield rose over 11 basis points to 4.064% after Federal Reserve Governor Christopher Waller hinted at a slower-than-expected easing of monetary policy.

In the banking sector, Goldman Sachs reported better-than-expected profit and revenue, causing a slight increase in its shares, while Morgan Stanley posted a revenue beat but saw a decline of over 4%. Overall, 78% of the roughly 30 S&P 500 companies reporting fourth-quarter results have exceeded earnings expectations. Investors are now anticipating December retail sales data, set to be released on Wednesday, which could impact market sentiment based on U.S. consumer spending trends and concerns about economic growth.

Data by Bloomberg

On Tuesday, the overall market experienced a slight decline of 0.37%. The Information Technology sector saw a positive movement with a gain of 0.39%, while Consumer Discretionary showed a modest decrease of 0.20%. Communication Services and Consumer Staples both experienced declines of 0.42% and 0.48%, respectively. Health Care, Real Estate, and Financials also saw negative trends with decreases of 0.55%, 0.61%, and 0.64%, respectively. Industrials faced a more significant downturn with a decline of 0.98%. The Utilities and Materials sectors both exhibited larger decreases of 1.05% and 1.19%, respectively. Energy witnessed the most substantial decline among all sectors, with a notable decrease of 2.40%.

Currency Market Updates

In the latest currency market updates, the USD index surged by 0.75%, driven by rising U.S. Treasury yields and a shift in Fed rate expectations. Governor Christopher Waller’s comments acknowledging the potential for rate cuts tempered extreme dovish sentiments, contributing to the rally. The 5-30-year Treasury yields rose, bolstering the dollar, while less-dovish ECB comments and higher Canada CPI played roles in shaping the session. Despite the increase in long-end Treasury yields, there remains a 68% chance of a 25bp Fed cut in March, indicating a nuanced market sentiment. Notably, the EUR/USD pair declined by 0.76% to 1.0870, reflecting the impact of less-dovish ECB central bank comments on the euro, amidst concerns about euro zone growth.

In parallel, other currency pairs saw notable movements. USD/JPY rose by 1% to 147.25, driven by higher Fed rate expectations and a consistently low BoJ rate outlook. GBP/USD weakened due to the less-dovish Fed rate view, although the impact was relatively muted given higher UK inflation and rate expectations. Focus now shifts to the UK CPI data, with potential implications for the BoE’s rate decisions. USD/CAD rose by 0.43%, reaching 1.3484, but gains were tempered by stronger-than-expected Canada CPI, diminishing expectations for an early BoC rate cut. Additionally, AUD/USD fell by 1.2%, influenced by higher rates and concerns about global growth amid doubts regarding China’s recovery. In the broader financial landscape, BTC rose by 1.4% to $43.3k, ETH increased by 2.2%, and gold fell 1% to $2,035, reflecting market responses to SEC approval of spot ETFs and shifting focus to ether spot ETF approvals.

Picks of the Day Analysis
EUR/USD (4 Hours)

EUR/USD Suffers Sharp Decline as USD Gains Momentum Amidst Divergent Central Bank Signals and Strong US Yields

EUR/USD extended its bearish trend, breaking below the critical support level at 1.0900 and hitting a new yearly low near 1.0860. The upward momentum of the US Dollar, driven by a surge in the USD Index to 2024 peaks beyond 103.00, was reinforced by robust US yields as traders returned from the MLK holiday. ECB officials’ comments, though leaning towards rate cuts, clashed with market expectations, leading to a subdued EUR. Despite positive Economic Sentiment indicators in Germany and the Eurozone, the Euro failed to find support, and the probability of a Fed rate cut in March, as indicated by CME Group’s FedWatch Tool, decreased slightly. The decline in the Euro was set against the backdrop of rising yields in both German bunds and US Treasuries.

Chart EUR/USD by TradingView

On Tuesday, the EUR/USD moved lower, able to reach the lower band of the Bollinger Bands. Currently, the price is moving just above the lower band, suggesting a potential upward movement to reach the middle band. Notably, the Relative Strength Index (RSI) maintains its position at 30, signaling an oversold outlook for this currency pair.

Resistance: 1.0895, 1.0954

Support: 1.0814, 1.0742

XAU/USD (4 Hours)

XAU/USD Faces Sell-Off Amid Interest Rate Uncertainty and Inflation Dynamics

Gold prices (XAU/USD) experienced a decline as attempts to surpass the weekly high of $2,060 fell short. This setback was triggered by investors reassessing the Federal Reserve’s potential interest rate adjustments. The release of the December Consumer Price Index (CPI) report, coupled with hawkish statements from European Central Bank (ECB) officials, influenced market sentiment. While expectations for a rate cut in March persist, the Federal Reserve remains cautious, considering the robust consumer price inflation in the U.S. economy, steady labor demand, and low recession risks. As markets await cues from upcoming data such as monthly U.S. Retail Sales, Industrial Production, and the Fed’s Beige Book, the trajectory of gold prices hinges on evolving interest rate outlooks.

Chart XAU/USD by TradingView

On Tuesday, XAU/USD moved lower and tried to reach the lower band of the Bollinger Bands. Currently, the price moving just above the lower band suggesting a potential upward movement to reach the middle band. The Relative Strength Index (RSI) stands at 40, signaling a neutral but bearish outlook for this pair.

Resistance: $2,035, $2,048

Support: $2,023, $2,010

Economic Data
CurrencyDataTime (GMT + 8)Forecast
GBPConsumer Price Index y/y15:003.8%
USDRetail Sales m/m21:300.4%
USDCore Retail Sales m/m21:300.2%

Forex Market Analysis: GBP/USD Focus & Market Trends 16 Jan 2024

TOP FX NEWS: 16 Jan 2024

CURRENCIES:

GBP/USD Analysis and Charts:

  • Falling UK wages provide optimism for the Bank of England.
  • Cable faces pressure due to USD strength.

Key Points from ONS Labour Market Overview:

  • UK wage growth decelerated in November.
  • Unemployment rate remained unchanged.
  • Despite slowing wage growth, it remains high enough to deter an immediate UK rate cut.

Latest UK Implied Rates:

  • First UK Base Rate cut anticipated in May.
  • Predictions indicate a total of 131 basis points in cuts for the upcoming year.

US Dollar Strength:

  • The US dollar shows strength after a long weekend.
  • US dollar index reaches a 10-day high.
  • Factors include slightly higher US Treasury bond yields and geopolitical concerns in Ukraine and the Red Sea.

GBP/USD Technical Levels:

  • Cable approaches a support level at 1.2667.
  • Potential breakdown may target the 38.2% Fibonacci level at 1.2628, prior lows cluster around 1.2610/15, and the 50-day simple moving average at 1.2608.
  • Upside movement may face resistance at 1.2742, with further hurdles near recent highs up to just under 1.2800.

STOCK MARKET:

Market Overview:

  • European stocks and US futures decline.
  • Dollar reaches a one-month high, impacting various market sectors.
  • Bonds experience a fall as central bank officials resist aggressive interest rate cut expectations.

Stock and Futures Movement:

  • Stoxx Europe 600 index heads for a five-week low, led by declines in retailers and banks.
  • S&P 500 futures slip by 0.6%, Nasdaq 100 contracts drop by up to 0.9%.
  • Treasuries decline across the curve, with ten-year yields and the 2-year debt rising about six basis points each.

Central Bank Comments and Rate Cut Expectations:

  • European Central Bank Governing Council member Francois Villeroy de Galhau emphasizes it’s too early to declare victory on inflation.
  • Traders await Federal Reserve Governor Christopher Waller’s speech for cues on the timing of a Fed rate cut, with a two-in-three chance seen in March.
  • ECB Governing Council member Robert Holzmann and President Christine Lagarde express uncertainty about assured rate cuts, citing lingering inflation and geopolitical risks.

UK Economic Data:

  • Economic data in the UK supports the case for Bank of England rate cuts.
  • Wage growth cools at one of the fastest paces on record, leading to a weakening of the pound against the dollar.

Corporate Results:

  • Morgan Stanley and Goldman Sachs Group Inc. expected to report continued lull in investment banking activity.
  • High borrowing costs, geopolitical tensions, and recessionary risks dampen deal-making.

Global Economic Outlook and Oil Prices:

  • Oil prices remain steady amidst Houthi attacks in the Red Sea, contributing to tensions in the Middle East.
  • Global benchmark Brent holds around $78 a barrel, while West Texas Intermediate trades below $73.

MSCI Asia Pacific Index:

  • Slides 1.3%, halting a three-day rally.
  • Hang Seng Index faces the worst day in about two months due to property-sector funding plans impacting bank shares.

Upcoming Market Events:

  • Key events this week include Germany ZEW survey expectations, US Empire Manufacturing, and earnings reports from Goldman Sachs Group Inc. and Morgan Stanley.
  • Federal Reserve Governor Christopher Waller is scheduled to speak on Tuesday.

Stay tuned to VT Markets Daily Analysis for all your daily CFD updates.

New Products Launch – January 16, 2024

Dear Client,

To provide you with more diverse trading options, VT Markets will launch 3 new products on 22nd Jan 2024.

You can now trade the world’s popular products on Meta Trader 4 and 5 with the following specifications:

The above data is for reference only, please refer to the MT4 and MT5 platforms for the updated data.

Friendly reminders:

1. The swap for BTCJPY and ETHJPY is charged on a daily basis, including weekends, without a 3-day swap.

2. Please refer to the MT4 and MT5 platforms for the specific swap rate.

If you’d like more information, please don’t hesitate to contact [email protected].

Investing in gold: goals and things to know 

Are you pondering over the idea of investing in gold? Step into the world of possibilities with VT Markets, where gold trading becomes an experience that’s safe, fast, and secure. Ditch the conventional avenues like jewellery and bullion purchases; dive into the dynamic gold trading market that has gained remarkable momentum over the past 15 years. 

Gold as an investment vs. jewellery 

Gold as an investment typically involves buying physical gold in various forms, such as bars, coins, or through financial instruments such as our platform. In investing terms, we are looking to profit from the purchase and sale of gold through trading.  

Jewellery, on the other hand, is primarily a personal asset with aesthetic and sentimental value. While it contains gold, the purchase of jewellery is more about personal adornment and cultural significance rather than being a strategic financial investment with sufficient returns. 

Why gold shines on our platform 

Investing in gold and precious metals has long been trusted for wealth preservation and diversification in investment portfolios. Gold’s reputation as a secure asset has proven resilient during economic downturns. However, while it offers advantages, it might not align with everyone’s investment goals. 

Why gold deserves a spot in your portfolio 
  1. Safe haven in turbulent times 

Gold has historically emerged as a sought-after asset during geopolitical tensions and economic uncertainties. In 2023, central banks bolstered their gold reserves by a staggering 87%, highlighting its appeal as a store of value. 

  1. Inflation hedge 

With global inflation projected around 6.7% in 2023, gold served as a hedge against inflation. Its price rise paralleled the increase in global inflation, showcasing its role as an inflation shield. 

  1. Diversification value 

Gold’s price movements often have a low correlation with traditional assets like stocks and bonds. This diversification potential reduces overall portfolio risk and offers stability during market downturns. 

Why did gold prices soar in 2023? 

During the year, gold prices reached an unprecedented peak, hitting $2,146 on December 4th (as reported on VT Markets MT4). This surge represented a notable 17% increase from the opening price recorded on January 3rd, 2023, which stood at $1,827. The upward trajectory of gold prices during this period can be attributed to five key triggers: 

  • Store of value 

The year began with the US banking crisis, prompting risk-averse investors to flock toward gold’s safety net. 

  • Geopolitical tensions 

Despite fluctuations in the second and third quarters, the Israel-Hamas conflict in Q4 reignited demand for gold as a store of value. 

  • Dovish Fed and weakening dollar 

The Federal Reserve’s inclination toward potential rate cuts in 2024 weakened the dollar, enhancing gold’s appeal. 

  • Central Bank appetite 

Large-scale strategic gold purchases by central banks exerted additional upward pressure on prices. 

  • Strong festive demand 

Q4 witnessed robust gold buying during the Indian festive season. 

What’s glittering on the horizon in 2024? 

Analysts anticipate the continued strength of the gold market for 2024 and beyond. Factors like the Fed’s plans to cut interest rates in 2024 and 2025 might bolster gold prices further. Additionally, ongoing tensions in the Middle East could spur strong demand for gold if they escalate. 

Investing in gold remains a compelling option, given its historical performance and its role as a hedge against various economic uncertainties. As always, it’s crucial to consider your investment goals and consult with financial experts before making any decisions. 

Ready to put your newfound knowledge to the test? Open your live account with VT Markets and start trading right away.

Wiki Finance Expo Hong Kong

Join us at Booth C4 at the WIki finance Expo Hong Kong!
Gain an opportunity to connect and acquire global high-quality resources from individuals, exhibitors and enterprises such as start-ups, practitioners and investors from the financial industry.

Venue: International Commerce Center Center (ICC)

Dividend Adjustment Notice – January 16, 2024

Dear Client,

Please note that the dividends of the following products will be adjusted accordingly. Index dividends will be executed separately through a balance statement directly to your trading account, and the comment will be in the following format “Div & Product Name & Net Volume ”.

Please refer to the table below for more details:

The above data is for reference only, please refer to the MT4/MT5 software for specific data.

If you’d like more information, please don’t hesitate to contact [email protected].

Global Markets Navigate Challenges as World Economic Forum Commences in Davos

European stocks faced a subdued start as U.S. markets remained closed, and the Stoxx 600 index ended down 0.5%, with travel stocks climbing 0.9% and household goods falling 1%. The German economy contracted by 0.3% in 2023 due to factors like high inflation and weakened demand. Meanwhile, the World Economic Forum in Davos, themed “Rebuilding Trust,” brought together global leaders to discuss pressing issues. The currency market saw the US dollar strengthen, impacting the DXY and influencing the EUR/USD pair, while GBP/USD maintained a selling bias. The Japanese yen experienced a reversal, and AUD/USD faced downward pressure. USD/CAD registered gains amid risk-off sentiment. Geopolitical concerns supported modest gains in Gold and Silver. Tuesday’s focus includes Germany’s economic releases and critical Canadian inflation figures.

Stock Market Updates

U.S. markets were closed on Monday, contributing to a subdued start for European stocks as investors geared up for the World Economic Forum in Davos, Switzerland. The Stoxx 600 index ended down 0.5%, with major bourses and most sectors in negative territory. Travel stocks, however, climbed 0.9% while household goods fell 1%. The German economy contracted by 0.3% in 2023, attributed to factors such as high inflation, rising interest rates, and weakened domestic and foreign demand, according to initial figures from the National Statistics Agency. Meanwhile, China’s market rebounded as the central bank kept its medium-term policy loan rate unchanged.

This year’s World Economic Forum, themed “Rebuilding Trust,” is scheduled from Jan. 14-19. The global summit in Davos will bring together business and political leaders to discuss pressing economic and geopolitical issues. Key topics expected to top the agenda include global trade, inflation, supply chains, technological change, and conflicts in the Middle East and Ukraine. Notable attendees include China’s second-in-command Li Qiang and French President Emmanuel Macron, both set to deliver special addresses during the event.

Data by Bloomberg

As the US market closed on Monday, the latest updates were from Friday, revealing a modest overall market increase of 0.08%. The Energy sector performed notably well with a gain of 1.26%, followed by Real Estate at 0.78%, and Communication Services at 0.62%. Utilities and Information Technology both contributed positively with increases of 0.59% and 0.35%, respectively. However, some sectors experienced declines, with Consumer Discretionary leading the losses at -1.05%, followed by Health Care at -0.29%. Industrials and Financials also dipped slightly with decreases of -0.04% and -0.23%, respectively. Overall, the market displayed a mixed performance across sectors on Friday.

Currency Market Updates

The currency market experienced notable developments as the demand for the US dollar (USD) strengthened, propelling the USD Index (DXY) upward due to renewed risk aversion influenced by geopolitical concerns, particularly in the Middle East. The DXY continued its consolidative trend since the beginning of the year. Meanwhile, the EUR/USD pair saw a rebound from daily lows near 1.0930 to settle around 1.0950, supported by marginal gains and a recovery in German yields. ECB policymakers’ comments ruling out near-term rate cuts contributed to the bounce in the Euro. Germany’s upcoming releases of the final December CPI, Economic Sentiment by the ZEW Institute, and a speech by the Bundesbank’s J. Nagel are anticipated to play a pivotal role in the currency’s movements.

In contrast, GBP/USD maintained a selling bias amid a greenback rebound, with a focus on the impending key labor market report and a speech by BoE Governor A. Bailey. The Japanese yen (JPY) experienced a reversal in USD/JPY as it revisited the proximity of the 146.00 barrier after two sessions of losses. The Australian dollar (AUD/USD) faced persistent downward pressure, testing the crucial zone around 0.6650. In the Asian trading hours, Westpac’s release of the monthly gauge of Consumer Confidence for January is expected to impact the AUD/USD pair. USD/CAD registered its third consecutive session of gains, reaching a new five-week high near 1.3450, driven by the risk-off sentiment in the USD and the bearish tone in crude oil prices. The Canadian Dollar is anticipated to take center stage on Tuesday with critical inflation figures for December. Lastly, modest gains in Gold and Silver were supported by heightened geopolitical concerns and the resulting risk-off sentiment.

Picks of the Day Analysis
EUR/USD (4 Hours)

EUR/USD Faces Uncertainty Amidst Geopolitical Tensions and ECB Debate on Interest Rates

The EUR/USD started the trading week with indecision, marked by reduced volatility and thin trade conditions due to the US markets’ inactivity post-Martin Luther King Jr. holiday. The pair rebounded from daily lows near 1.0930, supported by a positive session for the greenback amid a risk-off sentiment tied to geopolitical developments, especially in the Middle East. The European currency found some backing from hawkish comments by ECB officials, countering premature speculation about potential interest rate cuts. A debate between market participants and ECB rate-setters on the timing of rate reduction ensues, with the central bank leaning towards a restrictive stance due to persistent inflation. Meanwhile, data from Europe reveals mixed economic indicators, contributing to the uncertainty in EUR/USD movements.

Chart EUR/USD by TradingView

On Monday, the EUR/USD moved lower, able to reach the lower band of the Bollinger Bands. Currently, the price moving just around the lower band, suggesting another potential downward movement. Notably, the Relative Strength Index (RSI) maintains its position at 39, signaling a bearish outlook for this currency pair.

Resistance: 1.0954, 1.1000

Support: 1.0912, 1.0876

XAU/USD (4 Hours)

XAU/USD Holds Steady Near $2,058.55 Amid Quiet US Markets on Martin Luther King Day

Gold (XAU/USD) maintains its upward momentum, hovering above $2,050 per troy ounce in the absence of U.S. market activity due to the Martin Luther King Day Holiday. The week began optimistically, with Asian shares reflecting positive sentiment; however, European trading hours saw a decline in optimism as tepid local data weighed on EU indexes. The US Dollar exhibited mixed performance, particularly gaining strength against commodity-linked currencies. Looking ahead, the focus shifts to inflation updates from Canada, the United Kingdom, Germany, and the Eurozone, while the World Economic Forum in Davos will attract attention with speeches from major central bankers and authorities. The U.S. macroeconomic calendar remains relatively quiet this week, with December Retail Sales and the preliminary estimate of the January Michigan Consumer Sentiment Index slated for release later.

Chart XAU/USD by TradingView

On Monday, XAU/USD moved flat and stayed between the middle and upper bands of the Bollinger Bands. Currently, the price moving between the middle and upper bands. The Relative Strength Index (RSI) stands at 56, signaling a neutral outlook for this pair.

Resistance: $2,070, $2,089

Support: $2,042, $2,023

Economic Data
CurrencyDataTime (GMT + 8)Forecast
GBPClaimant Count Change15:0018.1K
CADConsumer Price Index m/m21:30-0.3%
USDEmpire State Manufacturing Index21:30-4.9

Forex Market Analysis: Global Market Insights: US Dollar, Stocks, and Geopolitical Dynamics

Forex Market Analysis: Monday 15 Jan 2024

Economic data: Markets closed for Martin Luther King, Jr. Day

Earnings: Markets closed for Martin Luther King, Jr. Day

CURRENCIES:

  • Event Focus: UK Unemployment and Inflation Data
    • Major event risk from the UK includes upcoming releases of unemployment and inflation data.
  • US Market Dynamics: Lower Yields and Rate Cut Forecasts
    • US dollar maintains its trading range despite declining yields and heightened expectations for rate cuts.
    • US 2-year yield experiences a six-day decline, with markets predicting nearly 25 basis point cuts in each meeting from March to November.
    • Note: Potential rate adjustments by the Fed may be limited due to the proximity to the presidential elections.
  • US Dollar Basket Performance: Trading within Range
    • The US Dollar Basket, a proxy for USD performance, has been trading within a range for the past two weeks.
    • The significant resistance at the 103.00 level, coupled with the presence of the 200 and 50-day simple moving averages, limits the dollar’s upside potential.
  • Challenges for the USD: Declining Yields and Rate Cut Expectations
    • The USD faces challenges such as decreasing yields, a more imminent prospect of rate cuts, and easing price pressures.
  • Implied Fed Funds Rate: Market Expectations
    • Market expectations, as reflected in the implied Fed Funds Rate via the Fed Funds Futures Market, indicate anticipation of future rate cuts.
  • Inflation Outlook: Despite Slightly Higher CPI Readings
    • Despite slightly higher Consumer Price Index (CPI) readings last month, expectations suggest a continued drop in inflation.
    • USD’s current range-holding is attributed in part to its safe-haven appeal, particularly following joint US and UK strikes on Houthi targets.
  • Global Economic Outlook: Chinese Q4 GDP Data
    • Chinese Q4 GDP data is anticipated to provide insights into the global economic outlook.
  • Safe Haven Appeal of USD: Influenced by Geopolitical Events
    • USD’s safe-haven appeal is reinforced by geopolitical events, such as joint US and UK strikes on Houthi targets, contributing to its range-holding status.
  • Gold Performance: Notable Safe Haven Asset
    • Gold, a significant safe-haven asset, exhibited an increase over the weekend, aligning with USD’s safe-haven appeal.
  • Key Levels for USD: Resistance at 103.00
    • The USD faces resistance at the major level of 103.00, with the 200 and 50-day simple moving averages further contributing to this resistance zone.
  • Factors Influencing USD Range: Safe Haven Status
    • Despite various challenges, the USD’s ability to maintain its range is influenced by its safe-haven status, particularly in response to recent geopolitical developments.

STOCK MARKET:

  • Market Recap and Outlook:
    • Stocks resumed winning streak after a nine-week break to start 2024.
    • Nasdaq Composite led with a 3% gain; S&P 500 approached a record high.
    • Microsoft surpassed Apple as the world’s most valuable company.
  • Upcoming Focus:
    • In a holiday-shortened week, attention shifts to financial sector results and Wednesday’s retail sales data.
    • US markets closed Monday for Martin Luther King Jr. Day.
  • Retail Sales Forecast:
    • Retail sales expected to rise by 0.4% in December, exceeding the 0.3% gain in November.
    • Bank of America anticipates “robust” retail sales due to applied seasonal adjustments.
  • Economic Calendar:
    • Thursday: Initial jobless claims data.
    • Friday: University of Michigan’s consumer sentiment report.
  • Geopolitical Events:
    • Monday: Iowa caucuses mark the official start of the 2024 US presidential election.
    • Rising tensions in the Red Sea draw increased investor attention.
  • Earnings Reports:
    • Investment banks Goldman Sachs (GS) and Morgan Stanley (MS) set to report.
    • Focus on the investment banking story and the trajectory after a challenging year.
  • Inflation Insights:
    • Last week’s inflation data showed firmer consumer prices but moderated producer prices.
    • Red Sea-related disruptions noted as an “upside risk” to inflation forecasts.
  • Fed Rate Cut Expectations:
    • Investors price in a 77% chance of a 0.25% Fed rate cut in March.
    • Barclays economists expect incremental cuts starting in March but at a more gradual pace.
  • Earnings Season Kickoff:
    • Major money center banks, including JPMorgan, Wells Fargo, Bank of America, and Citi, reported results.
    • JPMorgan reported a nearly $50 billion record annual profit.
  • Tech Sector Focus:
    • The financial sector takes the spotlight initially, but the tech sector’s performance will be closely monitored.
    • Forward P/E ratio for the Technology sector stands at 27, second highest among S&P 500 sectors.
  • Magnificent Seven and Nasdaq Influence:
    • Results from “Magnificent Seven” tech giants, including Meta Platforms, Alphabet, Amazon, and Tesla, will impact the Nasdaq and overall market sentiment.
    • Negative guidance from tech sector companies above recent averages.
  • Sector Valuations:
    • Technology sector’s forward P/E ratio at 27, second only to Real Estate, which traded at 39.
    • Technology’s performance crucial as it accounts for over 28% of the S&P 500’s market cap.
  • Fourth Quarter Earnings Season:
    • The tech trade’s impact on overall market direction will be significant as the earnings season progresses.
  • Investor Sentiment:
    • The party for fourth-quarter earnings season begins when reports from the “Magnificent Seven” tech giants start rolling in.

Start Your Shares CFD Trading journey with VT Markets and access a world of opportunity. Discover advanced tools, expert insights, and tailored strategies to enhance your trading experience. Open your account today and join a community of savvy traders

Back To Top
server

Hello there 👋

How can I help you?

Chat with our team instantly

Live Chat

Start a live conversation through...

  • Telegram
    hold On hold
  • Coming Soon...

Hello there 👋

How can I help you?

telegram

Scan the QR code with your smartphone to start a chat with us, or click here.

Don’t have the Telegram App or Desktop installed? Use Web Telegram instead.

QR code