GBP/USD ended a five-day rise and opened lower at about 1.3390 in Asian trading on Monday. The pair fell as risk appetite weakened after US–Iran peace talks failed.
Demand for safe-haven assets supported the US Dollar against major currencies. Vice President JD Vance said talks in Islamabad ended without an agreement after 21 hours of negotiations.
Outlook For Sterling Dollar
Given the renewed risk aversion, we should anticipate continued downward pressure on the GBP/USD pair in the coming weeks. The failure of US-Iran talks acts as a major catalyst for a flight to safety, directly benefiting the US dollar. Traders could consider buying put options on sterling to hedge against a further slide below the 1.3300 psychological level.
The market is already pricing in higher uncertainty, with the Deutsche Bank Currency Volatility Index (CVIX) jumping over 12% to a six-month high of 9.8 in early trading today. This increase in implied volatility makes options more expensive, suggesting that establishing positions sooner may be more cost-effective. We see this as a clear signal that sharp currency movements are expected by the broader market.
We saw a similar dynamic unfold in late 2025 when tensions first escalated, which drove the dollar index up by nearly 3% in a single quarter. That period was marked by sharp, unpredictable swings, rewarding traders who were hedged against volatility. Historical data from that time shows that options strategies protecting against a drop in risk-sensitive currencies like the pound and the Aussie dollar performed very well.
The primary concern is the potential blockade of the Strait of Hormuz, through which nearly a fifth of the world’s daily oil supply passes. Any disruption there would almost certainly cause a severe energy price shock, further strengthening the safe-haven dollar. Consequently, we are looking at call options on oil futures, as Brent crude could easily target $110 a barrel if the situation deteriorates.
Risks And Positioning
This global uncertainty directly impacts the UK’s economic outlook, making the pound especially vulnerable. The latest data from the Office for National Statistics showed the UK’s trade deficit widened unexpectedly in February 2026, highlighting its sensitivity to global trade disruptions. We should therefore consider shorting GBP futures not just against the dollar but also against other havens like the Swiss franc.
The rebound marks a reversal from the more optimistic tone seen after last week’s ceasefire announcement, when traders briefly reduced defensive exposure and returned to equities and other risk assets.
The US Dollar Index is holding near 99.06, close to its highest level since April 7, suggesting that some of the geopolitical premium that had faded is now being rebuilt.
Failed Diplomacy Pushes the Market Back Into Caution
Markets had hoped the discussions between Washington and Tehran could stabilise the situation and reduce the risk of wider regional escalation. Instead, the lack of progress has brought uncertainty back into focus.
The dollar jumped against other major currencies in thin trading late on Sunday, as investors sought the relative safety of the U.S. currency after marathon talks between Washington and Tehran failed to yield a peace deal, plunging markets into a seventh week of uncertainty.…
— BusinessToday Malaysia (@BusinessTodayM1) April 13, 2026
The earlier ceasefire had supported a measured recovery in risk appetite. Equities had regained some lost ground, oil had pulled back from recent highs, and the dollar had surrendered part of its defensive premium. The latest developments have disrupted that narrative and prompted investors to unwind some of those positions.
Price action across the currency market reinforces that shift. The euro moved lower, while more risk-sensitive currencies such as the Australian dollar and sterling came under greater pressure.
Together, these moves suggest that investors are pulling back from earlier optimism and returning to a more defensive stance.
Hormuz Risk Returns to the Centre of the Market
A second force behind the stronger dollar is the renewed focus on energy supply risk. The Strait of Hormuz remains one of the world’s most important oil transit routes, so any threat to shipping there quickly becomes a broader macro issue.
The US military says it will begin blocking all maritime traffic entering and leaving Iranian ports from 10am ET today. Iran’s Revolutionary Guard warns any military vessel nearing the Strait of Hormuz violates the ceasefire.
Markets are also reassessing the potential consequences for oil flows, inflation, and the broader policy outlook. With the US moving toward a blockade tied to Iranian ports, traders are again pricing the possibility of deeper disruption across the region.
That shift has contributed to a sharp rise in oil prices, reinforcing concern that inflation could remain elevated for longer. In a geopolitically unstable environment, higher energy costs make it more difficult for markets to assume a smooth moderation in inflation or a near-term turn toward easier monetary policy.
Stay up-to-date on news around President Donald Trump and market impacts here.
The Dollar’s Strength Reflects a Broader Repricing
The dollar is drawing support from more than renewed safe-haven demand. Markets are also reassessing whether elevated energy prices could keep inflation pressures firmer and delay a shift toward easier policy.
If crude remains elevated, the global disinflation narrative becomes harder to sustain, limiting scope for markets to price a near-term turn toward easier monetary policy. That leaves the dollar on firmer footing as investors reassess the risk of more persistent inflation.
Viewed in that context, the latest rebound appears more grounded than a standard risk-off move. The greenback is being supported both by demand for safety and by the risk that policy settings may remain restrictive for longer.
While the move remains sensitive to headlines, it increasingly reflects a wider repricing of geopolitical and inflation risk.
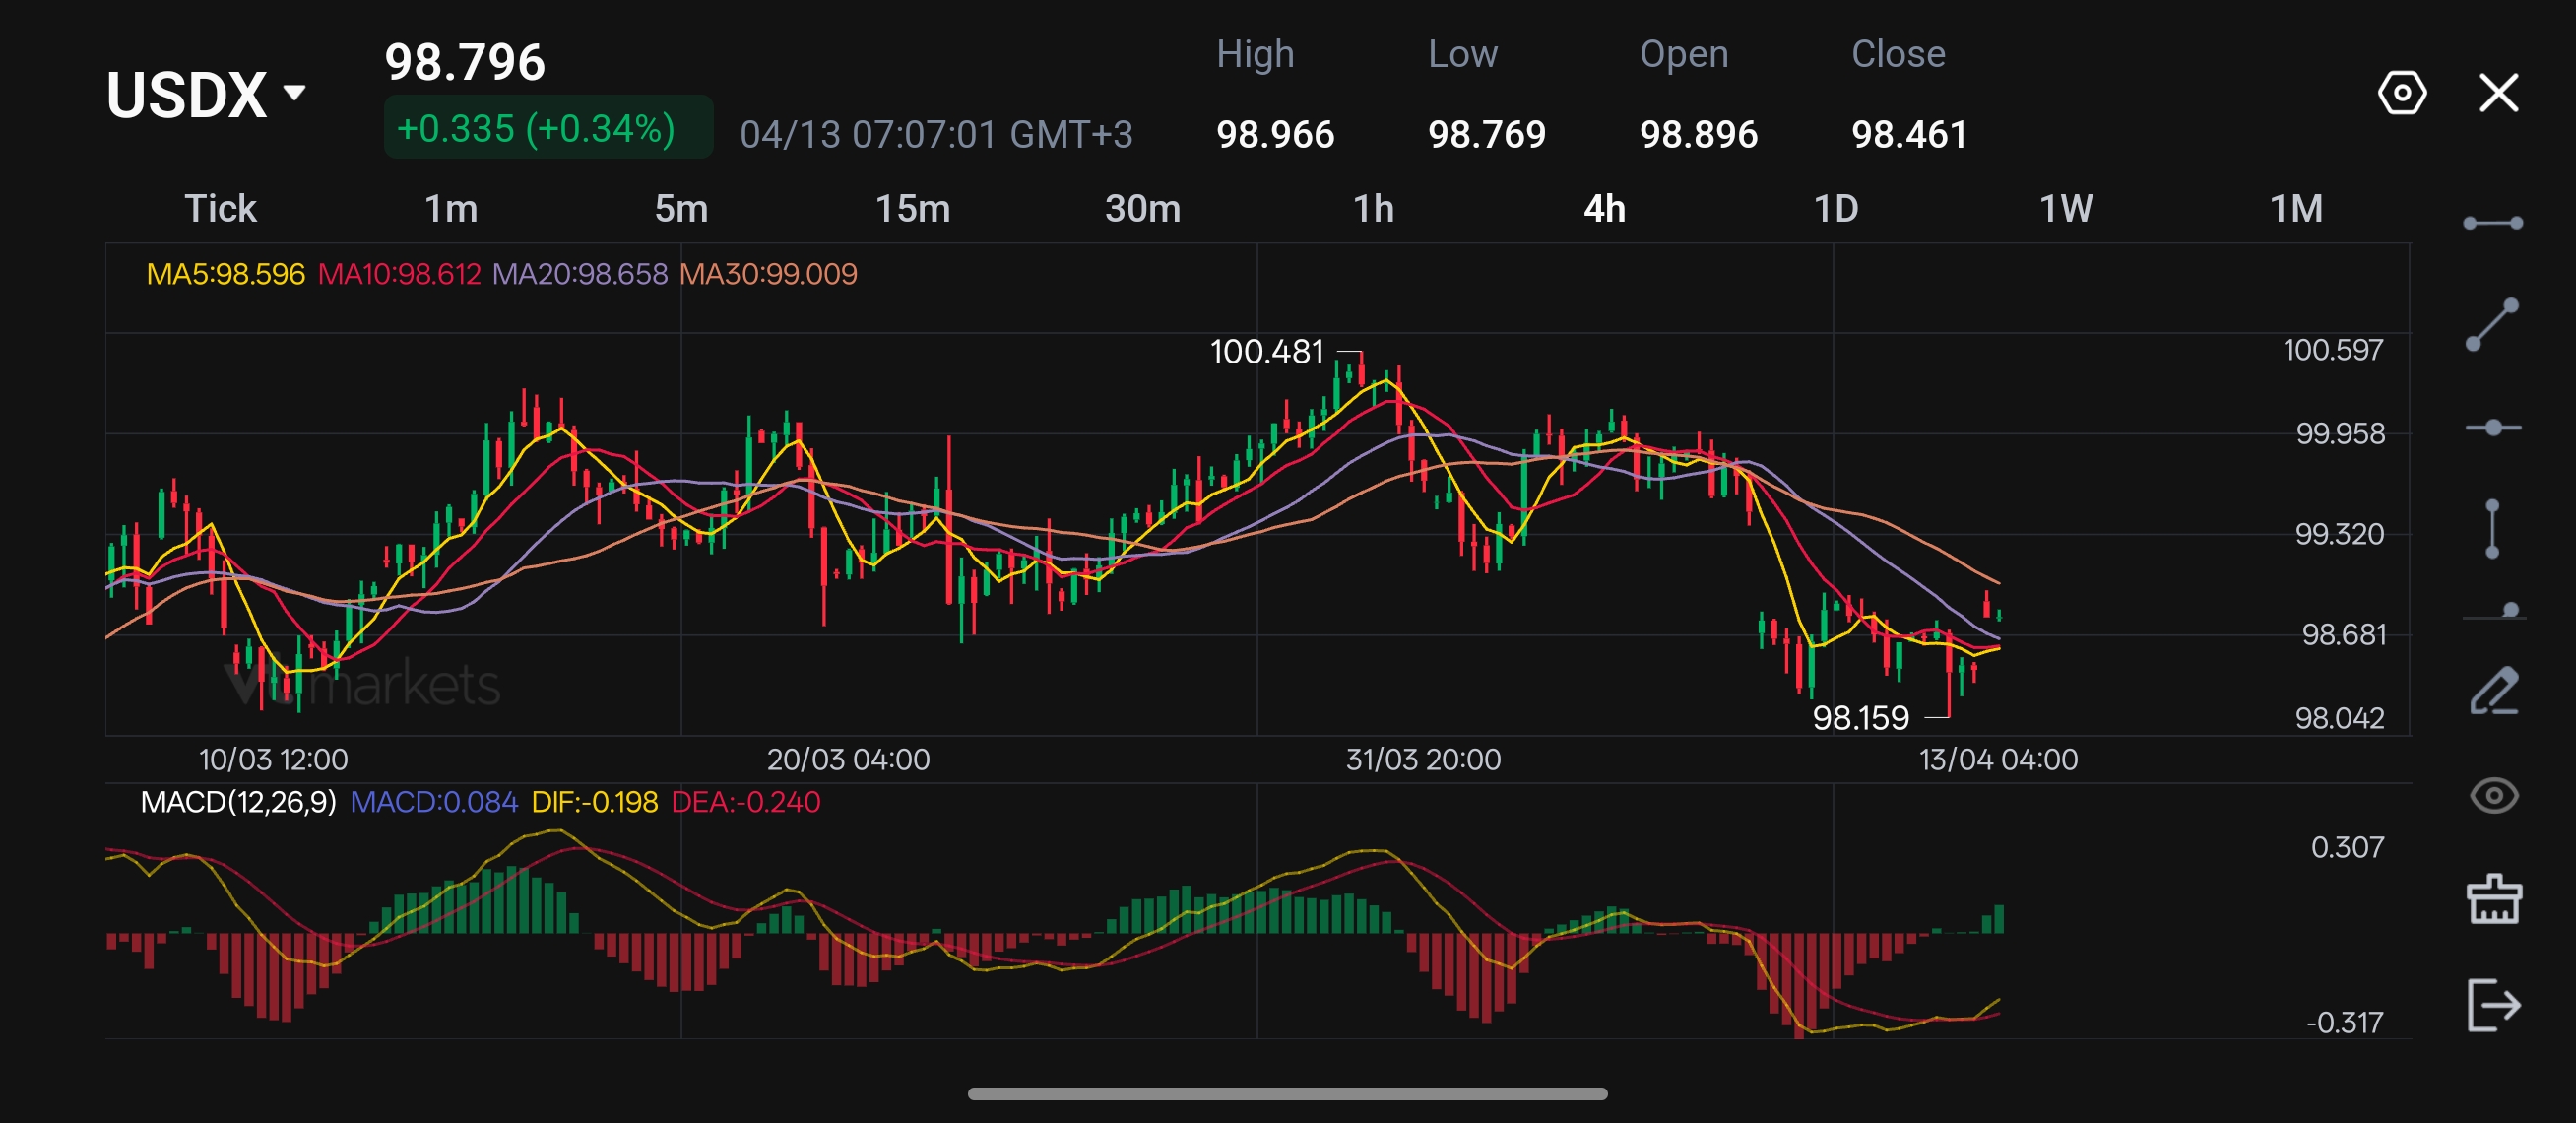
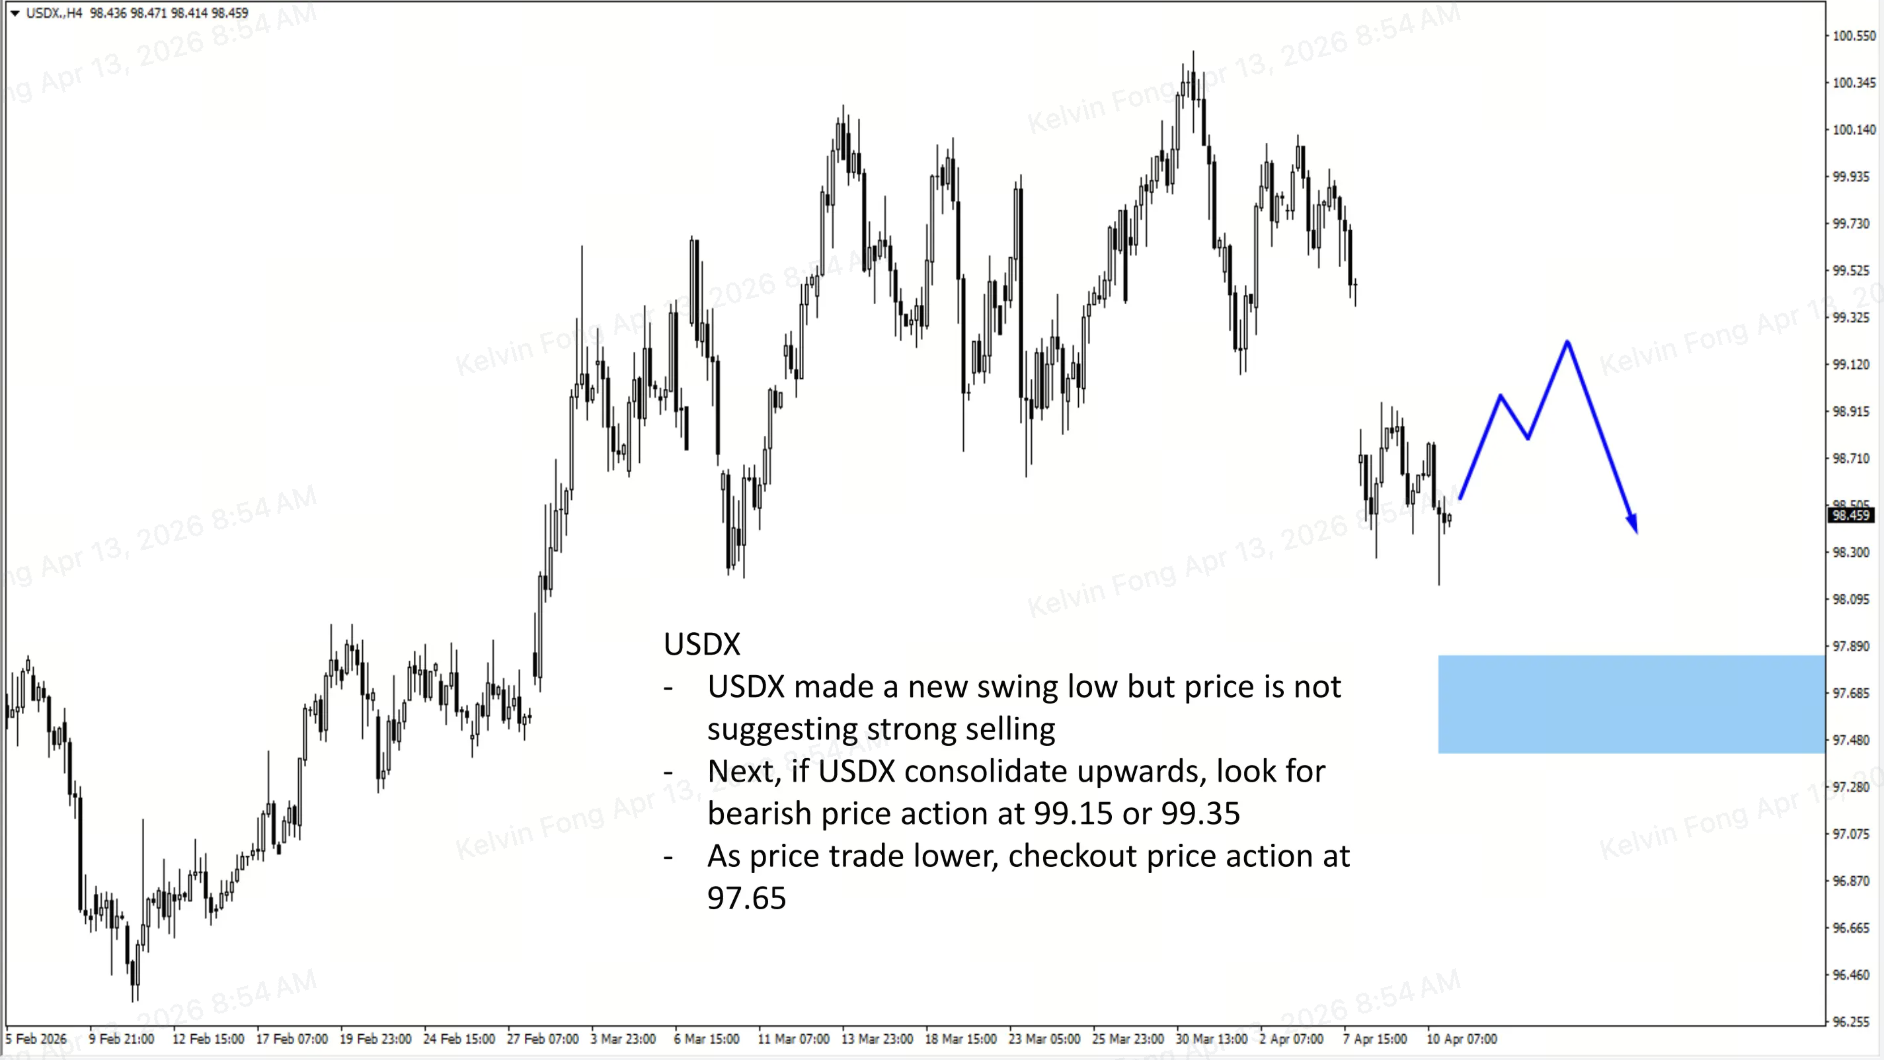
USDX Technical Outlook
The US Dollar Index (DXY), which tracks the USD against a basket of six major currencies, is held in positive territory around 99.00 during Asian trading hours on Monday after trimming earlier gains. The Dollar is currently trading in a short term downtrend as investors still believe there are chances for a rate cut in the future which could weaken the Dollar.
The moving averages currently are still aligned for a downtrend and signals for possible shorts. However, MACD histogram currently is showing a possible chance for a retracement towards the upside as there is a bullish histogram above the 0 level. It is best to wait for further updates from the US-Iran negotiations before taking any positions as current directions are still unclear and prices could start to consolidate.
Key Levels To Watch:
Support: 98.42 -> 98.2 -> 97.9
Resistance: 99.17 -> 99.47 -> 99.6
What Comes Next
The dollar appears supported as long as the ceasefire remains fragile and the threat to energy flows stays active. The next phase will depend on whether tensions stabilise or move into a more disruptive stage.
If the situation around Hormuz worsens and oil extends its rise, the dollar may continue to hold firm or push higher. If diplomatic efforts restart and crude begins to ease, part of this latest safe-haven premium may unwind again.
The rebound was driven by renewed safe-haven demand after US-Iran talks in Islamabad ended without a breakthrough. That outcome weakened confidence in the ceasefire and pushed investors back toward more defensive positioning.
Why is the Strait of Hormuz so important to this market move?
The Strait of Hormuz is one of the world’s most important oil transit routes. Any threat to shipping there can quickly raise concerns over energy supply, inflation, and broader market stability.
How do higher oil prices support the dollar?
Higher oil prices can strengthen the dollar by increasing inflation concerns and reducing the likelihood of near-term policy easing. In a risk-off environment, that can make the greenback more attractive to investors.
Why did currencies such as the Australian dollar and sterling weaken?
These currencies tend to be more sensitive to shifts in global risk sentiment. As markets moved back into a defensive stance, investors reduced exposure to risk-sensitive currencies and rotated back toward the US dollar.
What is the market watching next for the US Dollar Index?
Markets are watching whether tensions around Iran and the Strait of Hormuz ease or intensify. The next move in the dollar will likely depend on whether geopolitical risk and energy prices continue to rise or begin to stabilise.
Start trading now – Click here to create your real VT Markets account
Written on April 13, 2026 at 6:17 am, by josephine
Gold prices in India fell on Monday, based on data compiled by FXStreet. Gold was priced at INR 14,228.50 per gram, down from INR 14,343.13 on Friday.
Gold dropped to INR 165,964.10 per tola from INR 167,297.20 per tola on Friday. Other listed prices were INR 142,286.90 for 10 grams and INR 442,562.80 per troy ounce.
How Fxstreet Calculates Indian Gold Prices
FXStreet derives Indian gold prices by converting international pricing using USD/INR and then applying local measurement units. The figures are updated daily using market rates at the time of publication, and local prices may vary slightly.
Gold is used as a store of value and for jewellery, and it is often treated as a safe-haven asset during market stress. It is also used as a hedge against inflation and currency depreciation.
Central banks are the largest holders of gold and bought 1,136 tonnes worth about $70 billion in 2022, according to the World Gold Council. Gold often moves inversely to the US Dollar and US Treasuries, and it may also move opposite to risk assets such as equities.
Gold prices can be influenced by geopolitics, recession fears, interest rates, and the US Dollar, as gold is priced in dollars (XAU/USD). The post states that an automation tool was used to create it.
Trade Setup And Market Outlook
The recent dip in gold prices to around 14,228 INR per gram should be seen as a temporary pause rather than a change in the primary uptrend. This price level, still remarkably high in historical terms, reflects persistent inflationary pressures we have seen over the past two years. Derivative traders should view this minor weakness as a potential entry point, not a signal to short the market.
The key driver remains central bank policy, particularly from the US Federal Reserve. With the latest March 2026 US inflation data holding at 3.1%, the Fed has maintained its hawkish stance, but market futures are pricing in a greater than 60% probability of a rate cut before the end of the year. Any confirmation of this policy pivot would likely weaken the US Dollar and ignite the next leg up in gold prices.
This dynamic is supported by immense institutional demand, which provides a strong floor for the price. The World Gold Council’s data for the first quarter of 2026 shows central banks globally added another 290 tonnes to their reserves, continuing the de-dollarization trend that accelerated back in 2022. This consistent buying from major players like China and India insulates gold from deeper price corrections.
Looking back at the market action during 2025, we saw similar periods of consolidation whenever strong US economic data was released. These phases shook out weaker hands before the uptrend resumed, often driven by renewed geopolitical tensions or a weaker dollar. The current setup feels very familiar to the pattern we observed last summer.
For the coming weeks, we believe traders should consider strategies that benefit from a rise in price or volatility. Buying long-dated call options, such as those for December 2026, allows for participation in the expected year-end rally while defining risk. More conservative traders might look at selling cash-secured puts below the current market price to collect premium, with the intention of buying gold at a lower price if it dips further.
However, we must remain aware of the primary risk to this outlook. A series of unexpectedly strong US employment or manufacturing reports could delay the Fed’s anticipated rate cuts, strengthening the dollar and pushing gold lower. The latest Commitment of Traders report already shows large speculators have slightly reduced their net-long positions, suggesting some caution is warranted.
Gold prices in Malaysia fell on Monday, based on FXStreet data. Gold was MYR 602.24 per gram, down from MYR 606.73 on Friday.
Gold also dropped to MYR 7,024.34 per tola from MYR 7,076.77 on Friday. Other listed prices were MYR 6,022.34 for 10 grams and MYR 18,731.64 per troy ounce.
How FXStreet Calculates Local Gold Prices
FXStreet converts international prices into MYR using the USD/MYR rate and local units. The figures are updated daily at the time of publication and are for reference, as local rates may differ slightly.
Central banks are the largest holders of gold and use it as part of their reserves. World Gold Council data shows central banks added 1,136 tonnes of gold worth about $70 billion in 2022, the highest annual total on record.
Gold often moves opposite to the US Dollar and US Treasuries, and can also move against risk assets such as shares. Its price can change with geopolitics, recession fears, interest rates, and shifts in the US Dollar because gold is priced in dollars (XAU/USD).
While gold prices saw a minor dip to 602.24 MYR per gram, we view this as short-term noise rather than a trend reversal. This slight pullback could present a buying opportunity for those looking to enter or add to long positions. The key drivers remain favorable, particularly shifting central bank policies and persistent global uncertainty.
Market Outlook For Gold
The US Dollar Index has softened, falling over the last month as we see the Federal Reserve signal a more dovish stance for the second half of the year. Looking back, the aggressive rate hikes that ended in 2025 successfully tempered inflation, but now the focus is on avoiding a sharp economic slowdown. As a non-yielding asset, gold becomes more attractive when interest rates are expected to fall.
We cannot ignore the relentless demand from central banks, a powerful trend that accelerated back in 2022 and has not slowed. Data from the first quarter of 2026 shows emerging market central banks, particularly those in Asia, added another 200 tonnes to their reserves. This consistent buying creates a strong floor for prices and absorbs any significant dips in the market.
Ongoing geopolitical tensions are reinforcing gold’s role as a primary safe-haven asset, much as we saw during the turbulent periods of 2024 and 2025. We’ve observed that open interest in gold futures and options contracts tends to spike during periods of heightened global uncertainty. This behavior suggests traders are actively hedging against potential disruptions in riskier markets like equities.
For derivative traders, this environment suggests that buying call options or establishing bull call spreads on gold futures could be a prudent strategy over the next few weeks. These positions offer leveraged upside potential while limiting downside risk if the recent price dip extends further. Selling out-of-the-money put options is another way to collect premium, capitalizing on our view that strong underlying demand will provide price support.
Crude remains the lead signal, Brent near $100 and WTI near $105 after a sharp surge.
The Strait of Hormuz blockade drives risk-off and supports oil and USD.
US–Iran talks end in a deadlock, keeping the risk of escalation elevated.
Tuesday’s PPI is the key trigger for inflation and rate expectations.
The new week begins on high alert as the weekend failed to produce a lasting ceasefire. The key catalyst is the start of a naval blockade in the Strait of Hormuz, which has pushed crude oil sharply higher and triggered a defensive shift across global markets.
Markets remained concerned about whether the US-Iran ceasefire will hold as oil prices rose, with energy flows through the Strait of Hormuz remaining restricted https://t.co/AV2iOCQE8wpic.twitter.com/9DspZuVlkW
Brent is trading near $100, while WTI has climbed to around $105 after a volatile surge of nearly 11%. The bias remains firmly upward on any escalation, especially with the current strike pause set to expire Tuesday and no permanent framework in place.
At these levels, oil is no longer just reacting to headlines. Markets are beginning to price in second-order effects such as higher transport costs and persistent inflation, limiting central banks’ ability to ease. The risk is that elevated oil becomes structural rather than temporary.
US–Iran Deadlock, Hormuz Tensions Lift Oil and USD
Top-level talks between the US and Iran concluded without any progress, even after nearly 21 hours of intensive negotiations facilitated by Pakistan. US Vice President JD Vance stated that Washington had presented its final and most comprehensive offer, but Tehran rejected the proposal, resulting in a deadlock.
Adding to tensions, US President Donald Trump announced on Sunday that the US Navy would begin blockading the Strait of Hormuz, putting a fragile two-week ceasefire at risk. This escalation weighs on global risk sentiment and is seen supporting demand for the safe-haven US Dollar (USD).
President Trump said the US Navy would blockade the Strait of Hormuz and interdict every vessel in international waters that paid a toll to Iran after peace talks failed https://t.co/tpzNOS3iWfpic.twitter.com/fHJJOt6KUT
The US Dollar Index (DXY), which tracks the USD against six major currencies, is holding in positive territory after trimming earlier gains, trading near 99.00 during Asian hours on Monday.
US inflation surged in March by the most in nearly four years as the war with Iran sent gasoline prices skyrocketing. The consumer price index rose 0.9% from February.
The dollar strengthened on rising safe-haven demand after US–Iran peace talks collapsed. US Vice President JD Vance confirmed the negotiations in Islamabad ended without a deal after 21 hours of discussions.
San Francisco Fed President Mary Daly told Reuters that if inflation stays elevated, the Fed will keep rates unchanged until price stability is achieved. However, she noted that a rate cut could be considered if tensions with Iran ease quickly and oil prices fall.
PPI: The Supply Chain’s Inflation Reality Check
Tuesday’s Producer Price Index (PPI) release acts as a critical gauge for whether surging energy costs are officially hardening within the supply chain. With Brent Crude hovering above $100 due to the ongoing naval blockade, the market is hypersensitive to any signs that producers are passing these increased input costs down to the consumer level. A hot PPI print would likely cement a higher-for-longer interest rate path, fueling further US Dollar strength while squeezing profit margins for corporate equities already rattled by geopolitical tension.
Hotter unemployment rate could weaken the Aussie Dollar and cause shift in policy tone.
16 Apr
GBP
GDP m/m
0.10%
0.00%
Slight GDP rebound may support GBP and growth sentiment.
For a full view of upcoming economic events, check out VT Markets’ Economic Calendar.
Key Movements Of The Week
USDX
The dollar has gapped up towards the $99 level as investors rotate towards safe havens.
Tuesday’s PPI data could be a key driver for the Dollar as higher PPI data could keep the Dollar strong.
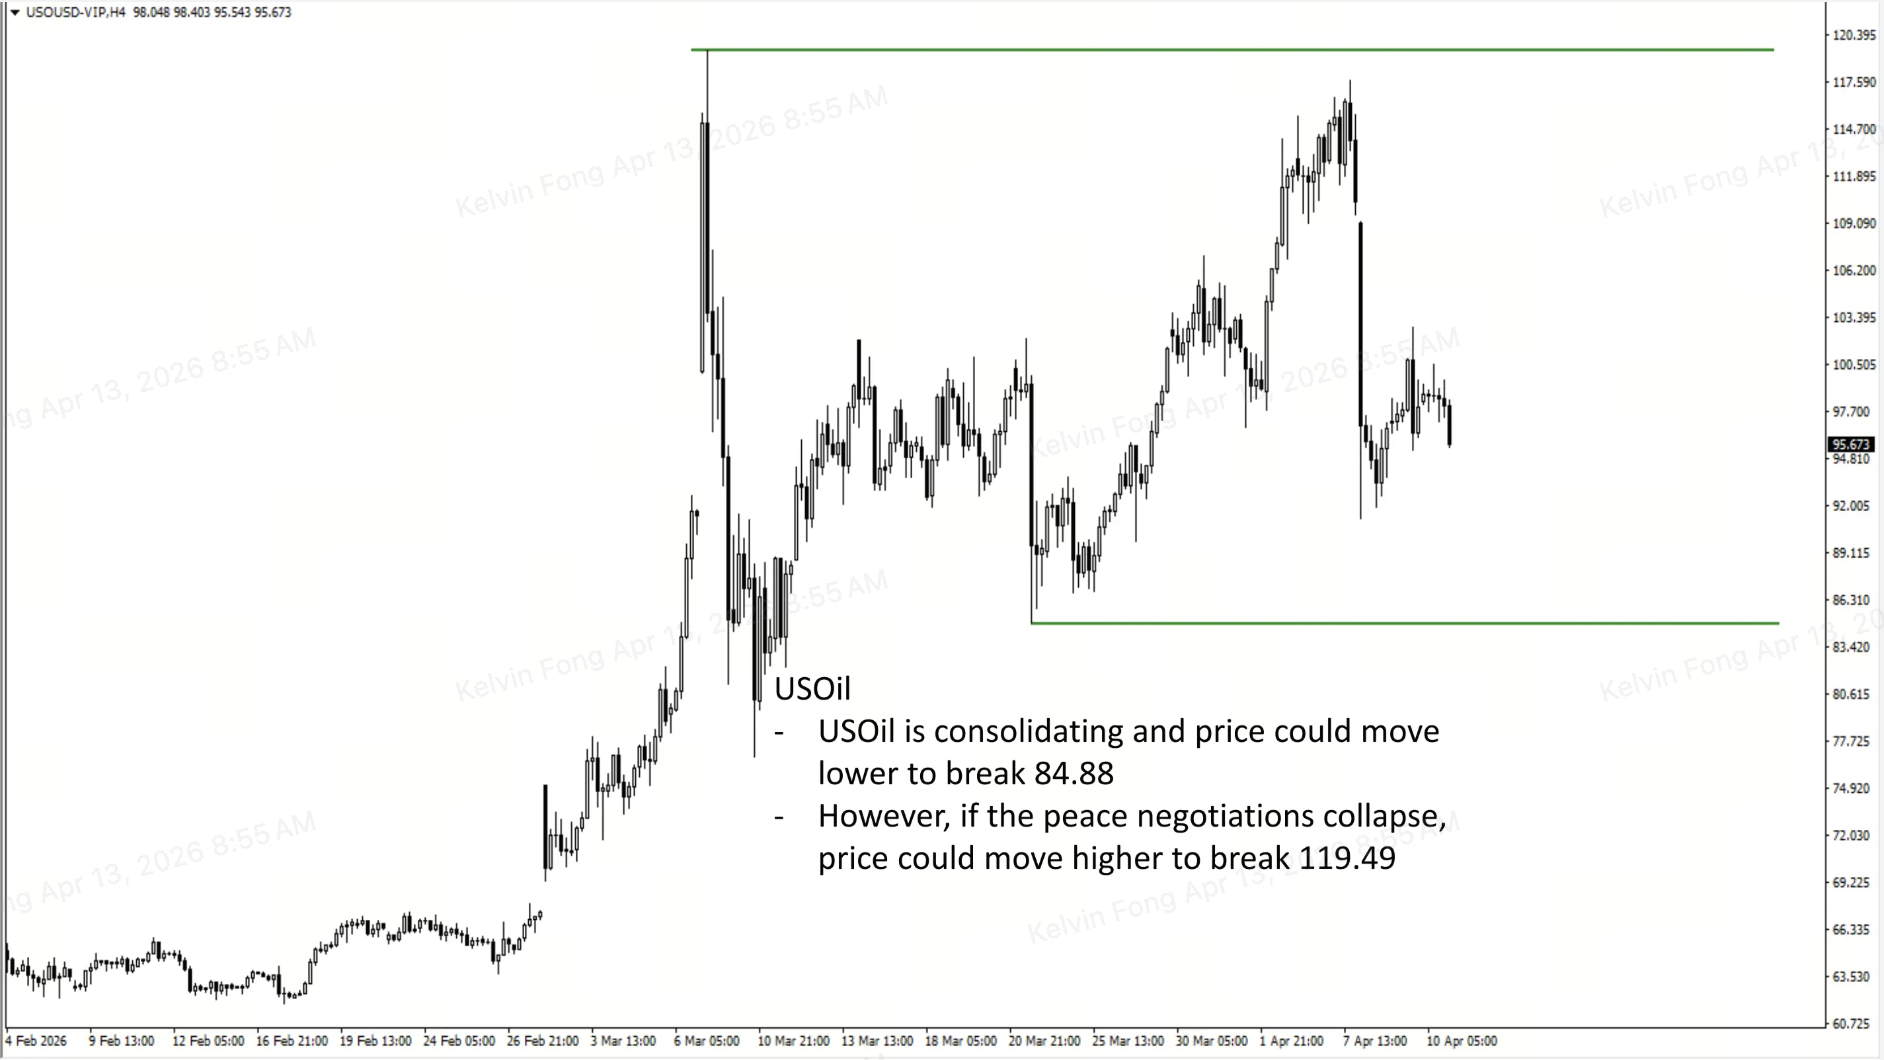
USOil
Oil has gapped up above $100 level as Strait of Hormuz remain blocked.
Ongoing tensions in the Strait of Hormuz could push oil prices higher.
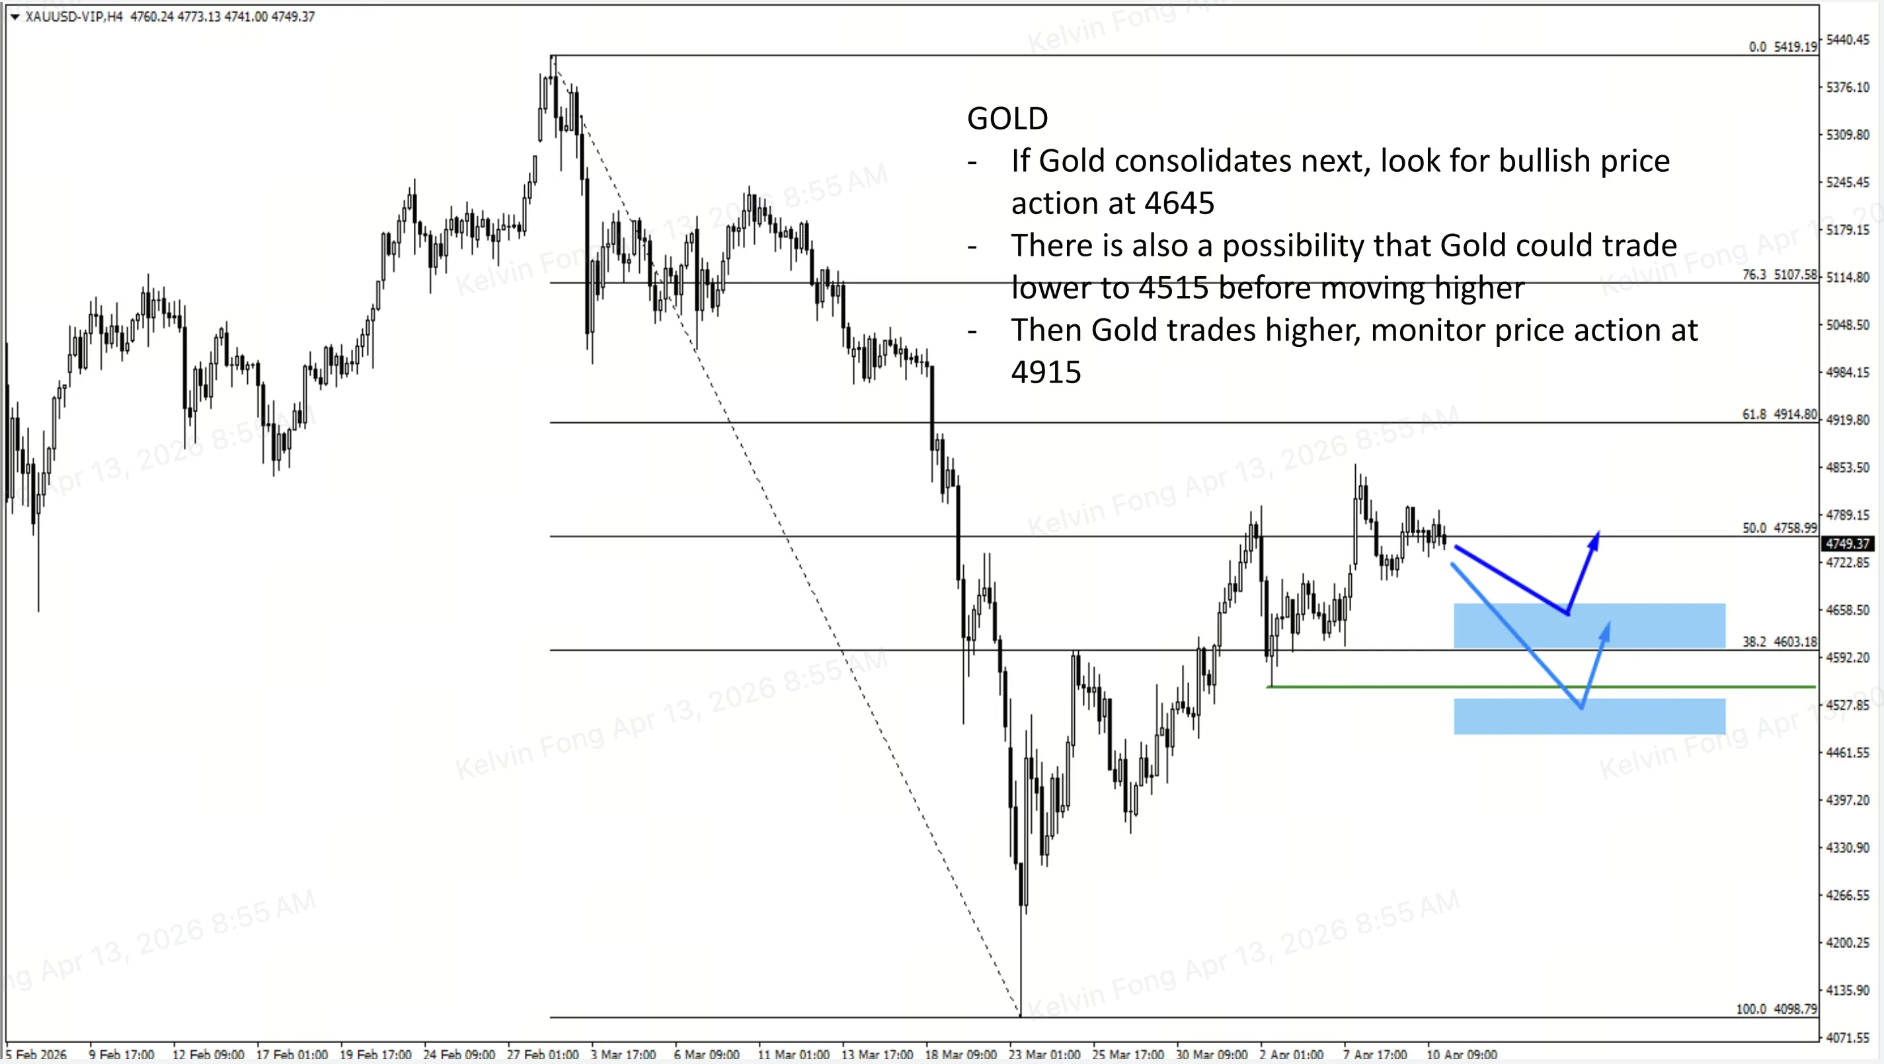
XAUUSD
Gold gapped down on Monday due to investors’ profit-taking to cover margin calls in other assets.
Tuesday’s PPI could negatively affect gold prices if data surges higher than forecast.
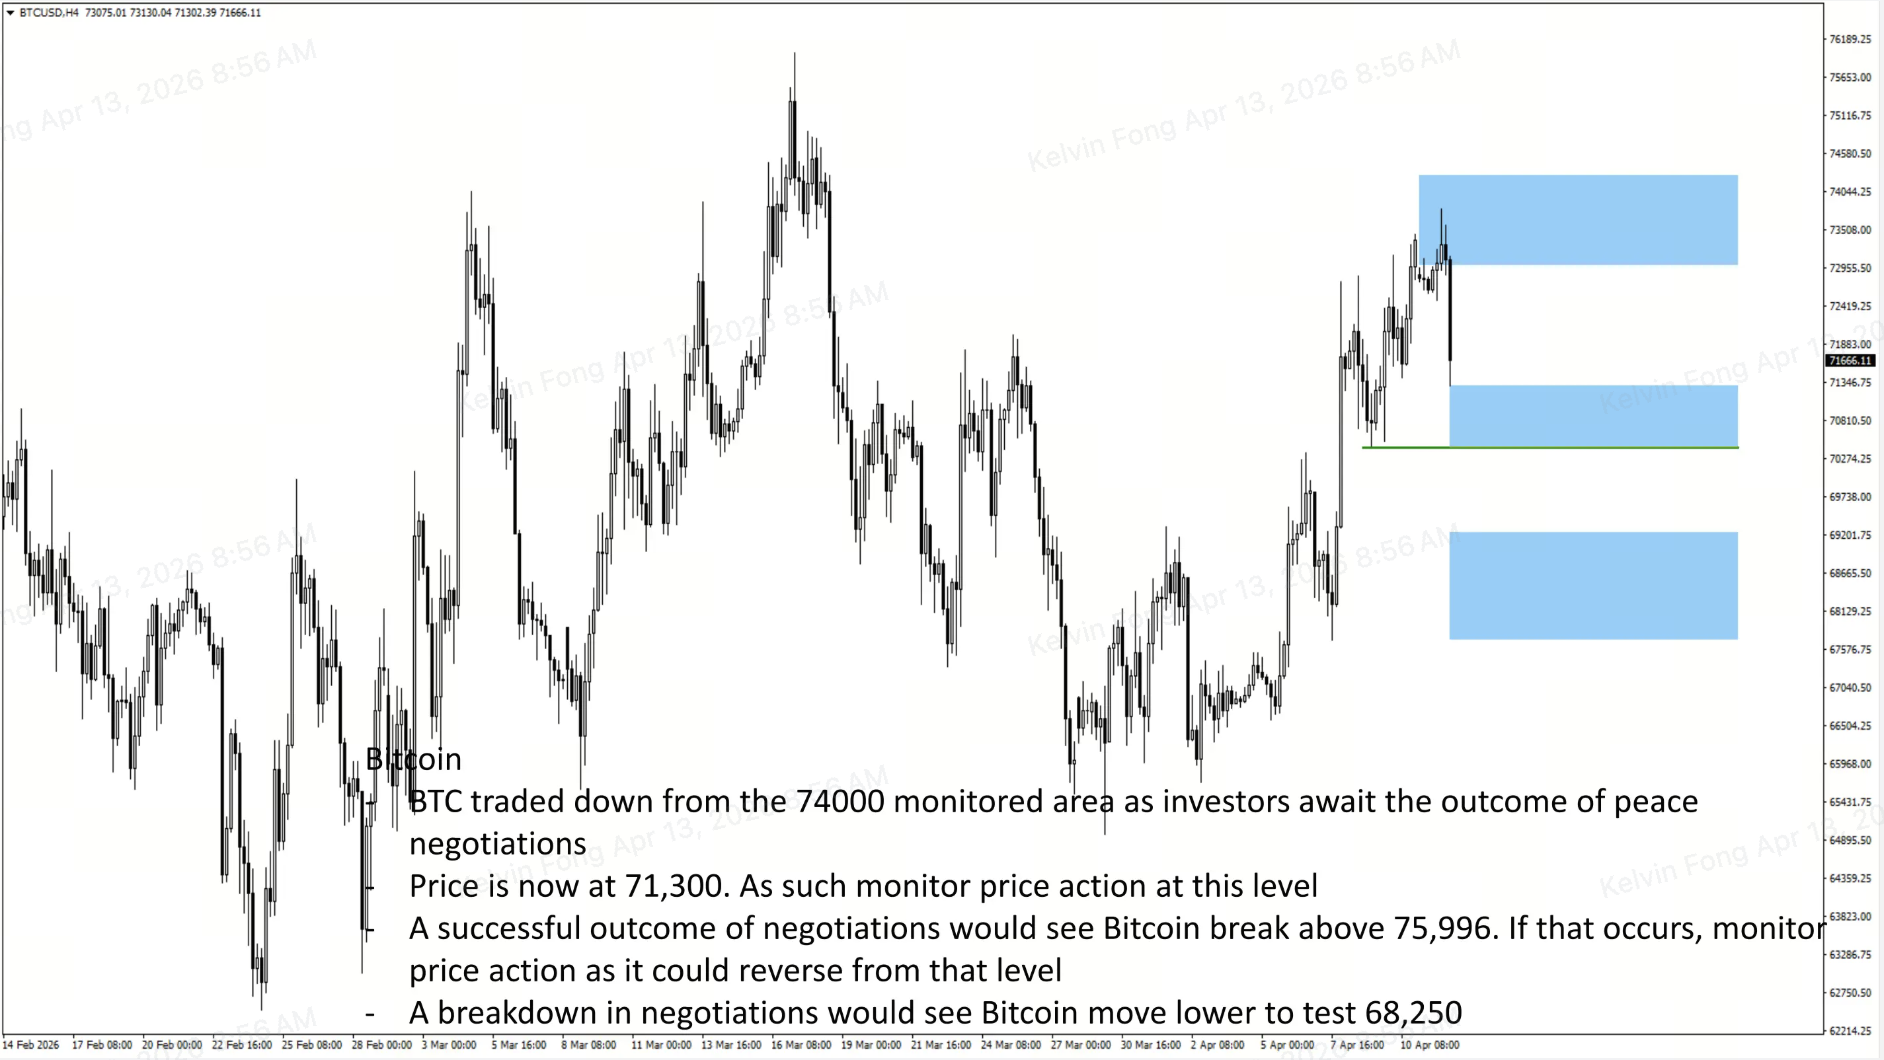
BTCUSD
BTCUSD traded lower during the weekends as negotiations between US and Iran failed.
If Tuesday’s PPI data is higher than expected, it could push Bitcoin’s price lower.
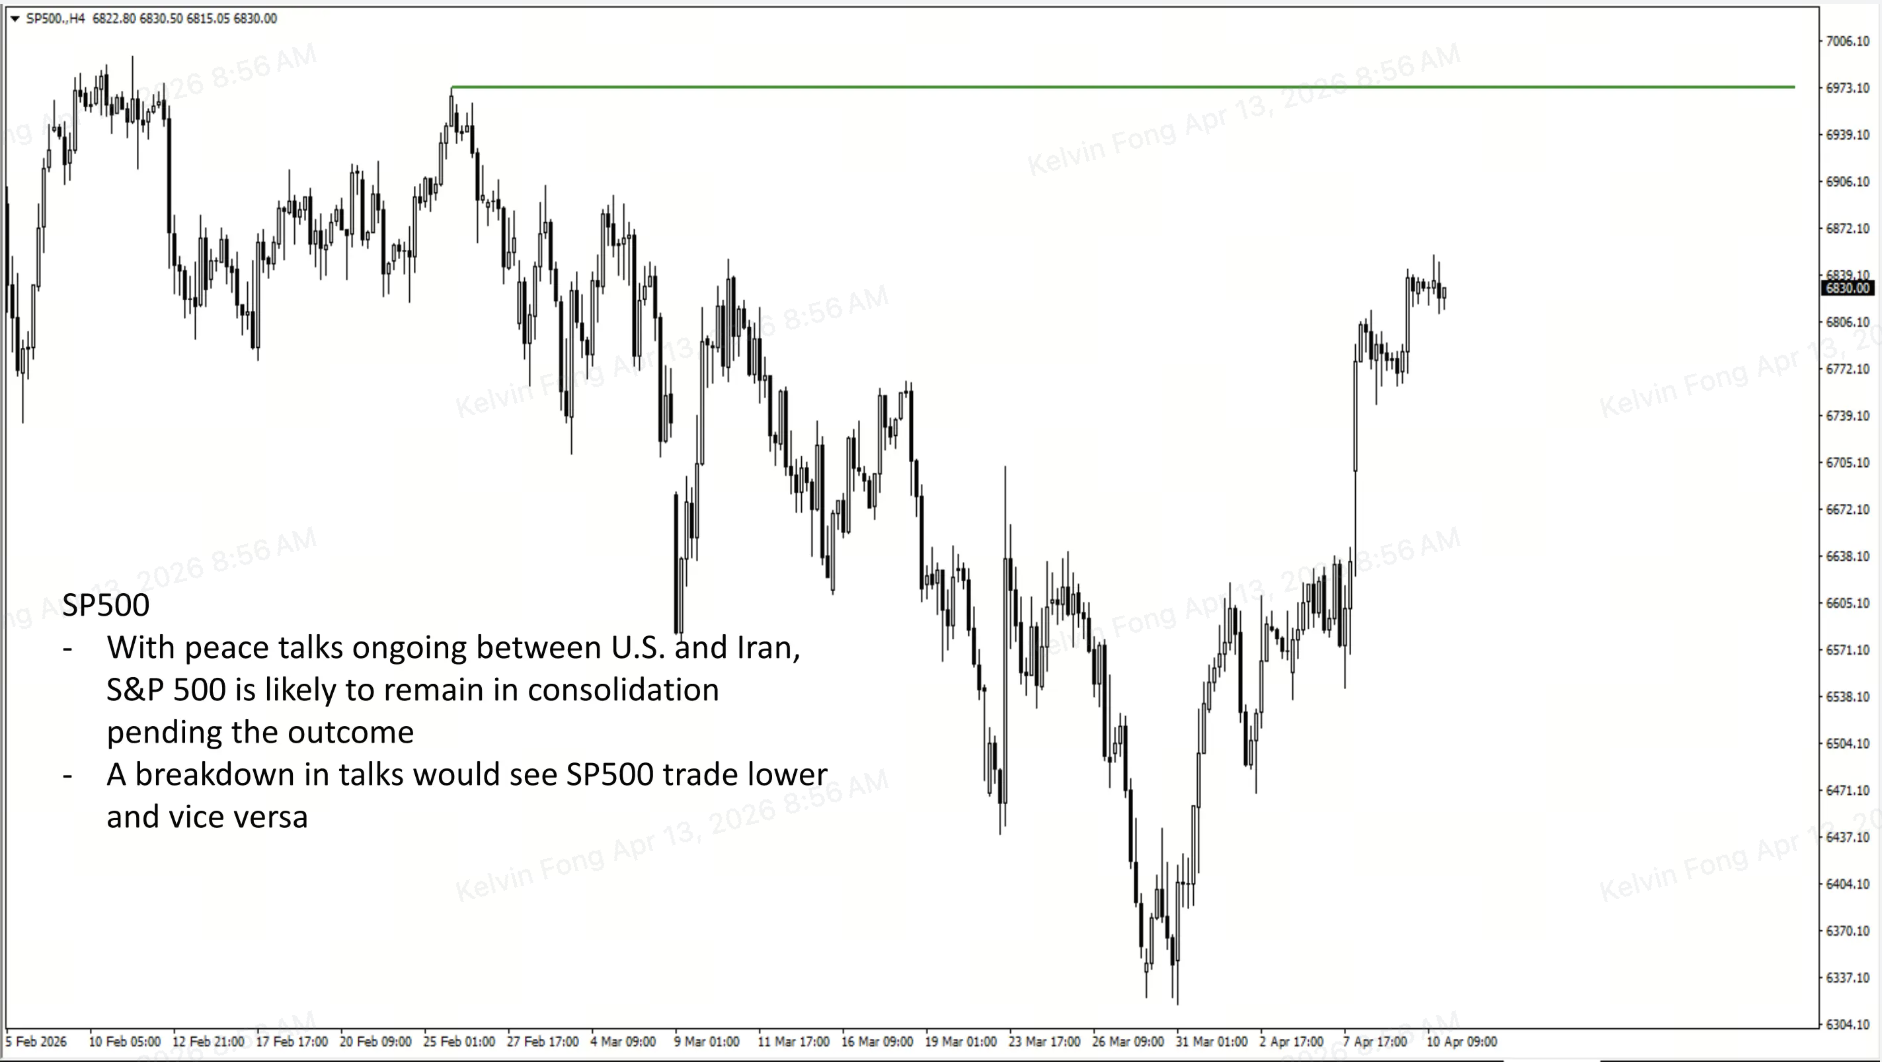
SP500
SP500 gapped lower on the Monday open as investors seek risk-off assets.
If peace talks are not achieved in the near term, it could trigger equities sell off.
Bottom Line
Markets enter the week in a geopolitical risk-off regime, driven by the Strait of Hormuz blockade and failed US–Iran talks, pushing oil sharply higher and supporting the USD. Brent near $100 and WTI near $105 reflect not just headline risk, but growing pricing of persistent inflation pressure through energy and supply chains.
The key macro link now is inflation pass-through: if upcoming PPI confirms rising input costs, it strengthens the case for a higher-for-longer Fed stance, further supporting the dollar while pressuring risk assets.
Create a live VT Markets account today to access our platform features, including market insights and educational content.
Traders FAQ
Why are oil prices rising today?
Crude oil prices are surging because the US has initiated a naval blockade in the Strait of Hormuz. With Brent Crude trading near $100 and WTI climbing toward $105, the market is pricing in a massive supply shock. Since no permanent ceasefire was reached over the weekend, traders expect a significant “war premium” to remain embedded in energy costs.
What happened in the US–Iran peace talks in Islamabad?
The high-level negotiations facilitated by Pakistan ended in a deadlock after 21 hours of intensive discussion. US Vice President JD Vance confirmed that Tehran rejected Washington’s final proposal. This collapse in diplomacy has ended the fragile two-week ceasefire and shifted global sentiment back toward a defensive, risk-off posture.
How does the Strait of Hormuz blockade affect the US Dollar?
The blockade is driving investors toward safe-haven assets, pushing the US Dollar Index (DXY) toward the 99.00 level. Beyond safe-haven demand, the blockade keeps oil prices high, which forces the Federal Reserve to maintain a higher-for-longer interest rate stance to combat inflation, further strengthening the USD.
Will the Federal Reserve cut interest rates in 2026?
Federal Reserve officials, including San Francisco Fed President Mary Daly, have indicated that rates will remain unchanged if inflation stays elevated. While a rate cut could be considered if Middle East tensions ease and oil prices drop, the current blockade makes near-term policy easing unlikely.
Why is the Tuesday PPI data important for the stock market?
The Producer Price Index (PPI) is a critical gauge for supply chain inflation. With energy costs skyrocketing, investors are watching to see if producers pass these costs on to consumers. A high PPI print would confirm that inflation is becoming structural, likely hurting corporate profit margins and pressuring equity valuations.
What is the impact of high oil prices on global inflation?
Elevated oil prices act as a transmission channel for broader macro stress. Beyond immediate fuel costs, they lead to higher transport expenses and stickier inflation prints. This limits the ability of global central banks to provide liquidity or rate relief, increasing the risk of a global economic slowdown.
Start trading now – Click here to create your real VT Markets account
Written on April 13, 2026 at 5:57 am, by josephine
Gold (XAU/USD) rebounded from the $4,633–$4,632 area, a four-day low in Asia on Monday, and closed much of the weekly bearish gap amid mixed signals. A Wall Street Journal report said regional countries are trying to bring the US and Iran back to talks within days after weekend discussions ended without agreement, which limited US dollar gains.
US Vice President JD Vance said a final offer was made but Iran did not accept it, leaving talks stalled. Iranian state media said excessive demands reduced the chance of a deal.
Geopolitical Risks And Dollar Dynamics
US President Donald Trump said the US Navy would begin blockading the Strait of Hormuz, putting a two-week ceasefire at risk. Continued Israeli strikes in Lebanon added to tension, which could support the US dollar and restrict gold gains.
WTI crude rose back to about $105 a barrel after the latest developments. US inflation data for March showed the biggest monthly rise in nearly four years, with CPI up 0.9% month-on-month and 3.3% year-on-year, leading to higher Treasury yields and a firmer dollar.
Technically, gold remained below the 100-hour SMA, with MACD negative and RSI near 44. Resistance was cited at the 100-hour SMA near $4,732.63, while traders monitored recent lows as potential support.
Looking back at the situation in 2025, we saw gold caught between geopolitical fears and a hawkish pivot from central banks. That core conflict remains the primary driver of the market today, April 13, 2026, creating significant uncertainty. This environment suggests derivative traders should focus on volatility and defined-risk strategies.
The Federal Reserve did follow through on the hawkish signals we saw last year, raising the Fed Funds rate to 4.5% to combat the inflation that was running at 3.3% in March 2025. The latest US CPI report for March 2026 showed inflation has cooled to 2.8%, which is an improvement but still stubbornly above the 2% target. This leaves the Fed’s next move in question, creating a tricky environment for gold.
This interest rate of 4.5% puts a ceiling on gold, as holding the non-yielding metal has a high opportunity cost. However, the unresolved tensions in the Strait of Hormuz, which never fully dissipated after the failed talks last year, are providing a solid floor of support under the price. We believe these opposing forces will keep gold trading in a volatile range for the coming weeks.
Options Strategies For Volatile Gold Markets
Given this outlook, traders could consider options strategies that profit from sharp price swings rather than a specific direction. With the Gold Volatility Index (GVZ) currently elevated near 19, purchasing long straddles or strangles could be an effective way to position for a breakout. This involves buying both a call and a put option, profiting if gold makes a significant move either up or down.
For those with a directional bias, buying call options offers a way to bet on an escalation in the Middle East with a capped downside risk. Conversely, if we believe the Fed will signal more hikes to crush the last bit of inflation, put options provide a hedge or a direct bet on lower prices. Using options allows for precise positioning while managing the substantial risks present in the current market.
Hungary held a parliamentary election on Sunday. Péter Magyar, leader of the centre-right opposition Tisza party, defeated Prime Minister Viktor Orbán by a landslide.
With almost all votes counted, officials said Tisza is set to win a two-thirds majority in parliament. The party was currently on 138 seats.
The result ended Orbán’s 16-year period in office. European leaders said it would also change Hungary’s stance inside the European Union.
After the vote, the Hungarian forint rose by over 1.50% against the US dollar on the day. USD/HUF traded near a four-year low of 314.58.
With the Hungarian Forint surging, we see this as the start of a longer-term trend. We should look to gain exposure through derivative markets, such as by buying HUF call options or selling out-of-the-money USD/HUF calls to capitalize on further currency strength. The initial move is sharp, but the fundamental re-rating of the country has just begun.
We have a clear historical precedent for this from looking back at Poland’s election in October 2023. After the pro-EU coalition won, the Polish Zloty rallied nearly 10% against the dollar and the Warsaw WIG20 stock index jumped over 25% in the following four months. We expect Hungarian assets to follow a similar positive trajectory in the coming weeks.
This outlook makes long positions in BUX index futures attractive. The change in government is expected to unlock a significant amount of previously frozen EU funds, specifically the €10.4 billion from the Recovery and Resilience Facility. This capital injection will boost the domestic economy and corporate earnings, making Hungarian equities look cheap at their current levels.
The new political climate significantly reduces Hungary’s country risk premium, which will positively impact government bonds. As yields fall, we should position for this using interest rate futures. This also gives the Hungarian National Bank, which cut its key rate to 7.75% as of its last meeting in March 2026, more room to continue its easing cycle without spooking currency markets.
Finally, implied volatility, which was high leading into this election, is now collapsing. Selling USD/HUF straddles or strangles could be an effective strategy to profit from the return to political stability. The period of uncertainty is over, and we should expect calmer price action moving forward.
Written on April 13, 2026 at 5:30 am, by josephine
WTI futures on NYMEX rose 7.6% to near $98.00 in Asian trading on Monday. The move followed a Truth.Social post from US President Donald Trump saying he instructed the navy to blockade “any or all ships trying to enter or leave” the Strait of Hormuz, a route linked to almost 20% of global energy supply.
The warning followed talks between Iran and US Vice President JD Vance that failed after Iran refused to drop its nuclear ambitions. Trump also ordered the navy to “seek and interdict every vessel in International Waters that has paid a toll to Iran”, adding that “no one who pays an illegal toll will have safe passage on the high seas”.
Hormuz Blockade Threat Drives Oil Spike
US Central Command said forces will start a blockade of all maritime traffic entering and exiting Iranian ports on Monday, 10 AM ET (14:00 GMT). Separately, Saudi Arabia said it restored full pumping capacity of its East-West pipeline to seven million barrels a day.
On the daily chart, WTI traded around $98 and stayed above the 20-day EMA at $93.41. The RSI (14) was 56.23, with support near $93.41 and a higher level near $106.70.
The move towards $98 a barrel signals a significant shift in market dynamics, and we must position for further price increases. A full blockade of the Strait of Hormuz would represent the most severe supply disruption since the 1970s. This is a time to prepare for extreme volatility and substantial upward price pressure in the coming weeks.
We are observing a massive influx into out-of-the-money call options for WTI, specifically for the June and July contracts with strike prices above $110. Implied volatility on near-term options has surged past 65%, reflecting the market’s anticipation of sharp, unpredictable price movements. This indicates that the cost of insuring against price spikes is rising rapidly, a trend we expect to continue.
This supply shock is occurring at a time when the market is already tight, which will magnify its impact. The most recent Energy Information Administration (EIA) report showed a drawdown in U.S. crude inventories of 3.8 million barrels, surprising analysts who had predicted a small build. This pre-existing supply tightness provides very little cushion for the loss of Iranian barrels.
Positioning And Risk Management
Technically, the price holding firmly above the 20-day moving average near $93.41 confirms the bullish trend. We should view any pullbacks to this level as opportunities to add to long positions. The next logical price target is the recent high around $106.70, a level that could be tested very soon.
We must recall the market reaction to the start of the Ukraine war back in 2022, when WTI soared from around $90 to over $120 in just a few weeks. The current threat to the Strait of Hormuz has the potential to trigger a similar, if not more aggressive, price rally given the volume of oil that passes through it daily.
While the primary strategy is to be long, we should not ignore the risks of a sudden de-escalation. The news that Saudi Arabia has restored its East-West pipeline capacity offers a minor offset but cannot replace the nearly 20 million barrels per day that transit Hormuz. Therefore, using put spreads to hedge long futures positions could be a prudent way to protect against a sudden diplomatic breakthrough.
EUR/USD rose after opening with a gap down and traded near 1.1690 in Asian hours on Monday. The daily chart shows the pair moving higher within an ascending channel.
The pair remains above the nine-day and 50-day Exponential Moving Averages (EMAs), which points to an upward tilt. The 14-day Relative Strength Index is near 56, indicating upward momentum that is not overstretched.
Resistance is seen near the top of the channel around 1.1750, then at the eight-week high of 1.1834 set on 23 February. If price moves above that area, the next level is around 1.2082, the highest since June 2021, reached on 27 January.
Support sits at the 50-day EMA of 1.1640 and the nine-day EMA of 1.1636. Below those, attention turns to the lower channel boundary near 1.1500 and the eight-month low of 1.1411 from 13 March.
The technical analysis was produced with the help of an AI tool.
Looking back at the analysis from around this time in 2025, we recall a bullish technical setup for EUR/USD, with the pair holding within an ascending channel. The expectation was for a potential test of the 1.1750 resistance zone. That particular price structure pointed towards buying on dips as a primary strategy.
That upside momentum never fully materialized last year, as the pair instead saw significant pressure from a more cautious European Central Bank. We remember that industrial production figures out of Germany were particularly weak in the second half of 2025, which capped the euro’s strength. The pair spent much of late 2025 consolidating well below the 1.12 mark.
Now, in April 2026, the fundamental picture has shifted significantly. Eurostat’s latest flash estimate for March inflation came in at 2.4%, perfectly in line with the ECB’s target. This stable inflation reading gives the central bank room to hold its policy steady, providing a firm base for the currency.
On the other side of the pair, futures markets are now pricing in a greater than 70% probability of a Federal Reserve rate cut by this summer. This view has been reinforced by the latest U.S. jobless claims data, which ticked up to 225,000, its highest level in four months. This policy divergence is creating a clear tailwind for EUR/USD that was absent in 2025.
For the coming weeks, derivative traders should consider strategies that benefit from a gradual grind higher, rather than explosive momentum. Buying call options with strike prices around 1.1200 and expirations in June 2026 allows for participation in the upside while defining risk. The implied volatility is currently low, making long-option strategies relatively inexpensive.
We must use the current 50-day EMA near 1.0950 as a key level for risk management. A sustained break below this area would challenge the bullish outlook. Therefore, purchasing protective puts with a strike near 1.0900 could be a prudent hedge against any unexpected reversal in sentiment.
Written on April 13, 2026 at 4:59 am, by josephine
USD/JPY extended gains from the past two days and opened the week with a bullish gap, rising to around 159.85 in the Asian session. Further upside was limited by concern about possible market intervention.
Risk-off trading followed failed US-Iran peace talks, supporting the US dollar’s role as a reserve currency. Higher crude oil prices added to inflation concerns and supported expectations of a hawkish Federal Reserve stance.
Yen Weakness And Intervention Watch
The yen faced pressure from worries about imported energy costs linked to the Middle East conflict. At the same time, talk of official action to limit yen weakness reduced the scope for further USD/JPY gains.
The pair kept a bullish bias after holding above the 158.25–158.20 support area last week. It also remained above the 200-period simple moving average, with the RSI near 63 and the MACD strengthening.
Traders may look for a sustained move above 160.00 before expecting more gains. Support levels include the 200-period SMA at 158.56, then 158.25–158.20 and 158.00, with a break below these levels increasing downside risk.
We recall a similar environment back in 2025, when failed US-Iran talks and rising oil prices created a strong bid for the US Dollar. At that time, the market was nervously watching the pair approach the 160.00 level, with the constant threat of intervention capping the rally. That period taught us that fundamentals can push a currency pair to a breaking point, but political risk ultimately sets the ceiling.
April 2026 Market Setup
Now in April 2026, we see a familiar pattern, with the pair pushing new highs near 162.50. Recent US inflation data, showing a core CPI of 3.4%, has once again postponed expectations for Federal Reserve rate cuts. This policy difference with the Bank of Japan, which has only moved cautiously away from its ultra-loose policy, provides a powerful tailwind for USD/JPY.
Given this backdrop, buying call options is a prudent way to stay long with a defined risk. This allows traders to benefit from further upside if the trend continues but limits the maximum loss to the premium paid should Japanese authorities intervene suddenly. We saw how the Ministry of Finance acted decisively in 2024, causing a multi-yen drop in minutes, a lesson we must not forget.
For those more wary of a pullback, buying out-of-the-money put options can serve as a cheap form of insurance. This strategy is especially useful for hedging existing long positions against a sharp reversal caused by intervention. The implied volatility in options will rise as the pair grinds higher, reflecting the market’s increasing anxiety.
Ultimately, the technical picture we saw in 2025, with the RSI below overbought territory and a positive MACD, is similar to today’s setup, suggesting the underlying momentum remains. However, the key is using derivative structures, like bull call spreads, to lower entry costs and manage risk around this critical zone. The fundamental case for a higher USD/JPY is strong, but the risk of a sudden, policy-driven reversal is equally significant.