GBP/USD pared some losses after opening with a gap down, but stayed lower near 1.3500 in Asian trading on Monday. The US Dollar found support from safe-haven demand linked to renewed US–Iran tensions.
The Guardian reported that Iran’s Foreign Ministry spokesman Esmail Baghaei said a US blockade of Iran’s ports and coastline is aggression that violates the ceasefire. He said it amounts to collective punishment, and described it as a war crime and crimes against humanity.
The pair moved further from a two-month high near 1.3600 reached on Friday. It recovered a few pips from a one-week low set in early Asian trade, and was still down over 0.15% on the day.
Risk sentiment weakened amid tensions over the Straight of Hormuz. Iran closed the waterway after briefly opening it over the weekend, alongside a US naval blockade of Iranian ports.
The developments reduced expectations for further peace talks. The current ceasefire is due to end on 22 April.
We are seeing a familiar pattern as geopolitical risk drives a flight to the safe-haven US Dollar, much like we observed during the Middle East flare-up in April 2025. This move is pressuring GBP/USD and we should anticipate further strength in the dollar index (DXY), which has already pushed past the 106.00 mark recently. Derivative traders should be positioned for a risk-off environment to persist in the short term.
The looming April 22 ceasefire deadline is a significant catalyst for a spike in market volatility. During a similar escalation last year, the VIX index, which measures expected market volatility, jumped by nearly 25% in just a few days. Therefore, buying GBP/USD put options offers a direct way to hedge against a breakdown in talks and a subsequent sharp move lower in the currency pair.
The closure of the Strait of Hormuz is a critical factor, as nearly 20 million barrels of oil, or about 20% of global consumption, pass through it daily. A sustained blockage could drive Brent crude prices back over $100 per barrel, creating an inflationary shock that complicates the Bank of England’s policy. While this could argue for a hawkish central bank, the immediate safe-haven demand for the dollar is the dominant trading theme.
We should also monitor the options market, particularly the skew in GBP/USD risk reversals, which currently show a growing premium for puts over calls. This indicates that market participants are actively buying downside protection against a fall in the pound. This growing bearish sentiment could be exploited by setting up trades like bear call spreads, which would profit if the pair remains below a certain level like 1.3600.
Written on April 20, 2026 at 9:00 am, by josephine
USD/CAD held near 1.3700 in late Asian trading on Monday, keeping Friday’s rebound in place. The move came as renewed doubts about the US–Iran temporary ceasefire supported demand for the US Dollar.
The US Dollar Index (DXY) rose 0.1% to about 98.30. Iran said it will not restart talks with the US, referring to “excessive demands, unrealistic expectations, constant shifts in stance, repeated contradictions, and the ongoing naval blockade”.
In Canada, markets are watching March Consumer Price Index (CPI) data due at 12:30 GMT. Headline CPI is forecast to rise 1.1% month-on-month, up from 0.5% in February.
USD/CAD was marginally higher around 1.3700 at the time of writing. It remained below the 20-day exponential moving average at 1.3780, which kept the near-term bias negative.
The Relative Strength Index stood at 38.8, close to oversold levels. Resistance is at 1.3780, while support is near 1.3650 and then 1.3530 if 1.3650 breaks.
The technical section was produced with help from an AI tool.
We remember this time last year, in April 2025, when USD/CAD was hovering around 1.3700. The focus then was on US-Iran tensions boosting the dollar’s safe-haven appeal, even as we awaited a hot Canadian inflation report. It was a market driven by geopolitical fear more than economic data.
Today, the situation has evolved, with the pair now trading much firmer near 1.3950. The primary driver is no longer just a flight to safety but a clear divergence in central bank policy that has become more pronounced over the past year. We are now seeing the US Federal Reserve hold rates steady while the Bank of Canada signals potential cuts.
This policy gap is backed by recent data showing Canadian CPI for March 2026 came in at just 0.3% month-over-month, below expectations and slowing the annual rate to 2.1%. In contrast, the latest US inflation figures remain sticky above 3.5%, giving the Fed little room to ease policy. This fundamental divergence suggests continued strength for the US dollar against the loonie.
For derivative traders, this environment supports strategies that profit from a continued upward grind in USD/CAD. Buying call options with a strike price around 1.4050 for the coming weeks offers a way to capitalize on this momentum. This allows for upside exposure while defining the maximum risk to the premium paid.
Given that one-month implied volatility has ticked up to 8.5% on this policy uncertainty, outright calls can be expensive. A more cost-effective approach would be a bullish call spread, such as buying the 1.4000 call and selling the 1.4150 call. This strategy caps potential gains but significantly reduces the initial cash outlay.
We must also consider risks that could reverse the trend, such as a surprisingly strong Canadian jobs report or a sudden dovish shift from the Fed. Traders looking to hedge long Canadian asset exposure could consider buying put options below the 1.3800 level. This would offer protection if the recent support levels fail to hold and the pair reverses course.
Written on April 20, 2026 at 8:44 am, by josephine
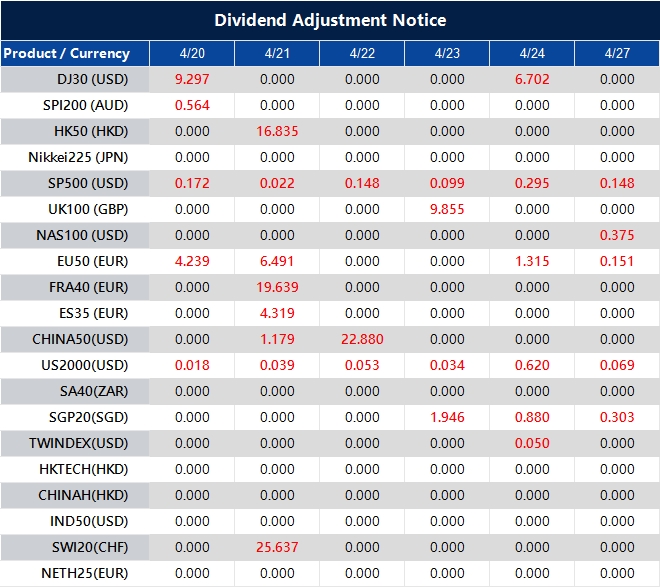
Please note that the dividends of the following products will be adjusted accordingly. Index dividends will be executed separately through a balance statement directly to your trading account, and the comment will be in the following format “Div & Product Name & Net Volume”.
Please refer to the table below for more details:
The above data is for reference only, please refer to the MT4/MT5 software for specific data.
If you’d like more information, please don’t hesitate to contact [email protected].
Gold prices in Saudi Arabia fell on Monday, based on FXStreet data. Gold was priced at SAR 577.83 per gram, down from SAR 582.54 on Friday.
Gold also eased to SAR 6,739.74 per tola from SAR 6,794.59 per tola. Other listed prices were SAR 5,778.34 for 10 grams and SAR 17,972.60 per troy ounce.
FXStreet derives Saudi prices by converting international gold prices using the USD/SAR rate and local units. Prices are updated daily at the time of publication and are for reference, as local rates may differ slightly.
Gold is used as a store of value, a medium of exchange, and for jewellery. It is also used as a hedge against inflation and currency depreciation.
Central banks are the largest holders of gold and may buy it to diversify reserves. They added 1,136 tonnes worth about $70 billion in 2022, the highest annual total since records began, with China, India and Turkey among those increasing reserves.
Gold often moves inversely to the US Dollar and US Treasuries, and can also move opposite to equities. Prices are influenced by geopolitical risks, recession fears, interest rates, and the strength of the US Dollar.
We are seeing a minor dip in gold prices, which can be viewed as a slight pause after a significant rally. This small pullback should not be mistaken for a change in the underlying trend. For derivative traders, such moments often present opportunities rather than signal a reversal.
The fundamental support for gold remains strong due to large-scale buying from central banks. Looking back at the data from 2025, we saw central banks add over 1,037 tonnes to their reserves, nearly matching the record levels we saw a couple of years prior. This consistent demand creates a solid price floor, suggesting any significant drop would be met with strong buying interest.
Geopolitical instability also continues to fuel gold’s appeal as a safe-haven asset. Ongoing tensions in key global regions provide a persistent reason for investors to hold gold as a form of insurance. Therefore, we believe any price weakness in the coming weeks will likely be short-lived.
The market is now focused on the United States Federal Reserve’s potential interest rate decisions for later this year. Recent inflation data from last month showed the Consumer Price Index holding around a stubborn 3.5%, complicating the path to rate cuts. However, the general expectation remains that a policy pivot will occur, which would likely weaken the US dollar and push gold prices higher.
Given this outlook, the current price dip could be a tactical entry point for bullish positions. We see this as a chance to consider buying call options with expirations in the later months of 2026. This strategy allows for capitalizing on the expected upward trend while managing downside risk if prices temporarily fall further.
Written on April 20, 2026 at 8:40 am, by josephine
EUR/USD rebounded from the 1.1730–1.1725 area, a one-week low set in Asia, and has filled much of Monday’s earlier gap. It is trading just above the mid-1.1700s after easing from the 1.1850 area, a two-month peak.
The US Dollar has struggled to extend gains as expectations for a US Federal Reserve rate rise have weakened. Geopolitical risk linked to the US-Iran dispute over the Strait of Hormuz remains a factor that could support the Dollar and limit EUR/USD rises.
Technical Snapshot And Momentum
Technically, the pair is holding above the 23.6% Fibonacci retracement of the rise from the late-March low, but it remains below the 100-hour EMA. Momentum measures show RSI near 43 and MACD slightly below zero, pointing to sideways trade with a mild downside lean.
Support levels include 1.1754 (23.6%), then 1.1695 (38.2%) and 1.1648 (50%) if declines continue. Resistance is near the 100-hour EMA at 1.1770, with a break higher exposing 1.1849.
The report notes the analysis was produced with help from an AI tool.
Looking back at the analysis from mid-2025, we were watching EUR/USD struggle around the 1.1750 level. At the time, the market was pricing out Federal Reserve rate hikes, but geopolitical risks in the Strait of Hormuz kept a floor under the dollar. This created a consolidative environment where the pair was capped by its 100-hour moving average.
How The Backdrop Has Changed
Today, the situation has evolved significantly, with the pair now trading near 1.1280. The interest rate divergence we only speculated about in 2025 became a reality, as the Fed enacted two further quarter-point hikes in late 2025 while the European Central Bank held steady. This is supported by recent data showing US core inflation holding at 2.8% year-over-year, while the latest Eurozone HICP figure has softened to just 2.1%.
For the coming weeks, this divergence suggests strategies that favor a stronger dollar or a range-bound to weaker euro. With implied volatility in EUR/USD options having risen to an 8-month high of 9.2%, buying puts to hedge against a drop below 1.1200 could be a prudent move. Selling out-of-the-money call spreads with a strike above 1.1400 might also be attractive to collect premium, capitalizing on the strong technical resistance now established at that level.
Traders should also be mindful of the upcoming US Non-Farm Payrolls report, which will be critical for the Fed’s future path. The market’s reaction to the 2025 US-Iran standoff taught us how quickly safe-haven flows can dominate fundamentals. Any unexpected escalation in current global trade discussions could cause a similar flight to the dollar, making long-dated protective puts more valuable.
Gold prices in the Philippines fell on Monday, based on FXStreet data. Gold was priced at PHP 9,234.12 per gram, down from PHP 9,314.10 on Friday.
Gold also dropped to PHP 107,704.80 per tola from PHP 108,637.90 on Friday. Other listed prices were PHP 92,341.07 for 10 grams and PHP 287,213.40 per troy ounce.
How FXStreet Calculates Local Gold Prices
FXStreet converts global gold prices into local values using the USD/PHP rate and local unit measures. The figures are updated daily at the time of publication and are for reference, as local rates may vary.
Central banks hold the largest gold reserves and added 1,136 tonnes worth about $70 billion in 2022, according to the World Gold Council. This was the highest annual total since records began.
Gold often moves inversely to the US Dollar and US Treasuries, and it is also commonly inversely linked to risk assets such as shares. Price changes can be driven by geopolitical events, recession fears, interest rates, and shifts in the US Dollar because gold is priced in dollars (XAU/USD).
This slight dip in local gold prices is just noise against the larger global backdrop. We see the main driver for gold as the changing interest rate outlook in the United States. After a prolonged period of consolidation in 2025, markets are now pricing in Federal Reserve rate cuts later this year.
Outlook For Rates And Gold
The expectation of lower interest rates is putting pressure on the US Dollar. The latest data from March 2026 shows US CPI inflation holding at 2.8%, reinforcing the view that the Fed’s next move will be a cut. The CME FedWatch tool currently shows a high probability of the first rate reduction occurring by the third quarter of 2026.
This environment is fundamentally supportive for a non-yielding asset like gold. Adding to this, we saw central banks continue their strong buying trend throughout 2025, with the World Gold Council reporting net purchases of over 950 tonnes. This provides a strong floor for the price and shows continued institutional demand.
Therefore, we should view any short-term weakness as a potential entry point. Derivative traders could consider building long positions through call options dated for the late third quarter. This strategy allows us to position for a rally driven by a potential Fed policy shift while limiting downside risk.
Implied volatility in gold options has remained relatively low in the first few months of 2026, making premiums more attractive than they were during the price surges we saw in 2024. A weaker dollar and falling interest rates create a powerful combination for higher gold prices. We should act on these dips before the market fully prices in the anticipated rate cuts.
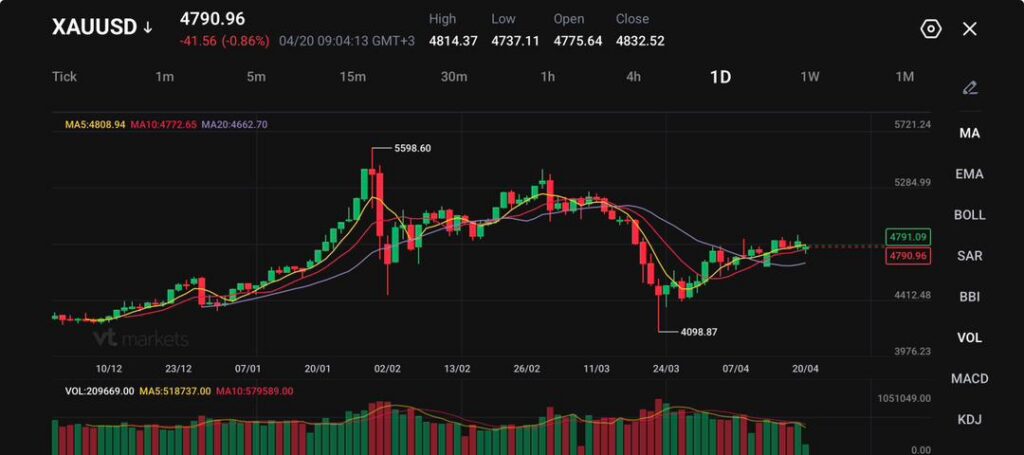
XAUUSD trades at 4,790.96, down 41.56 (-0.86%), after hitting 4,814.37 and dipping to 4,737.11.
Spot gold fell to $4,794.21, while June futures dropped to $4,813.70 as the dollar and Treasury yields moved higher.
The renewed closure of the Strait of Hormuz and the seizure of an Iranian cargo ship pushed oil higher again, reviving inflation fears and weakening demand for non-yielding gold.
Gold prices have declined as the market returns to the macro pattern that defined the initial phases of the US-Iran conflict. Oil prices are on the rise, the dollar is gaining strength, and bond yields are increasing. This combination clearly creates a challenging short-term environment for bullion, even with heightened global tensions. Spot gold now stands at $4,794.21, while June futures have adjusted to $4,813.70.
The current situation presents an opportunity to focus on the inflationary pressures affecting the market rather than solely on the demand for safe-haven assets.
Gold fell after vessels came under fire in the Strait of Hormuz at the weekend, renewing fears of energy-supply disruptions https://t.co/O01gi9XzJb
Traders are closely monitoring the potential impact of a renewed energy crisis, which could lead to higher interest rates lasting longer than anticipated.
This scenario may ultimately challenge gold prices, highlighting the importance of understanding these dynamics in the context of market trends and conflict developments.
Oil and the Dollar Are Doing the Damage
The main pressure point is the return of energy stress. Hormuz has closed again, marine traffic remains constrained, and the market is treating the latest seizure of an Iranian cargo ship as a sign that the ceasefire may fail before it properly stabilises. That has pushed crude higher and brought inflation worries back into the foreground.
Concerns grew that the ceasefire between the United States and Iran might not hold after the U.S. said it had seized an Iranian cargo ship that tried to run its blockade and Iran vowed to retaliate. Follow our live coverage: https://t.co/3Nih73cidn
At the same time, the dollar has firmed as traders moved back toward defensive dollar exposure. A stronger dollar makes bullion more expensive for non-dollar buyers, while higher Treasury yields increase the opportunity cost of holding a non-yielding asset. Gold can handle one of those headwinds for a while. It struggles more when both arrive together.
Inflation Expectations Take Priority
The market is now viewing gold less as a hedge against crises and more as an asset sensitive to interest rates. This shift is significant. Rising energy prices are once again influencing inflation expectations, leading traders to lower their hopes for more lenient monetary policy.
Prices are rising for many Americans, with 65% of consumers saying the increases are outpacing their income, according to a J.D. Power survey of 4,000 U.S. adults conducted in February 2026.
Recent inflation data adds to that pressure, with the annual rate rising from 2.4% in… pic.twitter.com/sKzALWDkZ9
Earlier reports about the conflict had already caused a substantial increase in US inflation and gasoline price expectations, and the recent surge in oil prices now poses a risk of reinforcing that trend.
That leaves gold in an awkward position. It still benefits from long-run inflation hedging demand, but in the short run it loses support when inflation pushes yields and the dollar higher faster than traders add to bullion exposure.
Physical Demand Falls Short
There is also not much help coming from jewellery demand. High prices curbed festival buying in India, while investment demand improved only modestly. That tells you the market is not yet seeing a broad physical bid strong enough to absorb macro pressure.
Silver, platinum, and palladium have also declined, indicating a broader adjustment in precious metals rather than just a gold shift. The market is readjusting across the board due to stronger dollar dynamics and renewed worries that the ceasefire may be collapsing.
XAUUSD Technical Outlook
XAUUSD is trading near 4791, easing slightly as price continues to move sideways following its recovery from the 4098 low. The broader structure shows a stabilisation phase, with gold struggling to build momentum after reclaiming the mid-range. Recent candles reflect indecision, with price repeatedly testing but failing to break cleanly above nearby resistance.
From a technical standpoint, the market is range-bound with a mild bearish tilt in the short term. Price is hovering just below the 5-day (4809) and 10-day (4772) moving averages, which are flattening and beginning to act as dynamic resistance.
The 20-day (4662) remains below as a support base, suggesting the downside is still contained unless that level breaks.
Key levels to watch:
Support: 4770 → 4660 → 4410
Resistance: 4815 → 4900 → 5050
Gold is currently sitting just under the 4815 resistance zone. A move back above this level could shift momentum and open a push toward 4900. However, repeated rejection here keeps the upside capped for now.
On the downside, 4770 is acting as immediate support. A break below this level could lead to a deeper pullback toward 4660, which aligns with the 20-day moving average and a key structural support.
Overall, XAUUSD is consolidating within a tight range, with neither buyers nor sellers in clear control. The next move will likely be driven by a break of 4815 resistance or 4770 support, which should give clearer direction for the short-term trend.
What Traders Should Watch Next
The next move depends on whether the breakdown in the ceasefire becomes more severe and whether oil keeps climbing. If Hormuz stays shut and crude continues rising, the dollar and yields may remain firm enough to keep gold under pressure.
If tensions ease again and energy prices pull back, bullion can stabilise quickly because the broader chart is still not broken.
Why Did Gold Fall Even Though Geopolitical Tensions Rose Again?
Gold fell because the market focused more on the inflation and rate channel than on the safe-haven channel. A stronger dollar, firmer Treasury yields, and higher oil prices made bullion less attractive in the short term, even as US-Iran tensions worsened. Spot gold was recently down 0.7% to $4,794.21, while June futures fell 1.3% to $4,813.70.
Why Does A Stronger Dollar Pressure Gold Prices?
Gold is priced in dollars, so a firmer dollar makes bullion more expensive for buyers using other currencies. That usually weakens demand at the margin and can push prices lower, especially when yields are rising too.
Why Are Higher Oil Prices Hurting Gold Instead Of Helping It?
Higher oil prices are reviving inflation fears and pushing yields higher. Gold can act as an inflation hedge over time, but in the near term it often struggles when inflation drives interest rates and the dollar up faster than investors add to bullion exposure.
What Role Did The Strait Of Hormuz Play In Gold’s Move?
The renewed closure of the Strait of Hormuz pushed oil prices higher and brought the inflation shock back into focus. The market has treated that as a reason to buy dollars and reprice yields, which has weighed on gold.
Why Is Gold Not Acting Like A Classic Safe Haven Right Now?
The market is treating gold more as a rates-sensitive asset than a pure crisis hedge. When war risk lifts oil, and oil lifts inflation expectations, the immediate effect can be higher yields and a stronger dollar, both of which work against bullion.
How Much Has Gold Fallen Since The Conflict Started?
Gold has fallen about 8% since the US and Israel launched strikes on Iran in late February, according to the latest market coverage. That reflects how much higher-for-longer rate fears have outweighed the usual safe-haven bid.
Start trading now – Click here to create your real VT Markets account
Written on April 20, 2026 at 8:17 am, by josephine
GBP/USD reduced part of its earlier decline after opening with a gap down, but it still traded lower near 1.3500 in Asian hours on Monday. The move followed stronger demand for the US Dollar as a safe haven amid renewed US–Iran tensions.
The Guardian reported that Iran’s Foreign Ministry spokesman Esmail Baghaei said the US blockade of Iran’s ports and coastline is an act of aggression that violates the ceasefire. Baghaei wrote on social media that it is “collective punishment” and “a war crime and crimes against humanity”.
Iranian authorities indicated on Friday that the Strait would reopen, then reversed the move on Saturday after US President Donald Trump refused to lift the blockade on Iranian ports. Iran’s military said the US breached the ceasefire by firing on a commercial vessel and said it would retaliate.
Markets also supported the Dollar as traders priced in a Federal Reserve higher-for-longer stance linked to persistent inflation and Middle East tensions. US Retail Sales data due Tuesday is forecast to rise 1.3% month-on-month in March, after 0.6% in February.
Sterling may find support if Strait of Hormuz tensions push oil prices higher and add to inflation concerns. BoE Deputy Governor Sarah Breeden said the conflict has increased the risk of overlapping market stresses and that vulnerabilities seen before past crises remain.
We remember the market volatility in early 2025 when US-Iran tensions flared up over the Strait of Hormuz blockade. The GBP/USD was trading around 1.3500 then, but the persistent strength of the dollar has since pushed the pair lower. With the pair currently hovering near 1.2450, we see similar underlying risks remaining.
The dollar’s safe-haven appeal from last year’s conflict has been reinforced by the Federal Reserve’s ongoing battle with inflation. Our latest data from Q1 2026 shows US inflation remains sticky at 3.5%, keeping the Fed’s “higher-for-longer” stance firmly in place. This makes buying put options on the GBP/USD an attractive hedge against continued dollar dominance.
On the Sterling side, the Bank of England faces a similar challenge to the one it had in 2025. While recent UK inflation has cooled to 3.2%, the threat of rising energy prices means rate hike expectations have not disappeared completely. This suggests traders should monitor short-term interest rate futures to position for any hawkish surprises from the BoE.
The events of 2025 were a stark reminder of how geopolitics can ignite energy markets, a lesson that holds true today. With Brent crude currently trading around $87 a barrel and tensions in the Middle East still elevated, buying call options on oil is a direct strategy to trade this risk. This approach offers protection against sudden price spikes that could stem from any new supply disruptions.
We saw last year how quickly the narrative could shift, causing sharp swings in currency pairs. The current environment of central bank uncertainty suggests implied volatility in GBP/USD options may be undervalued. We believe using option strategies like straddles, which profit from a large price move in either direction, could be a prudent approach in the coming weeks.
Written on April 20, 2026 at 7:35 am, by josephine
Gold prices in the United Arab Emirates fell on Monday, based on FXStreet data. Gold was priced at AED 565.51 per gram, down from AED 570.31 on Friday.
Gold dropped to AED 6,595.88 per tola from AED 6,652.04 on Friday. Other listed prices were AED 5,655.11 for 10 grams and AED 17,588.24 per troy ounce.
FXStreet calculates UAE gold prices by converting international prices using the USD/AED rate and local units. Prices are updated daily using market rates at the time of publication, and are provided for reference as local rates may vary.
Central banks are the largest holders of gold and may buy it to diversify reserves. According to the World Gold Council, central banks added 1,136 tonnes of gold worth about $70 billion in 2022, the highest annual total on record.
Gold often moves inversely to the US Dollar and US Treasuries, and can also move opposite to risk assets such as equities. Price drivers include geopolitics, recession concerns, interest rates, and US Dollar strength, since gold is priced in dollars.
We are seeing a minor dip in gold prices, which can be viewed as a temporary pullback rather than a change in the underlying trend. This small decrease comes after a significant rally we experienced over the past year. Derivative traders should see this not as weakness, but as a potential opportunity to assess new positions.
The fundamental picture for gold remains strong due to the shifting stance on interest rates. After the aggressive rate hikes we saw through 2025, major central banks are now signaling a move towards easing monetary policy. As a non-yielding asset, gold becomes more attractive when interest rates fall, a dynamic we anticipate will play out in the coming months.
Central bank buying continues to provide a solid floor for prices, a trend that has accelerated since the record purchases of 2022. Recent data confirms that central banks, particularly in emerging markets, were still massive net buyers in early 2026, absorbing over 800 tonnes in the last twelve months. This consistent demand limits downside risk and suggests institutional players are still bullish.
Geopolitical instability is also providing support, with renewed trade tensions adding to global uncertainty. This environment tends to weigh on the US Dollar, which has an inverse relationship with the price of gold. A weaker dollar makes gold cheaper for foreign buyers, which can further boost demand for the precious metal.
Given this backdrop, the recent price dip looks like a favorable entry point for bullish strategies. We believe traders should consider buying call options or establishing bull call spreads to capitalize on expected upside movement over the next few weeks. This approach allows for participation in a potential rally while managing risk in what remains a volatile market.
Written on April 20, 2026 at 7:31 am, by josephine
USD/JPY traded higher near 159.00 in early European trading on Monday. The Japanese Yen weakened as renewed US-Iran tensions and reports of the Strait of Hormuz being closed supported the US Dollar.
US President Donald Trump said on Sunday that US Marines took custody of a vessel that tried to pass an American blockade on Iranian ports, according to the Guardian. Iran’s Foreign Ministry spokesman Esmail Baghaei said the US blockade of Iran’s ports and coastline is an act of aggression that violates the ceasefire.
The ongoing dispute added support for the US Dollar in the near term. This kept USD/JPY in positive territory around 159.00.
Bank of Japan Governor Kazuo Ueda on Friday avoided pointing to an April rate rise, citing uncertainty from a “negative supply shock” linked to the war. Markets widely expect the Bank of Japan to keep rates unchanged until at least June 2026.
Japan’s officials also raised their monitoring of the exchange rate. Finance Minister Satsuki Katayama said Japan is watching markets with a “high sense of urgency” and may act against speculative moves.
Looking back at the situation in 2025, we can see the market was tense with USD/JPY pushing 159.00. The combination of US-Iran conflict and a hesitant Bank of Japan created a powerful upward force on the dollar. This was the environment where fears of currency intervention were at their peak.
Shortly after those warnings in 2025, Japanese authorities did step into the market when the pair briefly touched 160.20, an action that sent the pair tumbling five big figures in a single session. That intervention, costing a reported ¥9 trillion, set a new precedent for volatility and showed that verbal warnings would be backed by decisive action. We now see that event as the peak of the divergence trade, as underlying fundamentals have since started to shift.
Today, the geopolitical risk from Iran has subsided, but the focus has pivoted entirely to monetary policy. Japan’s latest core CPI reading came in at a stubborn 2.8%, well above the BoJ’s target, increasing pressure for the central bank to finally act. With the pair having crept back up to 156.50, the market is now pricing in a near-certain rate hike at the June 2026 meeting.
For derivative traders, this changes the game from anticipating sudden intervention to positioning for a planned policy shift. While buying out-of-the-money puts on USD/JPY was a good hedge against intervention in 2025, the strategy now should focus on the BoJ’s June meeting. We believe traders should look at buying options straddles or strangles expiring in late June to capture the significant volatility expected around that central bank decision.
Written on April 20, 2026 at 7:04 am, by josephine