EUR/USD edged lower to near 1.1750 in early Asian trading on Wednesday. The Euro weakened against the US Dollar amid the US-Iran conflict and uncertainty over a possible Strait of Hormuz blockade.
US President Donald Trump said late Tuesday that he would extend a ceasefire with Iran indefinitely. The ceasefire had been due to expire the next day, while plans for fresh negotiations between the two countries collapsed.
An aide to Iran’s top negotiator said the move was a “ploy to buy time”. Iran’s military warned of a powerful attack on predetermined targets, citing repeated threats by Trump.
Ongoing uncertainty around US-Iran talks may support demand for the US Dollar as a safe-haven currency. This could keep pressure on EUR/USD in the near term.
Markets are watching preliminary HCOB Purchasing Managers’ Index (PMI) readings from the Eurozone and Germany, due on Thursday. US S&P Global PMI data for April is also scheduled for release on Thursday.
Looking back at this time in 2025, we saw the EUR/USD pair under pressure near 1.1750 due to geopolitical tensions in the Middle East. That event served as a reminder of the US dollar’s status as a primary safe-haven asset during global uncertainty. The market’s focus at that point was on short-term risk, which temporarily overshadowed economic data.
The landscape has changed significantly over the past year. Those specific geopolitical risks have faded, and the market’s attention has pivoted to the starkly different economic paths of the US and the Eurozone. For instance, the US economy posted a resilient 2.1% annualized growth in the first quarter of 2026, while the Eurozone’s economy expanded by a mere 0.5% in the same period.
This economic divergence is now heavily influencing central bank policy and interest rate expectations. The US Federal Reserve is signaling it will hold rates higher for longer to combat persistent services inflation, especially after the latest jobs report showed a robust 260,000 positions added last month. In contrast, weaker inflation figures in the Eurozone have the European Central Bank openly discussing potential rate cuts before the end of the summer.
Given the current EUR/USD spot price around 1.0720, we should consider buying put options expiring in the next two to three months. This strategy allows us to profit from a continued decline in the pair, driven by the widening interest rate differential between the US and Europe. The next major technical support level we are watching is near 1.0600.
Furthermore, implied volatility in the currency markets is much lower now than during the geopolitical flare-up in 2025. The Cboe EuroCurrency Volatility Index (EVZ) is currently hovering near 5.8, a significant drop from the levels above 9 we saw during last year’s tensions. This low-volatility environment makes strategies like selling out-of-the-money call spreads on the EUR/USD attractive for earning premium while maintaining a bearish outlook.
We must remain vigilant for upcoming data releases that could alter this view. The next US Core PCE inflation report will be critical, as a higher-than-expected number would reinforce the Fed’s hawkish stance and likely accelerate the Euro’s decline. Conversely, any sudden signs of weakness in the US labor market could provide temporary relief for the shared currency.
Written on April 22, 2026 at 5:33 am, by josephine
Japan’s adjusted merchandise trade balance was ¥90.7bn in March. This was an improvement from ¥-374.2bn in the previous period.
The balance moved from a deficit to a surplus. This indicates imports and exports shifted in March compared with the prior period.
We are seeing a major reversal in Japan’s trade balance, shifting from a large deficit of ¥374.2 billion to a ¥90.7 billion surplus for March. This is a powerful, unexpected signal that points to a stronger Japanese Yen. Derivative traders should prepare for significant upward pressure on the currency in the coming weeks.
Given this data, we would consider positioning for a lower USD/JPY exchange rate. Purchasing put options on USD/JPY offers a clear way to capitalize on a potential decline. For those with a more neutral-to-bearish outlook, selling out-of-the-money call options could be an effective strategy to collect premium while betting that the pair’s upside is now limited.
This trade surplus is supported by recent industry data showing Japanese auto exports rose 6.5% year-over-year, reflecting resilient global demand. At the same time, the cost of imports has been tempered by energy prices, with benchmark crude oil futures holding steady below $85 a barrel, a contrast to the price spikes we saw in early 2025. This combination of strong exports and manageable import costs provides a solid foundation for the yen.
Looking back, we can recall the market volatility in 2025 when even minor hints of policy normalization from the Bank of Japan triggered sharp yen rallies. This strong economic data could force the central bank’s hand, bringing forward expectations of a policy shift away from its ultra-loose stance. Such a move would act as a strong catalyst for further yen appreciation, a risk that option pricing may not yet fully reflect.
For equity derivatives, the outlook for the Nikkei 225 is now more complex. A strengthening yen directly pressures the earnings of Japan’s large export-oriented corporations, which could create headwinds for the index. We might consider using options to hedge long equity positions or initiate strategies like a long put spread on Nikkei 225 futures to protect against a potential downturn driven by currency strength.
Written on April 22, 2026 at 5:29 am, by josephine
Japan’s year-on-year imports rose by 10.9% in March. The increase was above the expected 7.1%.
This compares the value of goods brought into Japan with the same month a year earlier. The March outcome was 3.8 percentage points higher than the forecast.
This significant jump in imports, well above what was anticipated, suggests Japan’s domestic economy might have more strength than we previously priced in. We should consider that this could be driven by either robust consumer and business demand or, more likely, the rising cost of goods due to the yen’s prolonged weakness. This unexpected figure introduces uncertainty, which typically leads to higher market volatility.
For currency traders, this data complicates the outlook for the yen. While a strong economy would normally support the currency, the yen’s value has remained stubbornly low, with USD/JPY hovering above 158 for most of the past year in 2025. This import data could be seen as evidence that the weak yen is now fueling significant imported inflation, putting pressure on the Bank of Japan to act more decisively.
The Bank of Japan has been extremely cautious, having only raised rates once since ending its negative interest rate policy back in 2024. With core inflation figures recently ticking up to 2.4%, this import surprise will increase speculation that another rate hike may come before the third quarter. We should watch for shifts in options pricing that reflect a higher probability of the BoJ tightening policy sooner than guided.
This creates a mixed signal for equity derivatives focused on the Nikkei 225. On one hand, strong domestic demand is a positive for corporate earnings and could support stock prices. On the other hand, the prospect of a more aggressive central bank tightening policy to combat inflation could put a ceiling on any rally. Therefore, we should prepare for a period of range-bound trading or increased choppiness in index futures.
Written on April 22, 2026 at 5:04 am, by josephine
Japan’s exports rose 11.7% year on year in March. This was above the forecast of 11%.
The result indicates export growth was 0.7 percentage points higher than expected. The figures compare the same month in the prior year.
The stronger-than-expected March export growth of 11.7% points to continued strength in the Japanese economy. This positive signal may lead to an appreciation of the Japanese Yen against other major currencies. We should consider positions that benefit from a stronger Yen, such as buying JPY call options or selling USD/JPY futures.
This export data is a significant tailwind for Japanese corporate earnings, especially for large manufacturers that dominate the Nikkei 225 index. With the Nikkei already having climbed over 7% year-to-date to break the 42,000 level, this news could fuel further upward momentum. We see this as an opportunity to purchase Nikkei 225 call options expiring in the next quarter.
However, this robust economic activity puts pressure on the Bank of Japan to consider tightening its monetary policy, especially with core inflation holding at 2.1%. Any hawkish commentary from the BoJ could spark significant volatility in the currency markets. Therefore, buying straddles on the USD/JPY pair could be a prudent strategy to profit from a large price move in either direction.
We must remember this export performance is directly linked to the Yen’s significant weakness throughout 2025, when it frequently traded above 155 to the dollar. That depreciation provided a powerful boost to the value of overseas sales when converted back into yen. A reversal of that currency trend is now the primary risk to this entire trade.
Written on April 22, 2026 at 4:59 am, by josephine
USD/JPY rose 0.37% on Tuesday to about 159.40, after reaching 159.65 in the US session. It has traded in a range of roughly 158.55 to 159.65 over recent sessions.
President Trump extended a deadline for direct talks with Iran after Tehran did not attend new discussions. This reduced near-term worry about disruption in the Strait of Hormuz, while risk assets firmed and the US Dollar Index slipped.
US March Retail Sales rose 1.7% month-on-month versus a 1.4% forecast. Fed Chair-designate Kevin Warsh gave hawkish testimony to Congress.
Japan’s adjusted March trade figures are due late Tuesday. National CPI is due Thursday, with consensus at 1.8% year-on-year for the ex-fresh food measure versus 1.6% previously.
On the 15-minute chart, USD/JPY traded at 159.41, above the day’s open at 158.88. Stochastic RSI was near 36, with support around 159.41 and then 158.88.
On the daily chart, USD/JPY traded at 159.41, above the 50-day EMA at 158.20 and the 200-day EMA at 154.64. Stochastic RSI was near 27, with support near 159.40, then 158.20 and 154.64.
Looking back to April 2025, we saw USD/JPY consolidating below the 160 level as the market reacted to easing tensions with Iran and strong US data. Today, the situation has evolved significantly, with the pair having tested levels near 170 earlier this month, making direct intervention from Japanese authorities the primary market focus. The core drivers have shifted from broad risk sentiment to a direct standoff between currency speculators and the Ministry of Finance.
While the specific geopolitical concerns of 2025 have faded, the Yen has failed to benefit from its traditional safe-haven status amid other global uncertainties. The currency’s weakness is now overwhelmingly driven by the interest rate differential between Japan and the United States. This gap remains substantial, with the carry trade continuing to pressure the Yen despite the Bank of Japan’s historic policy shift.
The Bank of Japan did exit its negative interest rate policy earlier this year, a major move we were anticipating back in 2025, but it has not been enough to reverse the trend. With the US Federal Reserve holding rates firm and the 10-year US Treasury yield sitting near 4.5%, the roughly 3.6 percentage point gap over Japanese government bonds makes selling the Yen attractive. This fundamental picture suggests that any dips in USD/JPY will likely be seen as buying opportunities by many market participants.
Japan’s recent national CPI data, which came in at 2.5%, remains above the BoJ’s target but hasn’t signaled the kind of aggressive inflation that would force rapid rate hikes. This leaves currency intervention as the main tool for authorities to combat Yen weakness, creating significant event risk. We believe Japanese officials are highly likely to act should the pair make another concerted push toward the 170.00 level.
Given the high risk of a sudden, sharp reversal caused by intervention, holding long spot positions is dangerous. For derivative traders, buying downside protection through JPY call options (USD/JPY puts) is a prudent strategy to hedge against or speculate on a sharp drop. Although implied volatility has increased, making options more expensive, they provide a defined-risk method to position for a government-induced correction in the coming weeks.
Written on April 22, 2026 at 4:35 am, by josephine
USD/TWD has been edging lower in recent sessions. This move has coincided with strong Taiwan equities, foreign inflows, and firm technology exports.
The Taiwan Dollar (TWD) has been moving more in line with the technology cycle again. TWD has also been supported by portfolio inflows and external trade fundamentals.
On the daily chart, bearish momentum remains in place. The Relative Strength Index (RSI) is near oversold levels.
Price action shows a falling wedge pattern, which is often linked to a bullish reversal. Support is seen around 31.40–31.50, where a bounce could occur.
The USD/TWD pair is grinding towards a critical support level between 31.40 and 31.50. This downward pressure is fueled by a strong Taiwanese technology cycle and significant foreign money flowing into local stocks. Fundamentally, the Taiwan Dollar appears well-supported by these factors.
We’ve seen data confirming this strength, as Taiwan’s exports for March 2026 surged 12% year-over-year on the back of incredible demand for AI-related semiconductors. Foreign investors also added a net $5.2 billion to Taiwanese equities in the first quarter of 2026, the highest level for that period in three years. This shows the fundamental story is currently very strong.
However, the chart is telling us to be cautious as the downward move may be exhausted. A falling wedge pattern is forming, which often signals a bullish reversal for the US dollar. The Relative Strength Index is also nearing oversold levels, suggesting the selling pressure could soon ease.
Given this conflict between strong fundamentals and stretched technicals, buying short-dated USD/TWD call options is a prudent strategy. This allows for participation in a potential rebound from the 31.40 support level. The risk is limited to the premium paid for the options, protecting from a continued slide if fundamentals win out.
For traders who believe the tech story will overwhelm the chart patterns, put options can be used to position for a break below the 31.40 support. This provides a leveraged bet on the trend continuing. A straddle, buying both a call and a put, could also be used to trade the potential for a sharp move in either direction.
We remember a similar situation back in late 2024, when strong fundamentals clashed with technical indicators suggesting a bounce. The pair traded sideways for weeks before robust export numbers eventually confirmed the trend and pushed the USD/TWD lower. This past price action suggests the fundamental story may ultimately prevail, but not without a potential period of consolidation first.
Written on April 22, 2026 at 4:30 am, by josephine
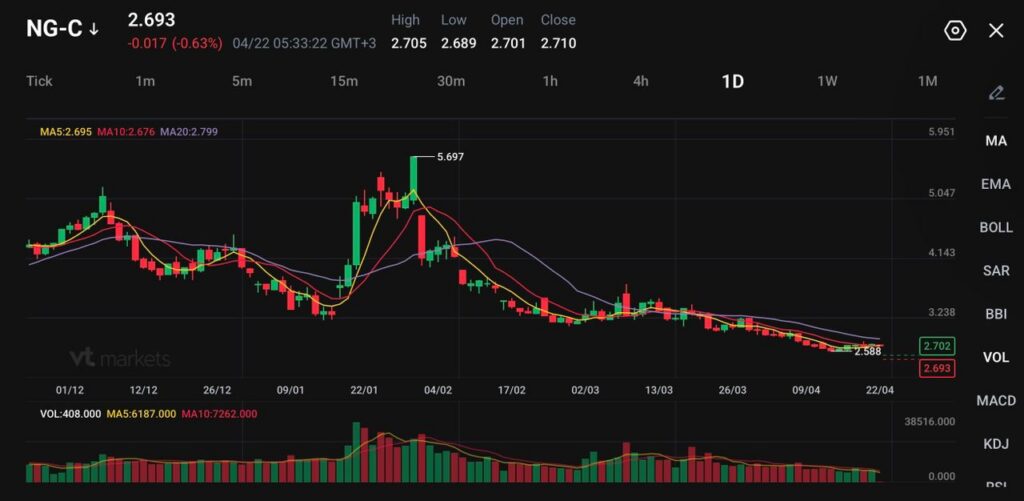
NG-C trades at 2.693, down 0.017 (-0.63%), after a high of 2.705 and a low of 2.689.
US working gas in storage stood at 1,970 Bcf for the week ending April 10, which was 108 Bcf above the five-year average of 1,862 Bcf.
LNG feedgas flows have stayed strong at around 18.9 bcfd in April, but mild weather and elevated inventories are still capping the upside.
US natural gas remains under pressure because the domestic supply-demand balance still looks soft. Futures are hovering near $2.69 to $2.70 per MMBtu, close to the lowest levels since late 2024, even after a recent five-session bounce.
The market has tried to build support from lower production and strong LNG flows, but those positives have not been strong enough to override the larger storage and weather story.
Eni and Repsol plan to start exporting natural gas from Venezuela by the end of 2031 after reaching a deal with Caracas to revive a long-stalled effort to expand production from a massive offshore field. https://t.co/Nk7qiegtti
That is the key point. Natural gas is not lacking bullish inputs altogether. It is just facing a much heavier bearish weight from mild spring conditions and comfortable inventories.
Output Cuts Fall Short
Production has eased meaningfully in recent weeks. Average output fell by about 3.9 bcfd over the past 15 days to roughly 108.2 to 108.3 bcfd, which marked an 10- to 11-week low depending on the series used. That decline has been one of the main reasons prices stopped falling in a straight line.
Several liquefied natural gas tankers reversed course en route to the Strait of Hormuz after Iran warned ship captains that the vital channel is once again closed to maritime traffic. https://t.co/wHDxdRzPMa
In a tighter market, a drop of that size would likely have triggered a stronger rally. This time, it has only slowed the decline because inventories remain comfortable and weather has not generated the kind of heating or cooling demand that would really tighten balances.
A cautious near-term view still says production weakness can stabilise prices, but it may not be enough to drive a durable breakout unless demand improves as well.
LNG Strength Meets Capacity Constraints
LNG feedgas demand has also remained supportive. Flows to the major US export plants have climbed to around 18.9 bcfd in April, up from about 18.6 bcfd in March and close to record territory. US LNG exports hit an all-time high in March as plants ran above nameplate capacity and new units came online.
That matters because LNG has been one of the few consistent sources of demand growth in the US gas market. The problem is that the market already knows this. When export terminals are already running hard, the upside from “strong LNG” diminishes unless there is additional capacity or domestic supply falls further.
That is why gas can still feel heavy even with near-record feedgas flows. The bullish export story is real, but it is not new enough to overwhelm loose domestic fundamentals.
Storage Is Still The Bigger Story
Storage remains the cleanest reason the market cannot sustain much upside. The latest EIA data showed inventories at 1,970 Bcf, which is 126 Bcf higher than last year and 108 Bcf above the five-year average. That leaves stocks roughly 6% above the five-year norm, and other market summaries have described the overhang as around 7% depending on the cut-off week used.
That is a comfortable starting point for the injection season. When storage enters spring above average and the weather stays mild, traders do not need to price scarcity. They price how quickly the system can keep refilling.
This is what keeps every rally attempt contained. Strong LNG flows and lower output help, but ample stocks make it hard for the market to panic higher.
Weather Turns Against Bulls
Forecasts have also moved in an unhelpful direction for price. The market had earlier found some support from cooler expectations, but the latest outlook points to warmer conditions across parts of the Midwest and near-normal temperatures through early May. That reduces heating demand and limits the power-sector burn needed to tighten balances meaningfully.
Arsenal, a closely held natural gas explorer in the Marcellus Basin, is exploring options including a potential sale that could fetch close to $1.5 billion, according to sources https://t.co/HYCMixfzT8
At this time of year, weather does not need to be extremely warm to weigh on gas. It only needs to stay mild enough to prevent either strong late-season heating demand or early cooling demand from appearing.
That keeps the market stuck in the soft middle of the seasonal window.
Natural gas (NG-C) is trading near 2.69, hovering just above recent lows as the market continues to drift lower following the sharp rejection from the 5.69 peak earlier in the year. Price action has flattened in recent sessions, but the broader structure still reflects a persistent downtrend with weak recovery attempts.
From a technical standpoint, the bias remains bearish but stabilising in the very short term. Price is trading below the 20-day moving average (2.80), which continues to slope downward and caps upside attempts. The 5-day (2.69) and 10-day (2.67) are clustered tightly around current levels, indicating a lack of strong momentum and a market that is trying to base after an extended decline.
Key levels to watch:
Support: 2.58 → 2.50 → 2.30
Resistance: 2.70 → 2.80 → 3.00
The market is currently consolidating just above the 2.58 support zone, where selling pressure has begun to slow. A break below this level would reinforce the broader downtrend and could expose 2.50 next.
On the upside, 2.70 acts as immediate resistance. A move above this level could trigger a short-term rebound toward 2.80, but any recovery is likely to face selling pressure unless price can reclaim and hold above the 3.00 handle.
Overall, natural gas remains under pressure with signs of exhaustion rather than reversal. The near-term focus is on whether price can hold above 2.58 to form a base, or if continued weakness drives another leg lower.
What Traders Should Watch Next
The next move depends on whether lower production keeps deepening and whether the weather turns hot enough to increase power demand. The weekly storage figures will remain the most important check on whether the market is truly tightening or just pausing before another soft spell.
If inventories keep building above normal and temperatures stay mild, natural gas may stay pinned near the current lows. If output slips further and weather turns more supportive, the market can try to build above $2.80 again.
Learn more about trading Energies on VT Markets here.
Trader Questions
Why Is US Natural Gas Still Trading Near $2.70?
Natural gas remains under pressure because mild spring weather and comfortable storage levels are outweighing the support from lower production and strong LNG exports. Prices recently traded around $2.66 to $2.69 per MMBtu, keeping the market close to its recent lows.
Why Didn’t Lower Gas Production Trigger A Bigger Rally?
Output has fallen to roughly 108.2 bcfd, which is supportive, but inventories are still high enough to absorb that supply drop for now. When storage starts the injection season above normal, production weakness alone often is not enough to drive a sustained breakout.
How Strong Are LNG Exports Right Now?
Feedgas flows to the major US LNG export plants have been running around 18.9 bcfd in April, near record territory and above March’s 18.6 bcfd pace. That is helping demand, but the market has already been pricing strong LNG flows for some time.
Why Aren’t Strong LNG Flows Enough To Lift Prices More?
Because the domestic market still looks loose. Export demand is strong, but inventories remain above average and weather has not been cold or hot enough to tighten balances meaningfully. That leaves the LNG story supportive, but not dominant.
How High Are Storage Levels Right Now?
Working gas in storage stood at 1,970 Bcf for the week ending April 10, which was 126 Bcf above the same time last year and 108 Bcf above the five-year average of 1,862 Bcf.
Start trading now – Click here to create your real VT Markets account
Written on April 22, 2026 at 4:17 am, by josephine
NZD/USD eased in the US session, moving back towards 0.5880 as the US Dollar weakened despite ongoing geopolitical risks. The Dollar had earlier been supported by safe-haven demand linked to tensions around the Strait of Hormuz, but later lost traction as US yields fell and sentiment improved.
Market focus also turned to US monetary policy after President Donald Trump repeated his preference for lower interest rates. He said he would be “disappointed” if Kevin Warsh did not cut rates “right away” if confirmed as the next Federal Reserve Chair.
Warsh said most presidents tend to prefer lower rates and stated that Federal Reserve independence rests with the institution. He said tariff-related inflation risks have eased somewhat, and argued that a smaller balance sheet could support lower rates, improved inflation, and stronger economic growth.
He also criticised forward guidance and called for changes to policy tools, communication methods, and the inflation framework. He added that current data used to assess inflation is “quite imperfect”.
On the four-hour chart, NZD/USD trades at 0.5888, below the 20-period SMA at 0.5891 and above the 100-period SMA at 0.5813, with RSI near 50. Resistance levels are 0.5891, 0.5904, 0.5907, and 0.5965, while support sits at 0.5887, 0.5874, and 0.5813.
We remember looking back to 2025 when there was significant political pressure on the Federal Reserve to cut interest rates. At that time, NZD/USD was struggling below 0.5900, caught between geopolitical risk and a US dollar that was beginning to soften. This period of uncertainty set the stage for the policy divergence we are now seeing.
Those discussions from last year about changing the Fed’s communication style have since become reality under the new leadership. With less forward guidance, Fed meeting outcomes are now more uncertain, causing spikes in short-term volatility around announcement dates. This has fundamentally changed how we must hedge and position for event risk.
As of today, April 22, 2026, the NZD/USD is trading near 0.6150, reflecting the rate cuts the Fed delivered through late 2025 and early 2026. However, with the most recent US CPI data showing inflation stubbornly holding at 3.1%, the market is now pricing in a pause from the Fed. This puts a temporary floor under the US dollar.
Given this dynamic, we see value in selling options to collect premium, as the pair may enter a period of consolidation. The one-month implied volatility for NZD/USD options is currently at 9.8%, which is a reasonable level to be selling. A short strangle, with strikes at 0.6000 and 0.6300, appears attractive for the coming weeks.
This strategy benefits from time decay and the view that the pair will trade within this range as the market awaits fresh inflation data. The main risk to this position would be an unexpectedly weak US jobs report or a surprisingly hawkish statement from the Reserve Bank of New Zealand. The support level we watched back in 2025 near 0.5900 now seems a distant memory but serves as a reminder of how quickly sentiment can shift.
Written on April 22, 2026 at 4:04 am, by josephine
AUD/USD fell more than 0.30% in North American trading, last at 0.7153 after a daily high of 0.7185. Risk-off conditions supported the US Dollar after Iran did not attend talks in Pakistan.
Pakistan’s efforts to bring Iran to talks did not succeed, while the US extended a ceasefire while awaiting an Iranian proposal. The US also said the blockade in the Strait of Hormuz would remain.
Iranian state TV reported that Iran does not recognise the ceasefire and may not follow it. The report said Iran would act in line with national interests.
US Retail Sales rose 1.7% month-on-month in March, up from 0.7%, while annual growth stayed at 4%. The ADP Employment Change four-week average increased to 54.8K from 39K.
In Australia, the calendar was sparse, while the RBA said it is focused on avoiding a rise in medium-term inflation expectations. Markets priced 77% odds of a rate rise on 4 May and another increase on 28 September.
Technically, the pair stalled near 0.7180 and moved towards 0.7150, with RSI turning lower. Support is at 0.7129, then 0.7100 and the 50-day SMA at 0.7046; resistance is 0.7187 and 0.7221.
We are seeing a familiar pattern of risk aversion that mirrors the tensions from the Trump administration era. Renewed friction in the Middle East is once again boosting the US Dollar’s safe-haven appeal. This is creating headwinds for risk-sensitive currencies like the Australian Dollar.
This time, the US Dollar’s strength isn’t just about geopolitics; it’s backed by solid economic performance. Recent data showed US Core CPI remains stubbornly above the Fed’s target at 3.8%, and the labor market added a robust 303,000 jobs last month, keeping pressure on the Federal Reserve to delay any rate cuts. This fundamental strength in the US economy puts a ceiling on any potential AUD/USD rally.
Meanwhile, the Reserve Bank of Australia is in a difficult position, much like it was in the past. While the RBA remains hawkish to combat domestic inflation, which is currently running at a 3.6% annual pace, its efforts are being overshadowed by the global flight to safety. This dynamic suggests that even positive Australian news might not be enough to push the Aussie significantly higher against the greenback.
For derivative traders, this environment of conflicting central bank policies and geopolitical risk points toward rising volatility. We should consider buying straddles or strangles on the AUD/USD, which would profit from a large price swing in either direction without needing to predict the specific outcome. The pair is currently trading near 0.6550, a far cry from the 0.7150 levels seen during that previous standoff, indicating the market is already positioned more cautiously.
Those with a bearish view on the Aussie should look at buying put options or establishing bear put spreads to define risk. If the AUD/USD breaks below the key support level of 0.6500, it could trigger a rapid decline toward last year’s lows. Looking back, we saw how a breach of the 0.7100 level in that past scenario opened the door for a sharp move lower, a history that could repeat itself.
Given the uncertainty, using derivatives for hedging is a prudent strategy for anyone with exposure to the Australian Dollar. Businesses expecting payments in AUD could purchase forward contracts or AUD puts to lock in a floor for their exchange rate. This protects against the downside risk presented by a strong US Dollar and souring market sentiment.
Written on April 22, 2026 at 4:00 am, by josephine
Japan’s April Financial System Report says the banking system is broadly stable. It says lending is working smoothly as loan demand rises and banks keep lending actively, with no major imbalances seen.
The report says banks have enough capital and stable funding to cope with severe stress. These scenarios include conditions like the global financial crisis and a combined shock from geopolitical risk, higher oil prices, weaker AI-related expectations and rising interest rates.
It says risks still need close monitoring. It points to geopolitical developments in the Middle East, policy changes across jurisdictions and weaknesses in the non-bank financial sector.
Over time, the report says structural factors could weigh on profitability. It links this to falling loan demand tied to population trends, which could lead to less lending activity or higher risk-taking.
Japan has announced the largest reform of its defence export rules in decades. The changes remove most limits on overseas arms sales and allow exports such as warships, missiles and other weapons, shifting from its postwar policy.
Japan will keep strict screening and bans on sales to countries involved in conflict, with possible national security exceptions. The government plans to raise defence spending beyond 2% of GDP.
The recent report on Japan’s financial stability gives us confidence that the system can handle significant stress. For traders, this reduces the “tail risk” associated with Japanese bank stocks, suggesting that options premiums on financials may not see dramatic spikes from domestic fears. We can therefore consider strategies that benefit from lower-than-expected volatility in the banking sector.
Looking back, we saw the Bank of Japan begin its policy normalization in 2024, and this stability report gives them a stronger foundation to continue. This underlying strength in the financial system supports a stable or even stronger yen, especially if the US Federal Reserve signals rate cuts later this year. This makes call options on the yen, or put options on the USD/JPY currency pair, an increasingly interesting hedge.
The major shift is in defense, where relaxed export rules and higher spending create a clear growth story. Based on the government’s commitment to push spending past 2% of GDP, a goal that started taking shape back in 2025, specific companies are set to benefit. We should look at long-dated call options on key defense players like Mitsubishi Heavy Industries and Kawasaki Heavy Industries to capitalize on this multi-year trend.
This presents a paired strategy of buying volatility in the defense sector while potentially selling it in the financial sector. The government’s defense spending, which exceeded ¥7.9 trillion last year, acts as a direct stimulus for specific industrial stocks. Meanwhile, the stable banking report acts as a calming influence on the broader market, as measured by the Nikkei 225 Volatility Index, which has remained below the 20-point mark for most of this quarter.
While the system is stable, we must still watch for external shocks like rising oil prices, which could impact Japan’s economy. A prudent approach would be to use a portion of the potential gains from defense-related trades to buy cheap, out-of-the-money put options on the broader Nikkei 225 index. This provides a cost-effective hedge against the very geopolitical risks that are fueling the defense sector’s expansion.
Written on April 22, 2026 at 3:30 am, by josephine