Market Focus
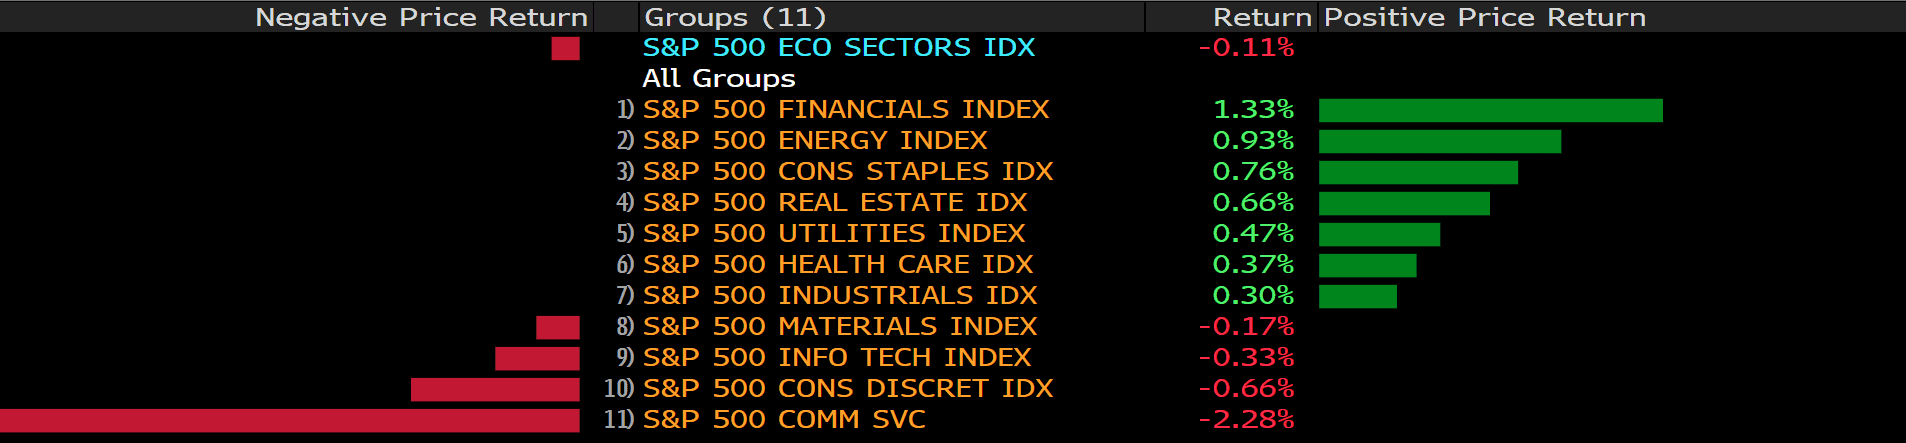
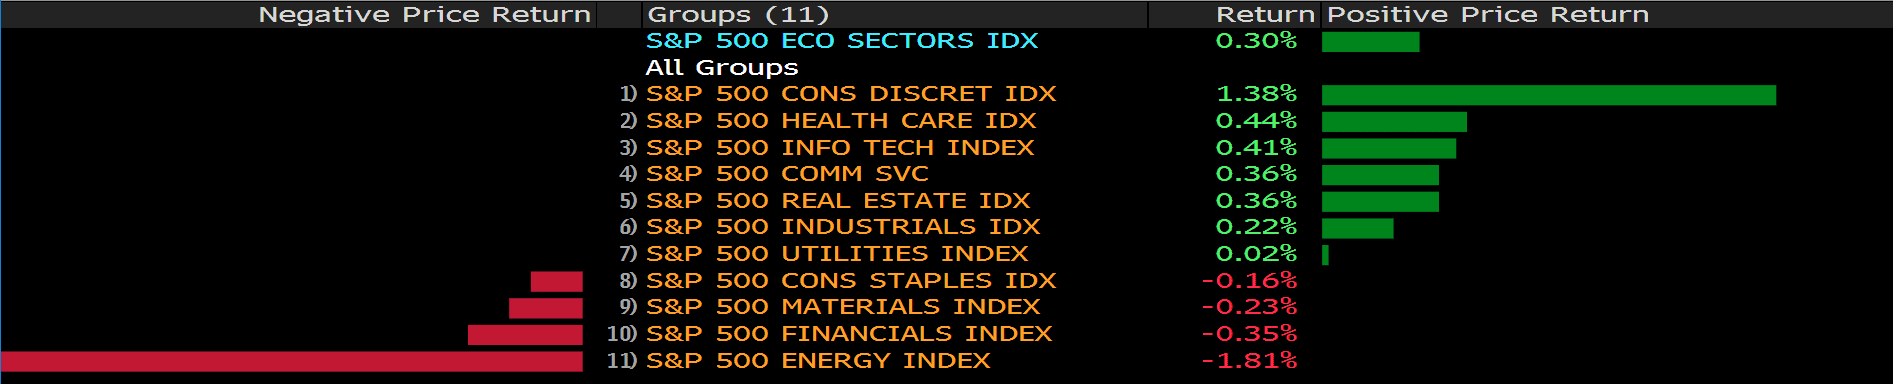
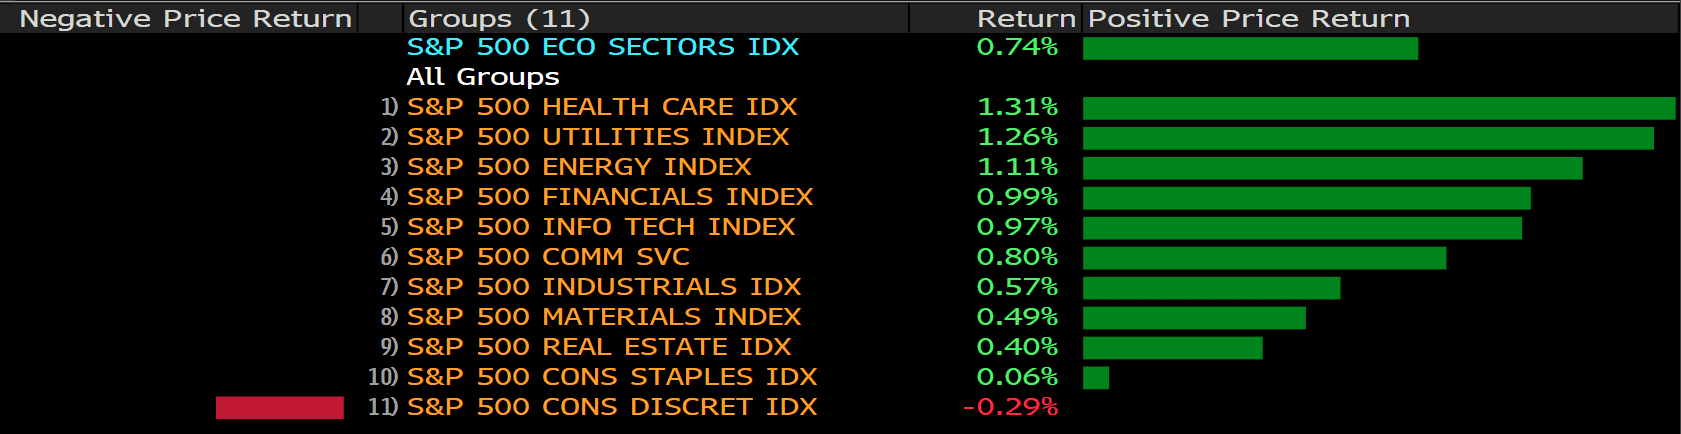
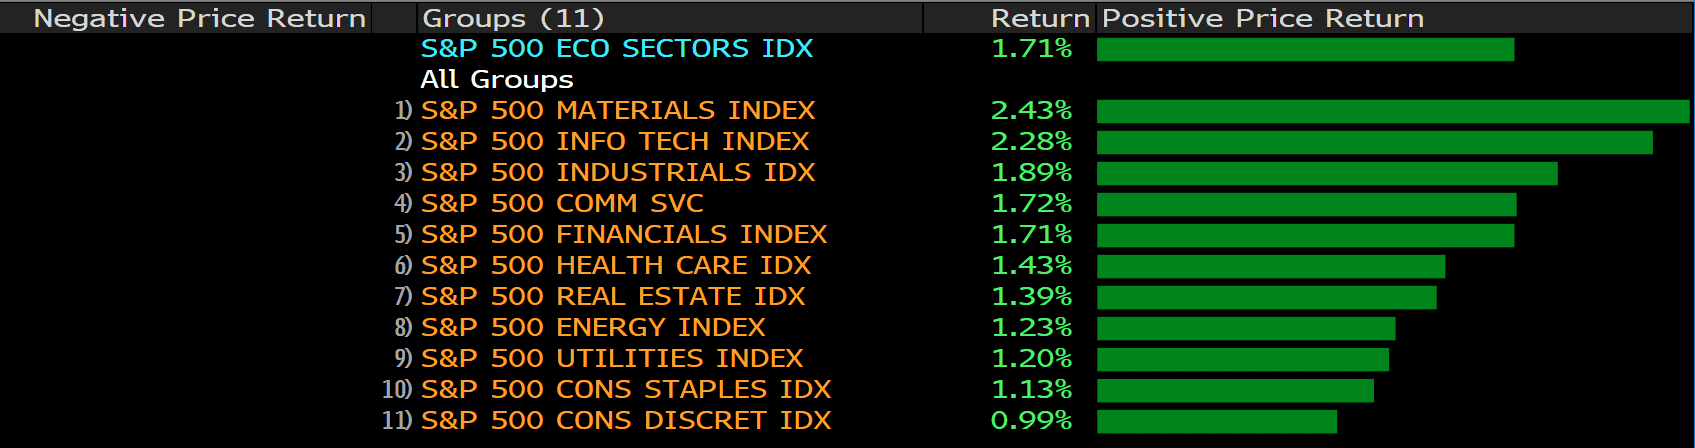
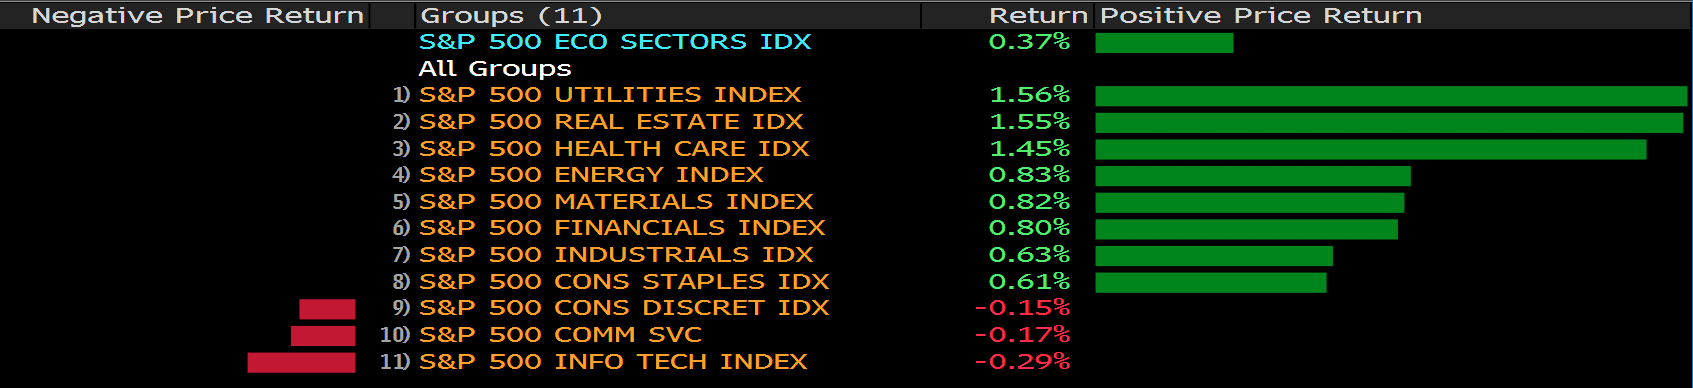
US markets were mixed on Wednesday with the major indices hovering slightly below all time highs. The Dow Jones jumped 0.4% to a new high whilst the S&P 500 rose for 6th straight- day as a parade of strong earnings results boosted the equities; the Nasdaq dropped 0.05%. Recent rallies of US markets have essentially shown that the markets are in the process of climbing a wall of worries over the last two months, including fears over the pandemic resurgence, Chinese property crisis, and the Federal Reserve’s hawkish tone.
After the first Bitcoin ETF debuted in New York on Tuesday, Bitcoin investors cheered and push Bitcoin price to notch a fresh all- time high on Wednesday. Bitcoin climbed 3.9% to $66,398 while Ethereum also rallied 7.4% to $4,000 level.
China’s Evergrande scenario has signaled and warned Chinese real estate sector that has to be substantially smaller the keep the overall Chinese economy stable and healthy. According to an economic professor at Texas A&M University, China has “too big of risk in the sector.” The sector can potentially slowdown China’s economic growth, reported a disappointing 4.9% Q3 GDP.
Main Pairs Movement:
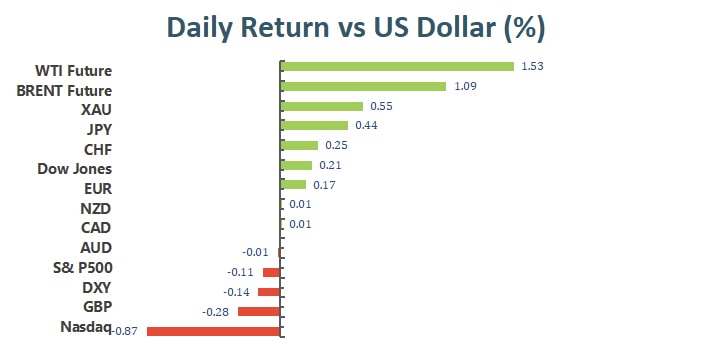
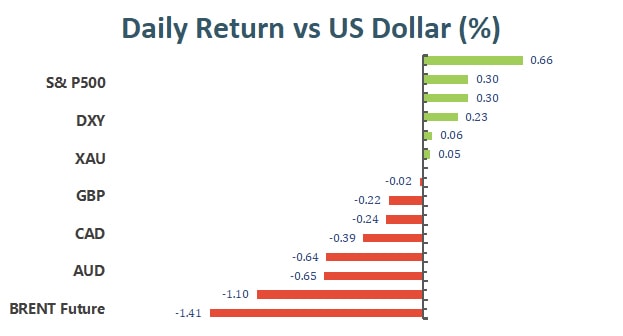
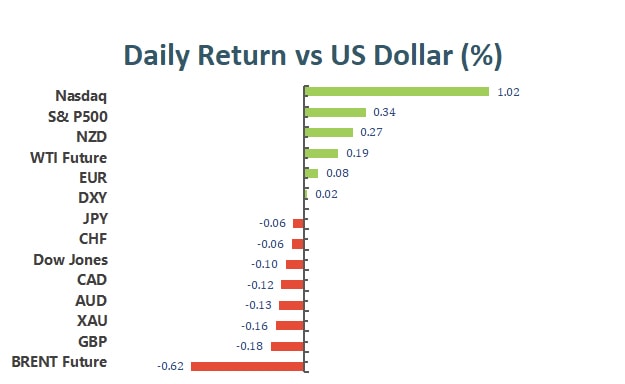
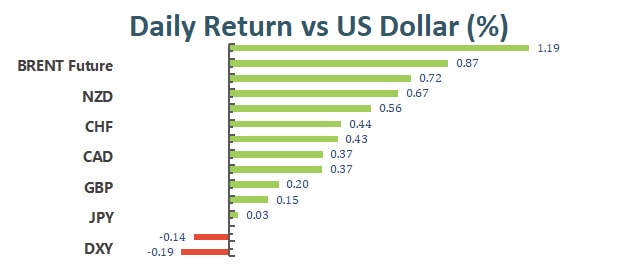
The greenback again closed in the red against most of its major rivals on Wednesday. The dollar index climbed to the intraday high around 93.870 in the early European session, but plunged after the American trading hours. The inflation data from the EU and Canada appeared positive, while the UK one missed the anticipations, adding pressures on the Bank of England to accelerate its monetary normalization plan.
The EUR/USD pair trades around 1.1650, while GBP/USD sticks firmly above the 1.3800 threshold. The commodity-linked currencies resume their yesterday’s strength, with AUD/USD breached the 0.7500 level, NZD/USD bounced off 0.7200, and USDCAD retreated toward the 1.2300 support. USD/JPY hovers around the familiar levels, trading at 114.28 at the moment.
Gold surged nearly 1% to $1,785 a troy ounce during the day. Crude oil prices continued the upward tractions, with WTI went up to $83.30 a barrel, and Brent at $85.70. The US benchmark 10-year Treasury yield posted a fresh monthly high at 1.673% and was last seen trading at 1.650%.
Cryptos got nuts as the trading in the first Bitcoin ETF kicked off on Tuesday. Bitcoin marked an all-time high at $67,000, and Ethereum breached the strong $4,000 resistance and awaits to beat its previous high.
Technical Analysis:
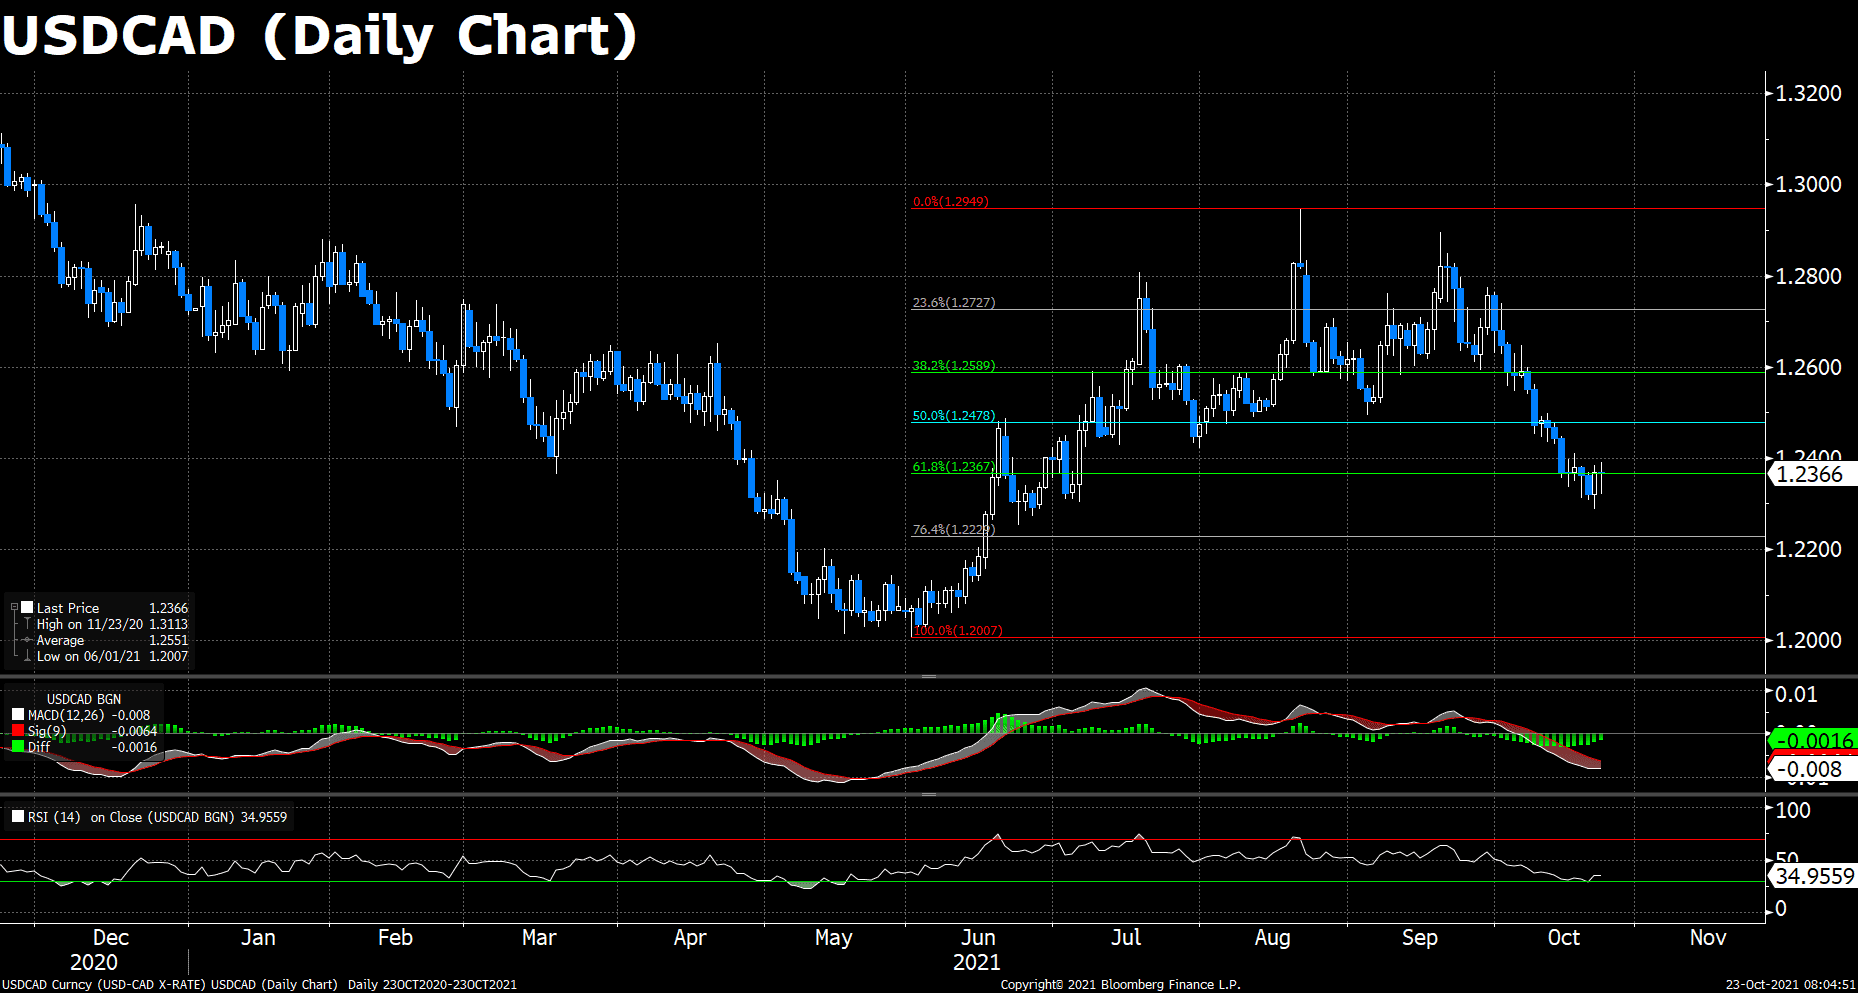
USDCAD (Daily Chart)
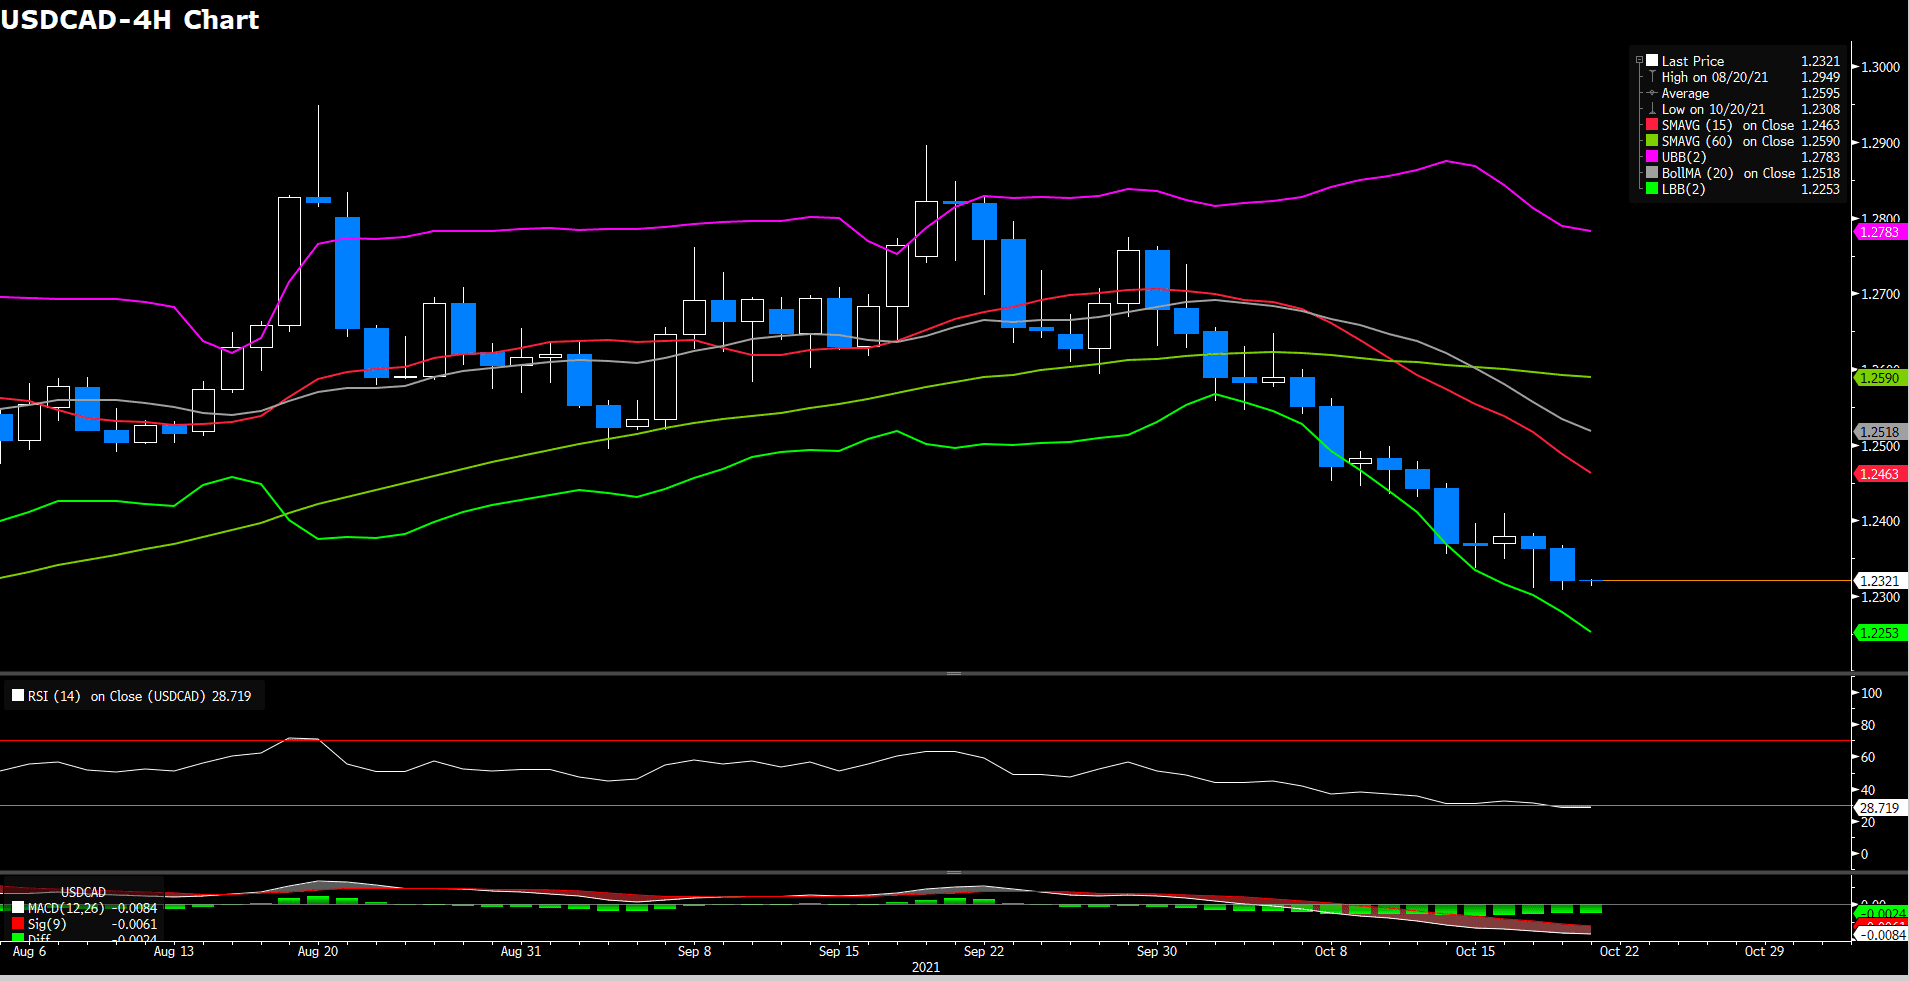
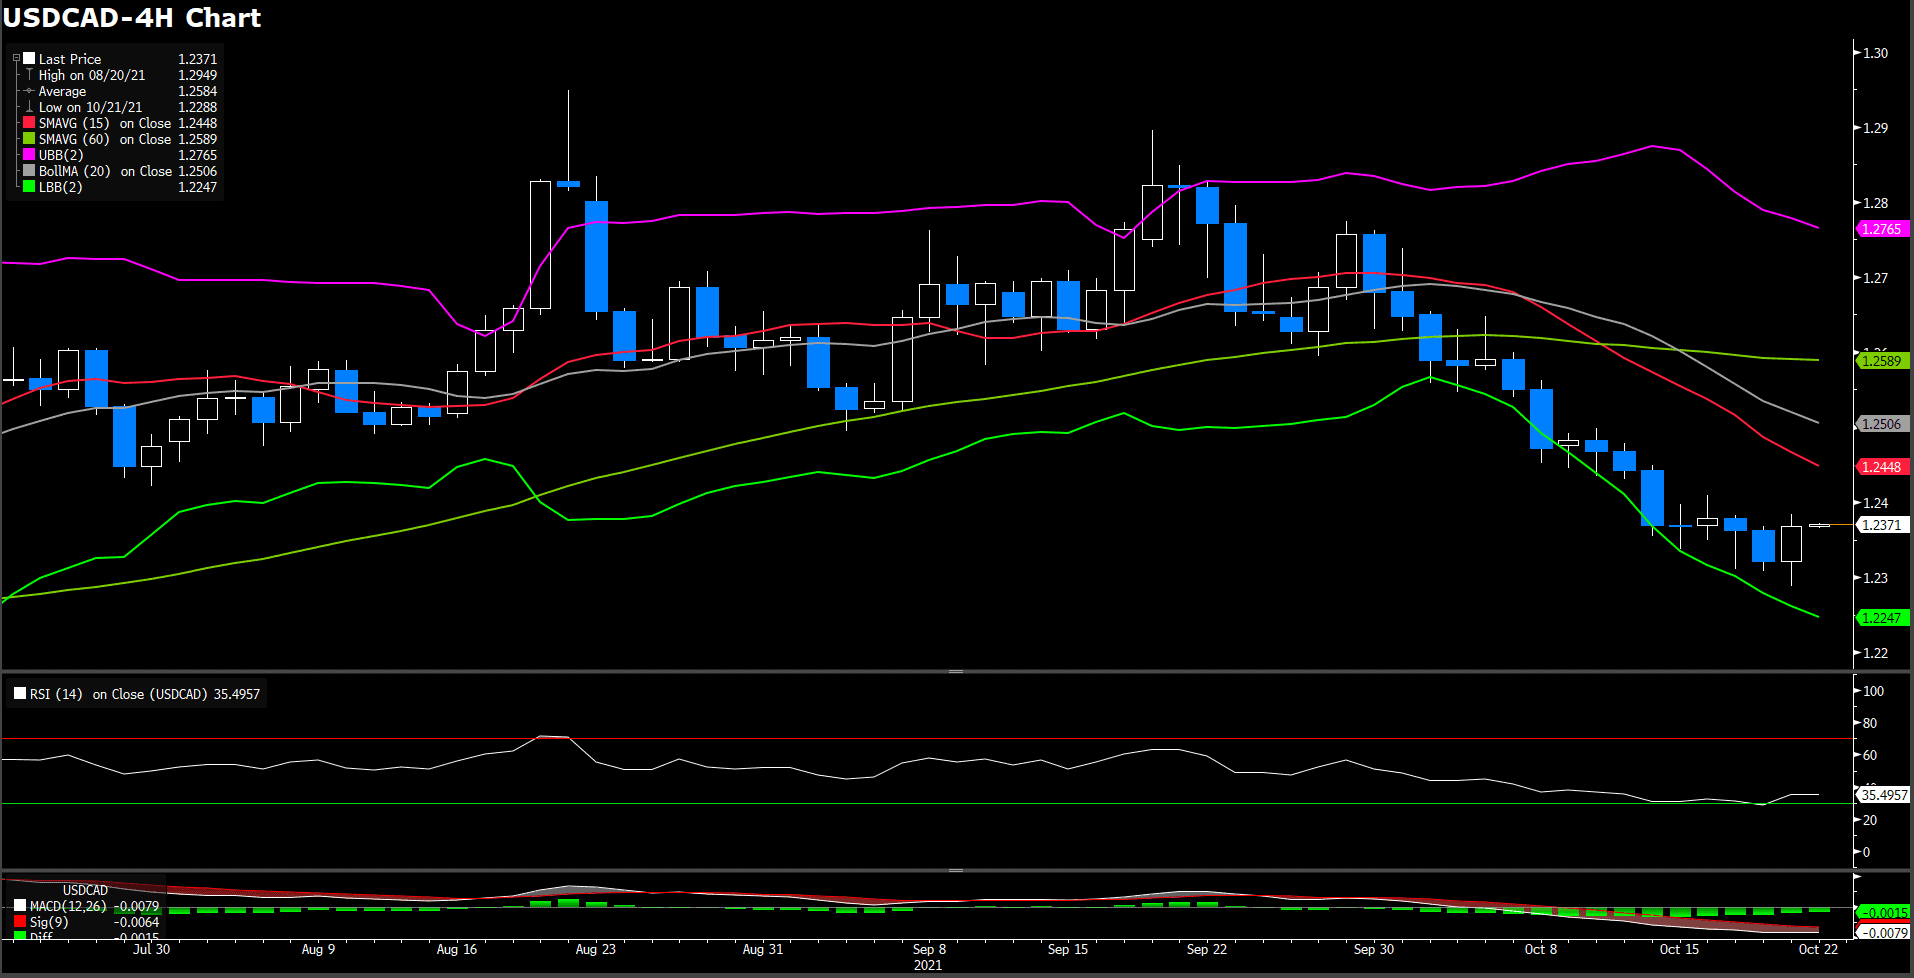
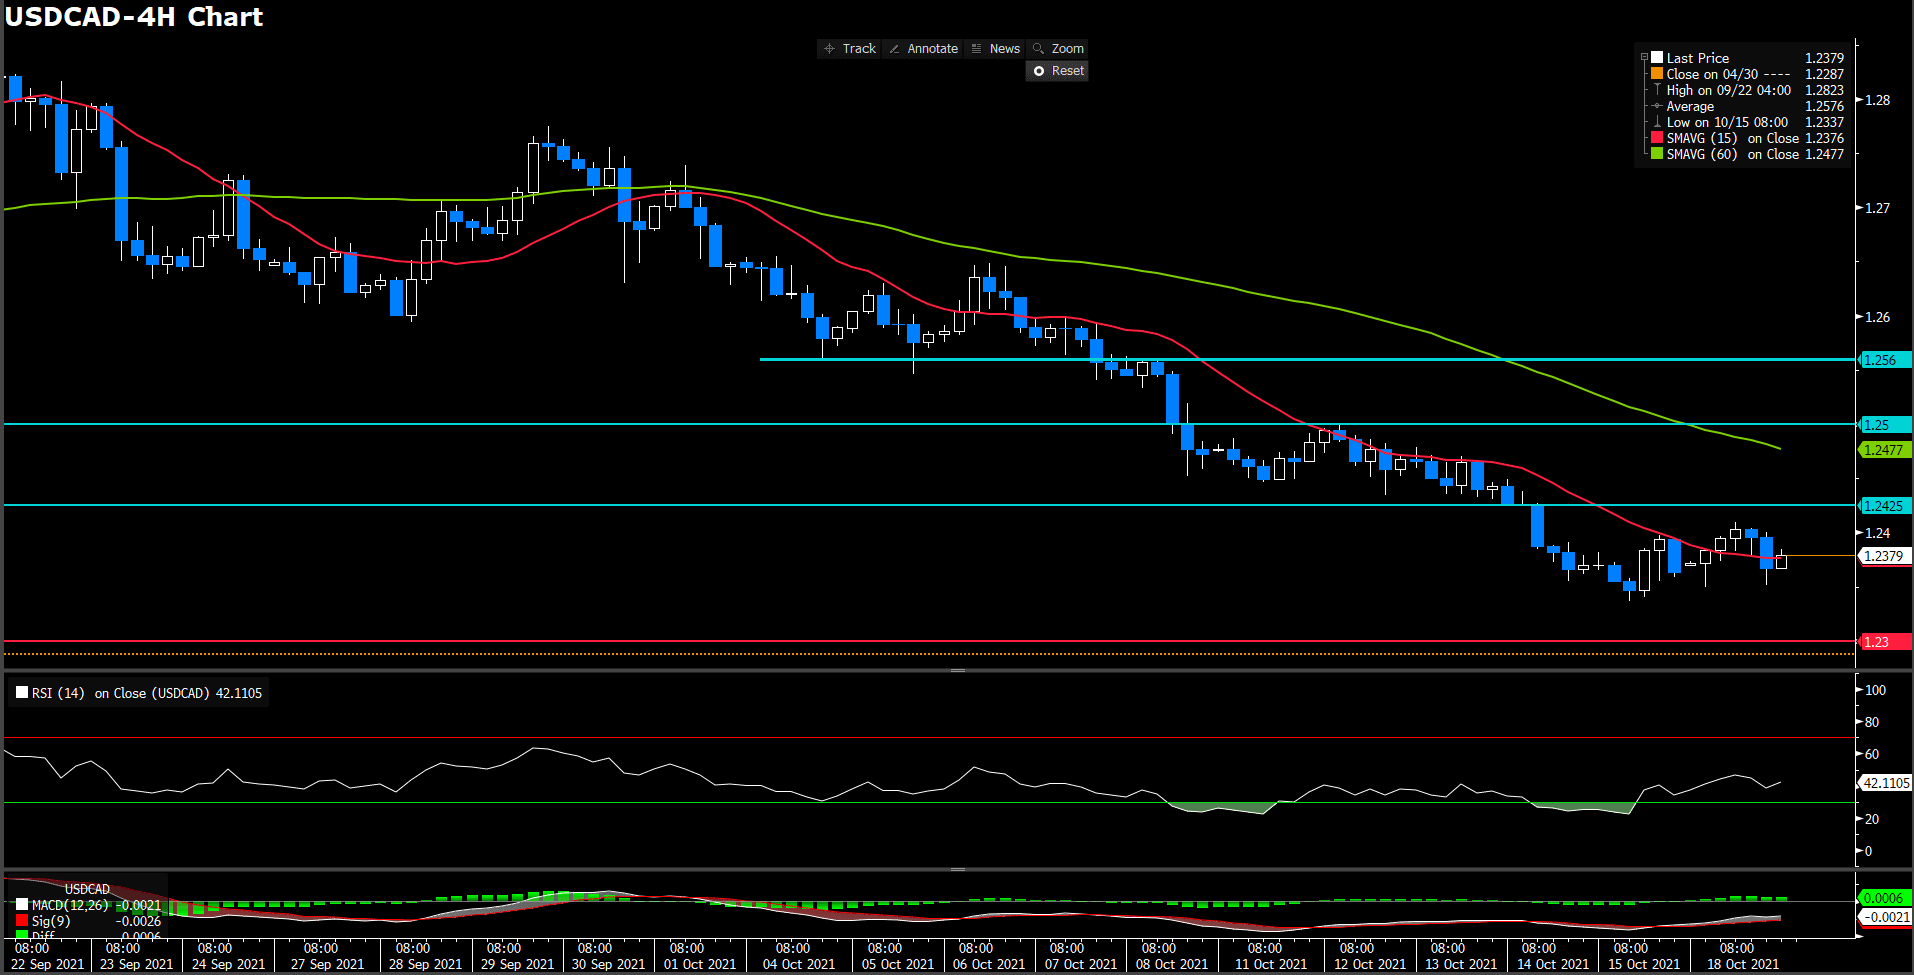
Loonie consolidated at the start of the day, but soon plummeted after the Wall Street opening, losing near 0.4%, approaching the key 1.2300 level at the time of writing. The recent dive may derive from the sharp rise in energy prices, as the price actions of the pair has been in tandem with other commodity-linked currencies.
Domestic factors have also contributed to the move of Loonie lately. The Bank of Canada (BoC) is set to taper bond purchases further to $1 billion Canadian dollars per week, and the whole QE program is anticipated to end in December as investors bet the BoC announces a rate hike in 2022. The tighter job market and rising inflation appear supportive to this kind of perspectives.
On the technical front, the daily RSI has just breached the oversold territory, and the price actions have been one step ahead of the bottom of the bollinger band, suggesting a short-term correction may come before further decline.
Resistance: 1.2480 (50% Fibonacci), 1.2750 (78.6% Fibonacci), 1.29490 (yearly high)
Support: 1.2273 (Bottom of Bollinger Band), 1.2232 (23.6% Fibonacci), 1.2010 (yearly low)
EURUSD (4-hour Chart)

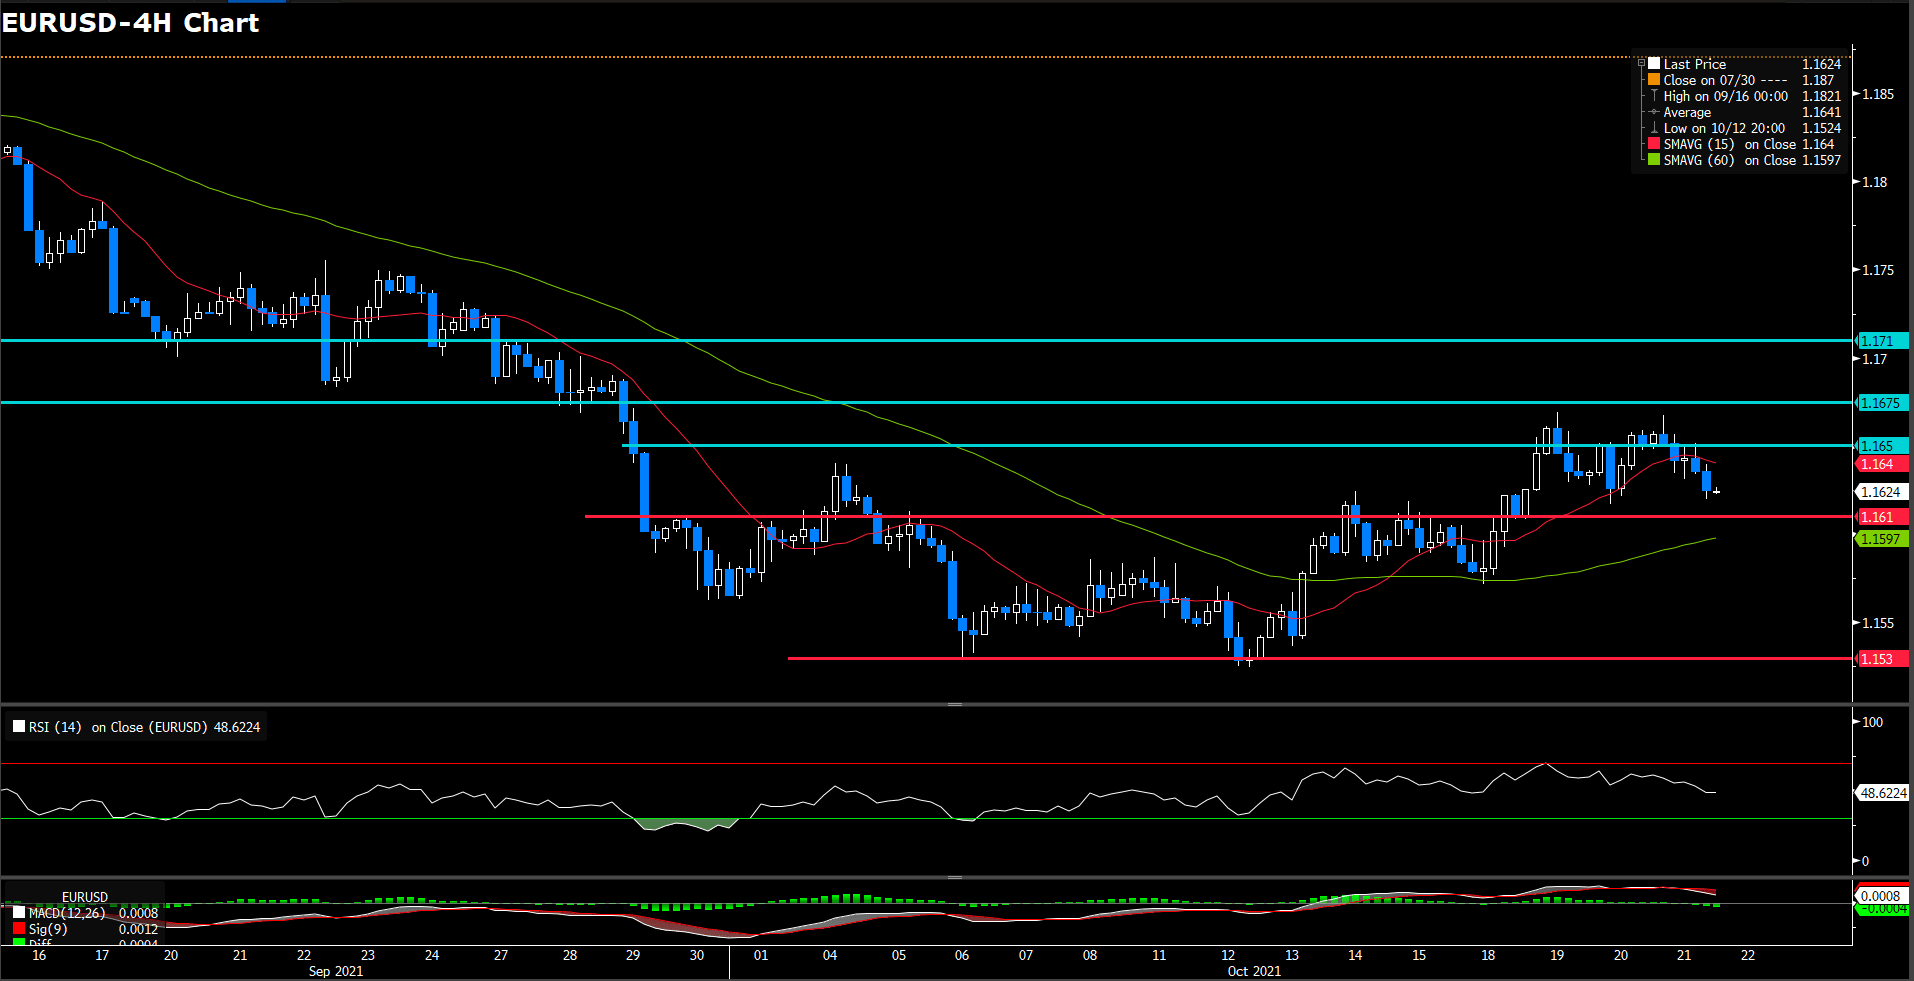
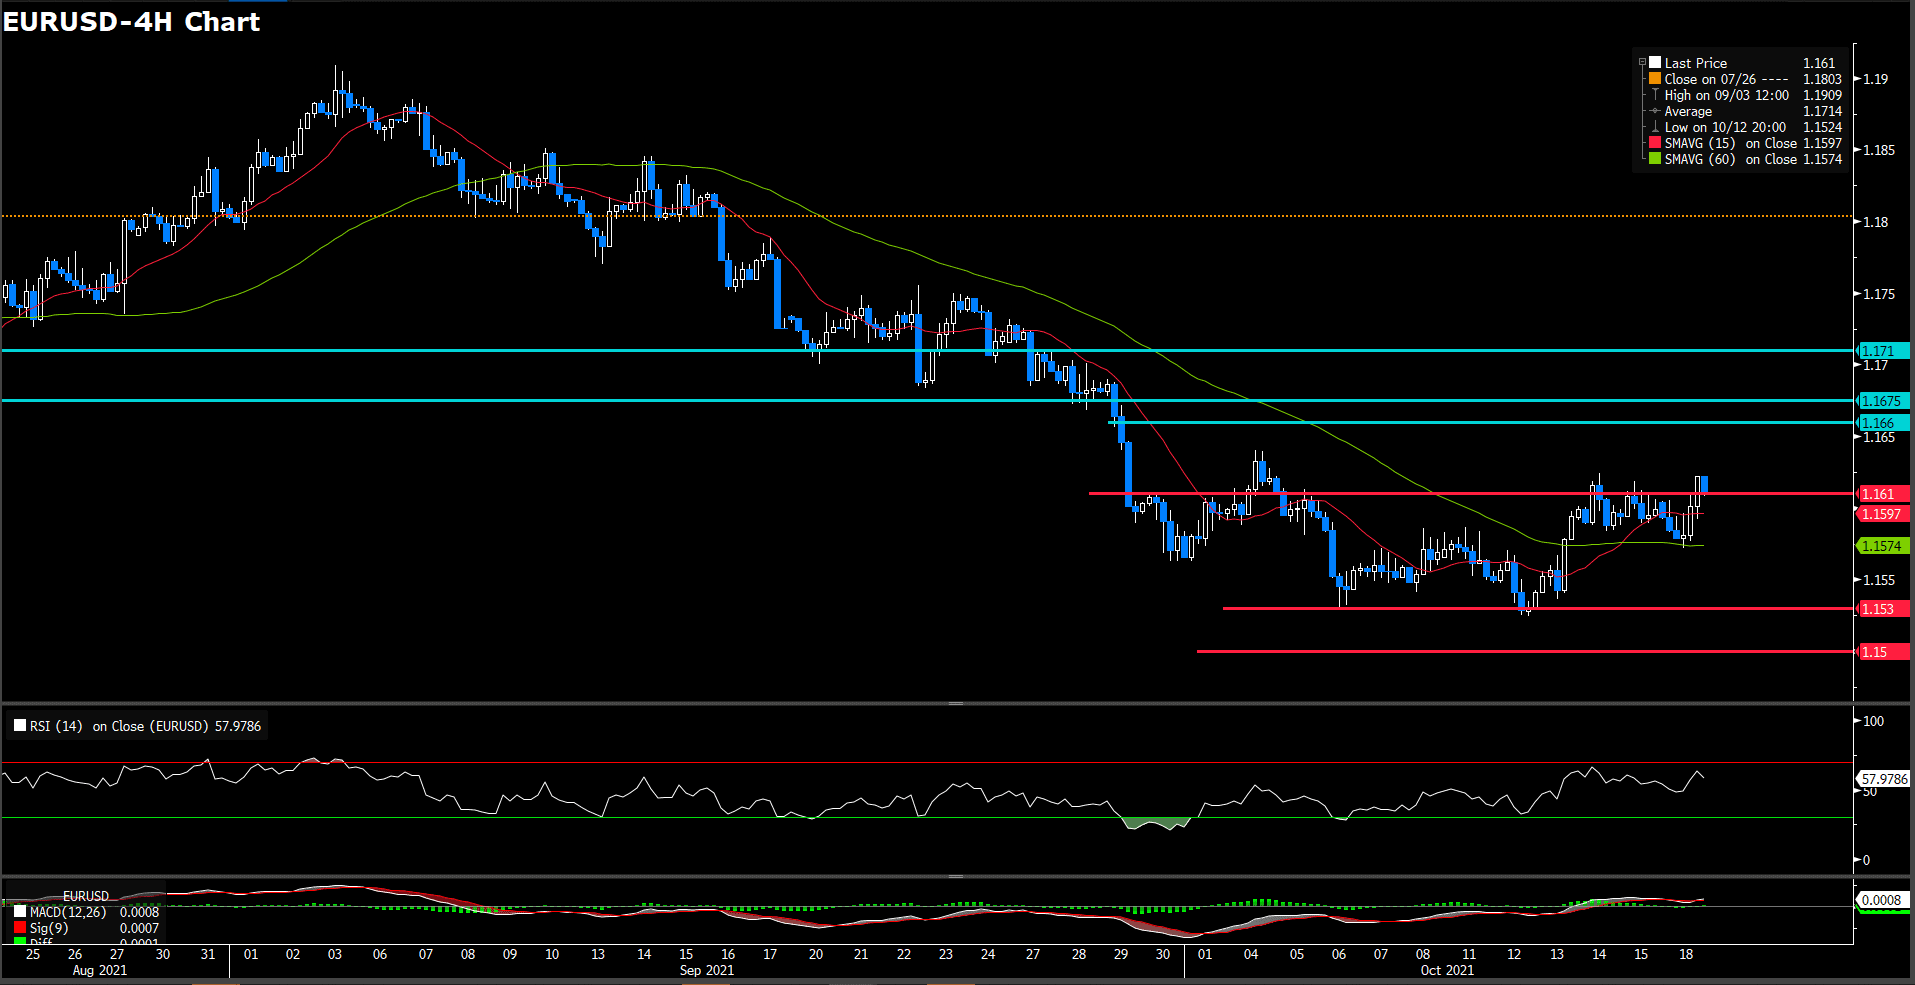
The euro keeps crawling higher against a somewhat softer U.S. dollar on Wednesday, on track to complete a three-day recovery. The pair has confirmed above 1.16 earlier today to ease negative pressure, before hitting resistance right below October’s peak, at 1.167. In the background, the U.S. dollar index has retreated further from the one-year high at 94.5 hit last week, reaching session lows at 93.5 area, 1% below last week’s top. The positive market sentiment has been reflected on moderate advances in Wall Street.
On technical side, the RSI solely moved whereabout 60.2 figures, a slightly changed compare yesterday, suggesting a slightly bullish movement in short term. On moving average aspect, 15- long indicator has expedited it up side traction and 60-long indicator is turning it head to slightly upward momentum.
In lights of current price has penetrated 1.165 level which we expected as a critical resistance for up traction before, it seems could continue the bullish movement if it could hold above the threshold. On up side, we expect the immediately resistance will be psychological level at 1.1675 which is a 2-month-long resistance for current price action.
Resistance: 1.1675, 1.171
Support: 1.153, 1.161, 1.165
USDJPY (4 Hour Chart)
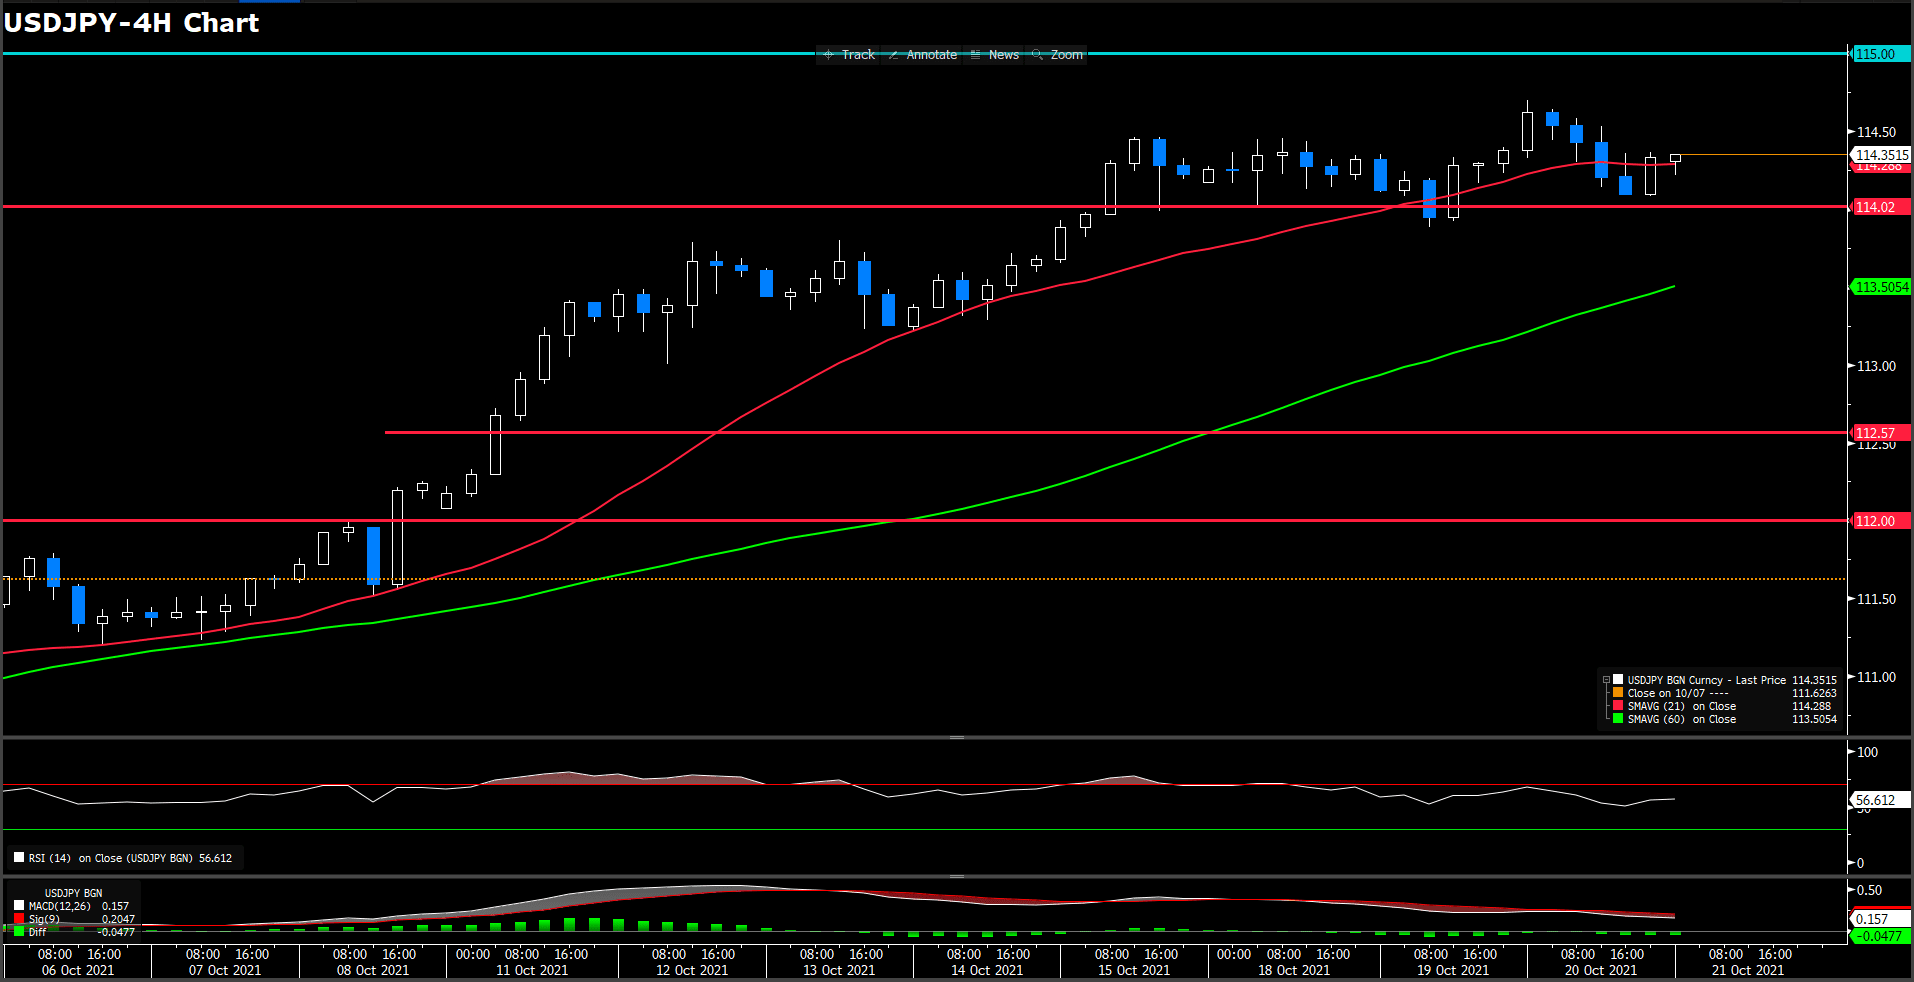
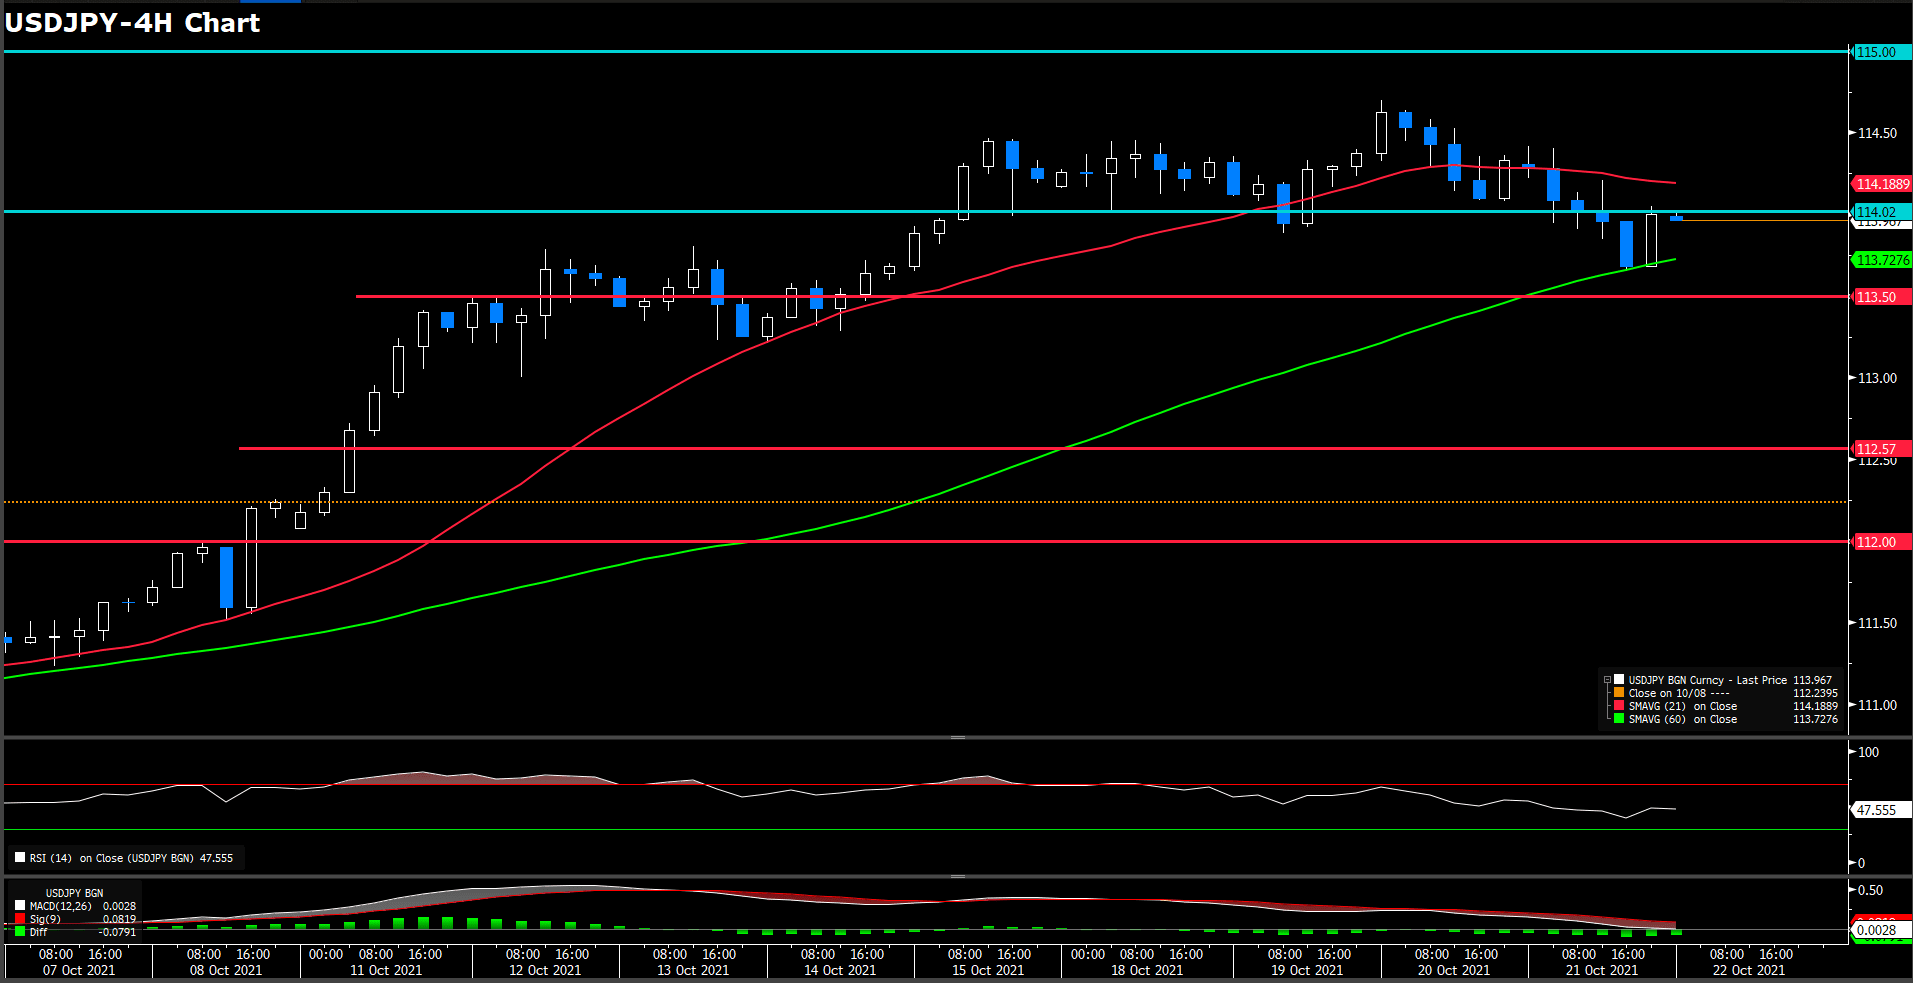
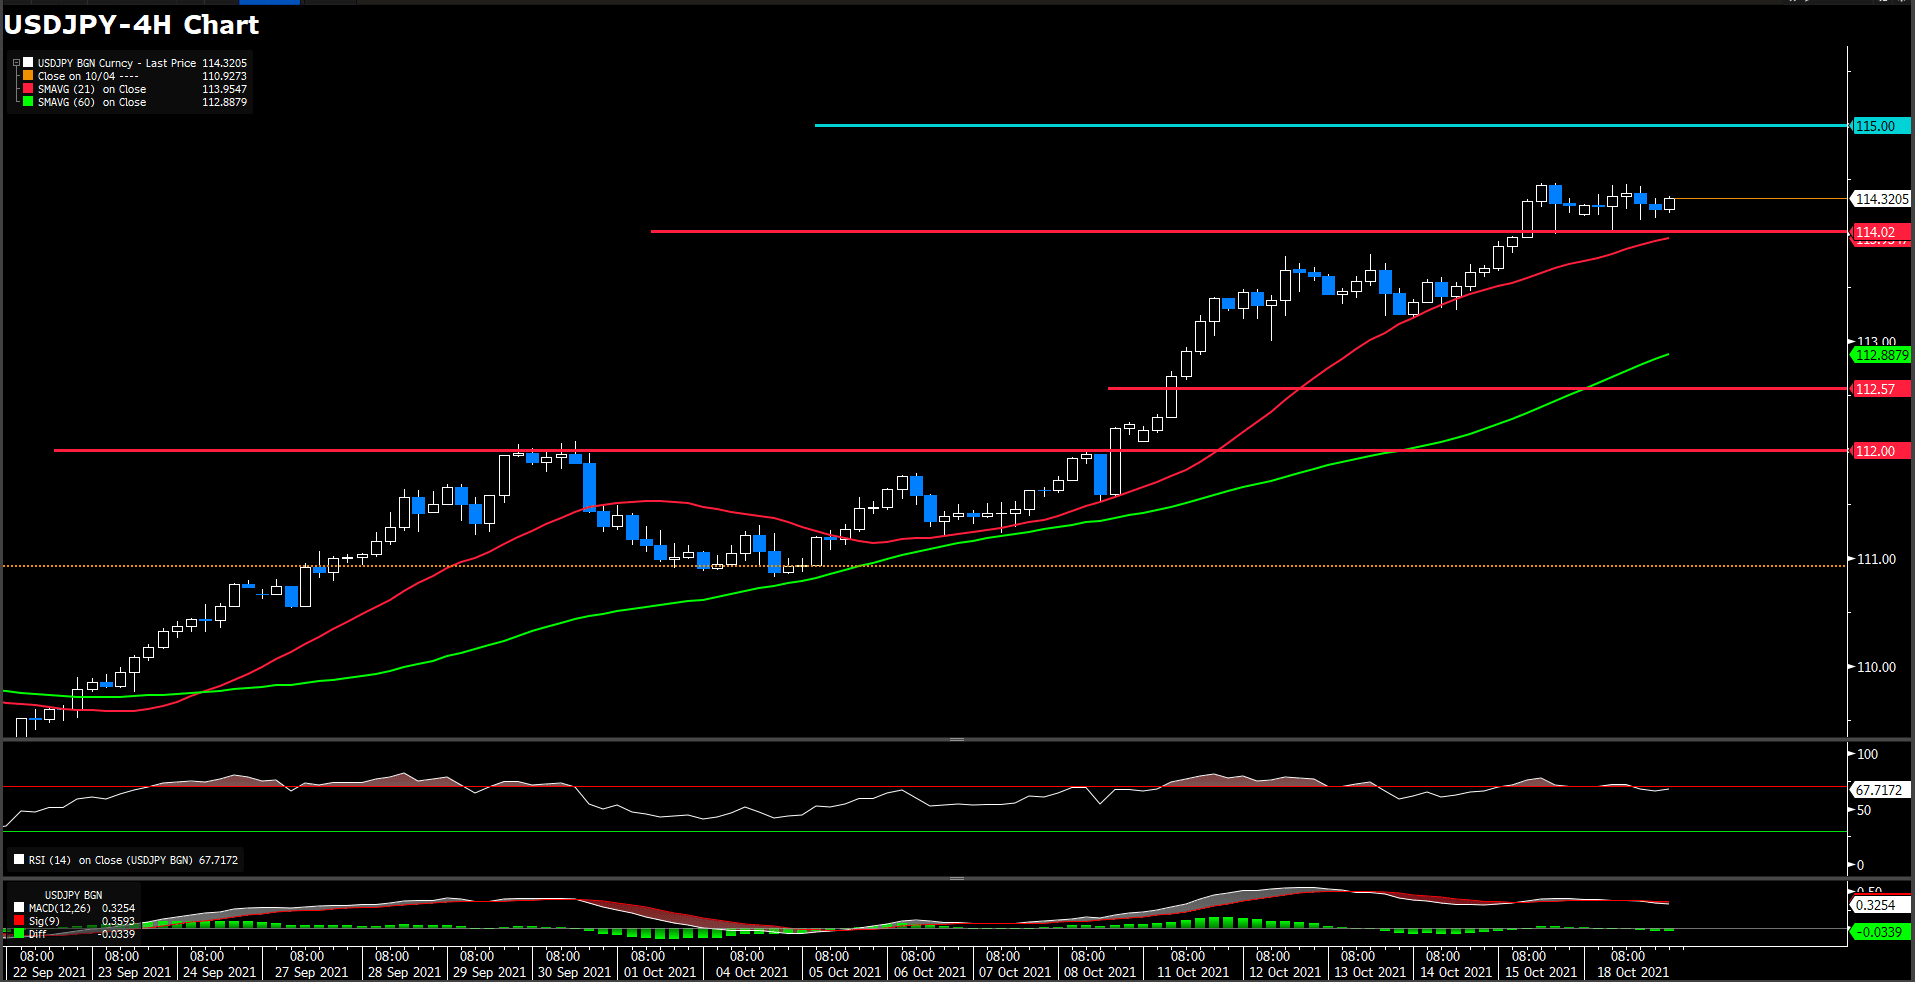
The U.S. dollar has pulled pack after hitting fresh five-year highs at 114.7 on Wednesday, to consolidate in lower range of 114. The pair has turned negative on daily charts, although the near-term trend remains positive, after have rallied nearly 5% over the last four weeks. Investors’ optimism and the pause on U.S. bond yields’ rally have dented demand for the dollar, allowing most majors to post moderate recoveries. Meanwhile, a consecutive widening gap of U.S. and Japan has squeezed the yen’s attractiveness for the investors.
From a technical perspective, RSI indicator rebound reversed from over bought sentiment at 56.6, suggesting bullsish momentum in short term. On moving average indicator, 15- and 60-long indicator still retaining upside traction.
Since yen stand above 114 level solidly for days, it seems lost driving momentum or further trigger foundamental news currently. Therefore, 114 level still a important support level for buy side investor.
Resistance: 115
Support: 114.02, 112.57, 112
Economic Data
|
Currency
|
Data
|
Time (GMT + 8)
|
Forecast
|
|
EUR
|
EU Leader Summit
|
18:00
|
–
|
|
USD
|
Initial Jobless Claims
|
20:30
|
300 K
|
|
USD
|
Philadelphia Fed Manufacturing Index (Oct)
|
20:30
|
25
|
|
USD
|
Existing Home Sales (Sep)
|
22:00
|
6.09 M
|
|
|
|
|
|
|
|
|
|
|
|
|
|
|
|
|
|
|
|
|
|
|
|
|
|
|
|
|