Market Focus

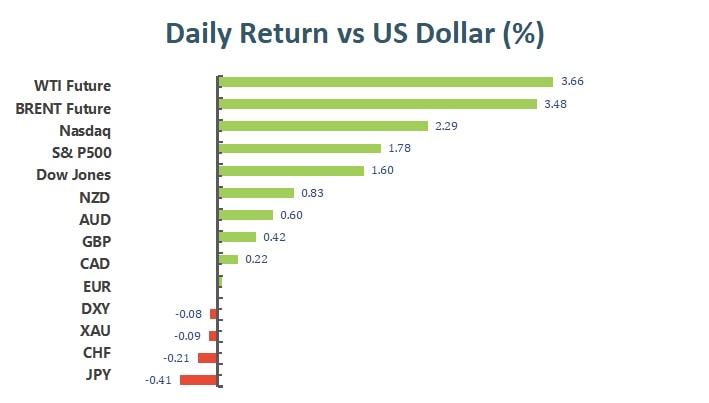
US stock advanced on Tuesday amid risk-on market sentiment, rebounding from its biggest three-day slide since September as the market demand for risk assets increased. Despite US Democrat Senator Joe Manchin rejected Biden administration’s $1.75T Build Back Better (BBB) social spending package yesterday, President Joe Biden said that he still has a chance to strike a deal with Manchin to get his roughly $2 trillion economic plan through Congress. Therefore, the possibly reviving talks on Biden’s economic agenda lend some support to stock markets. On top of that, Biden is also considering dropping travel restrictions against South Africa, where the new Omicron variant was first identified. Another news from Bloomberg reported that the US food and Drug Administration was set to authorize their pills to treat coronavirus as soon as this week.

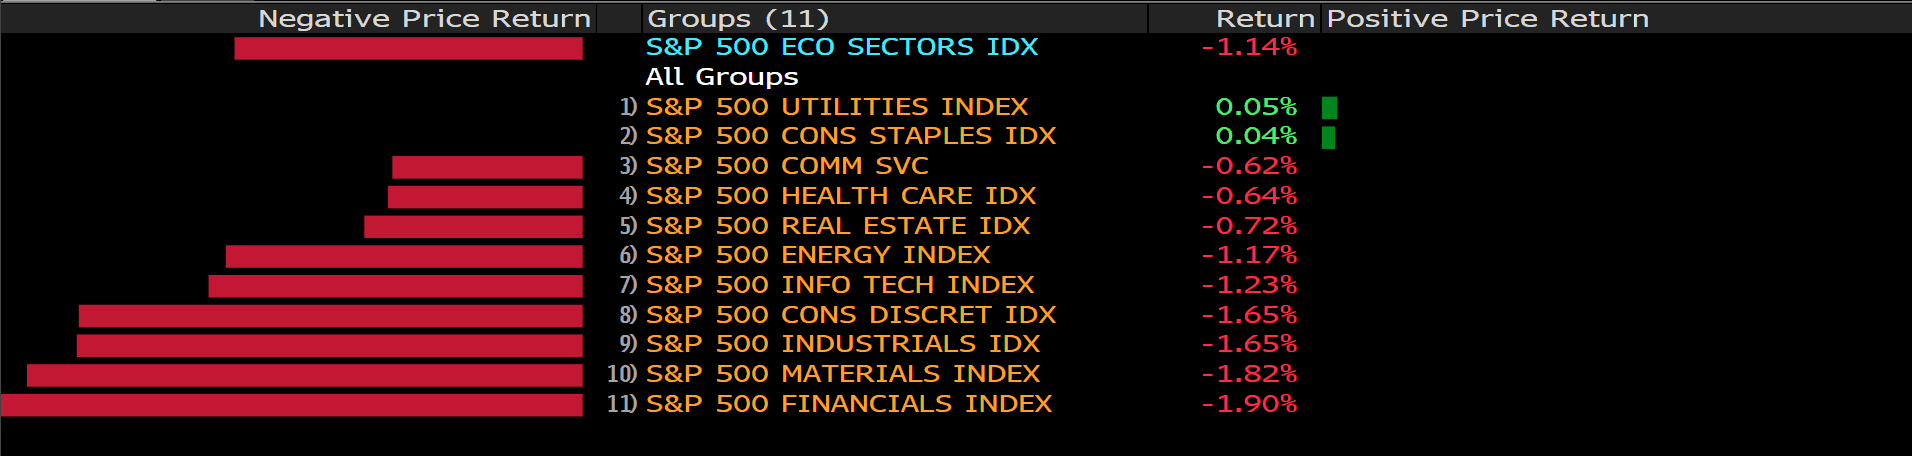
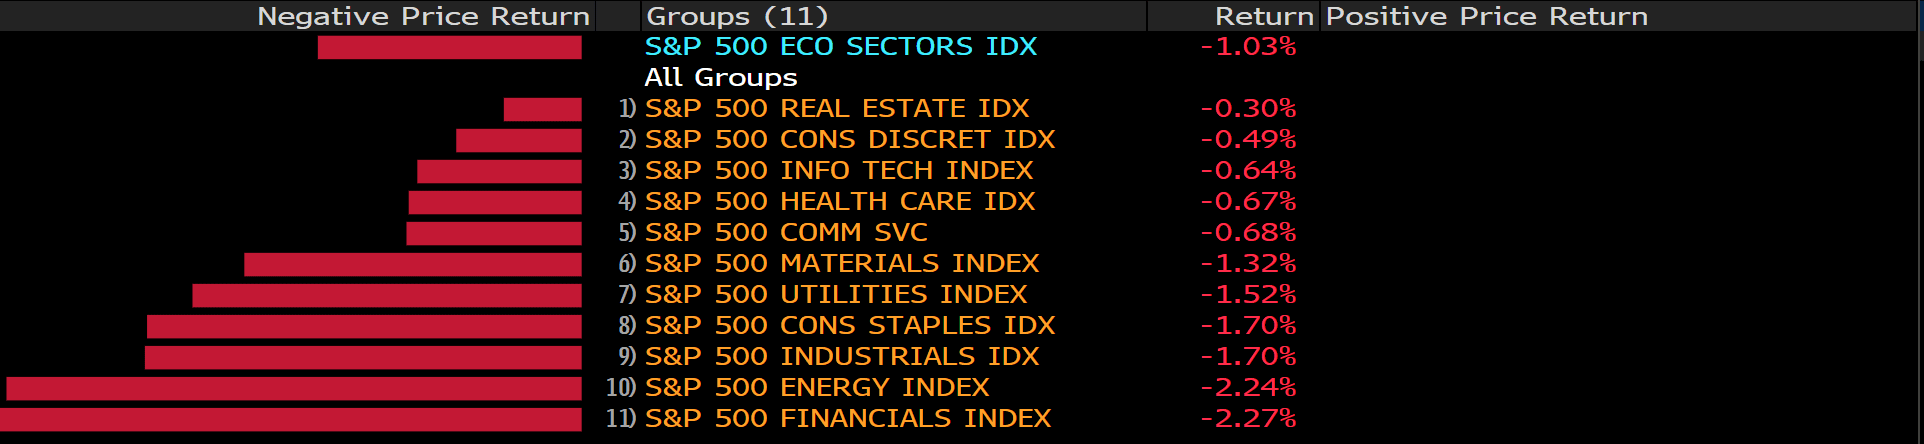
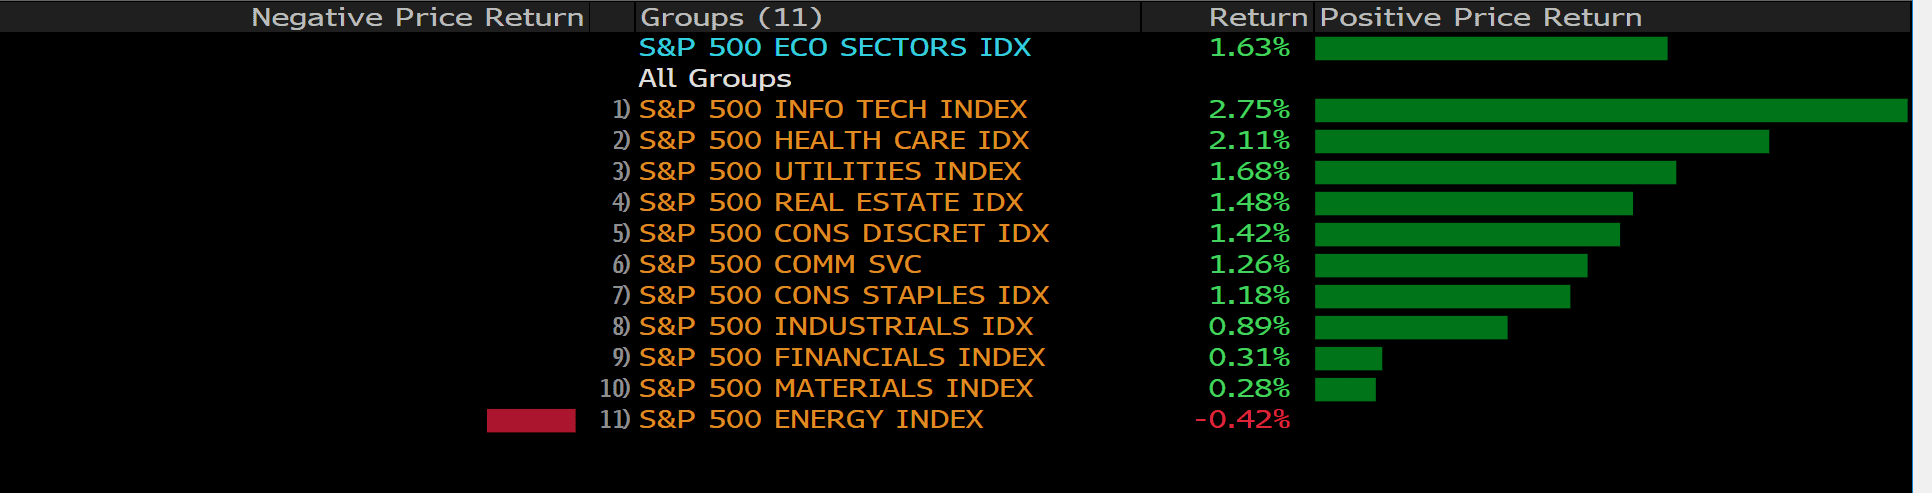
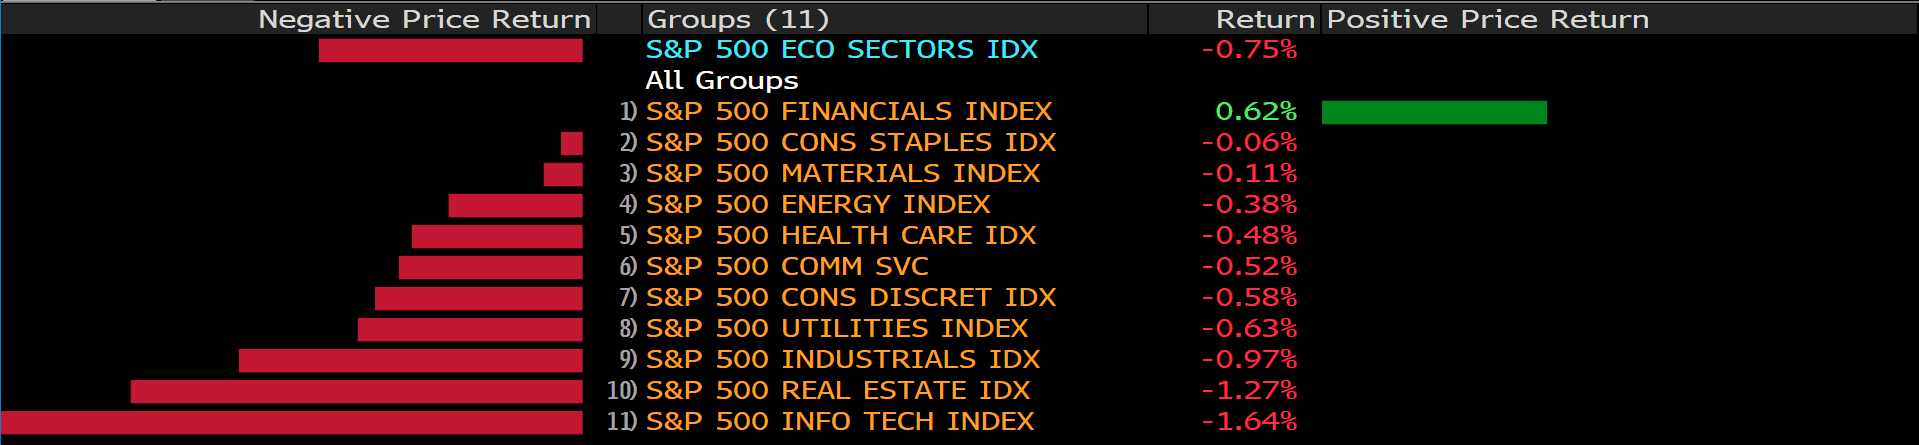
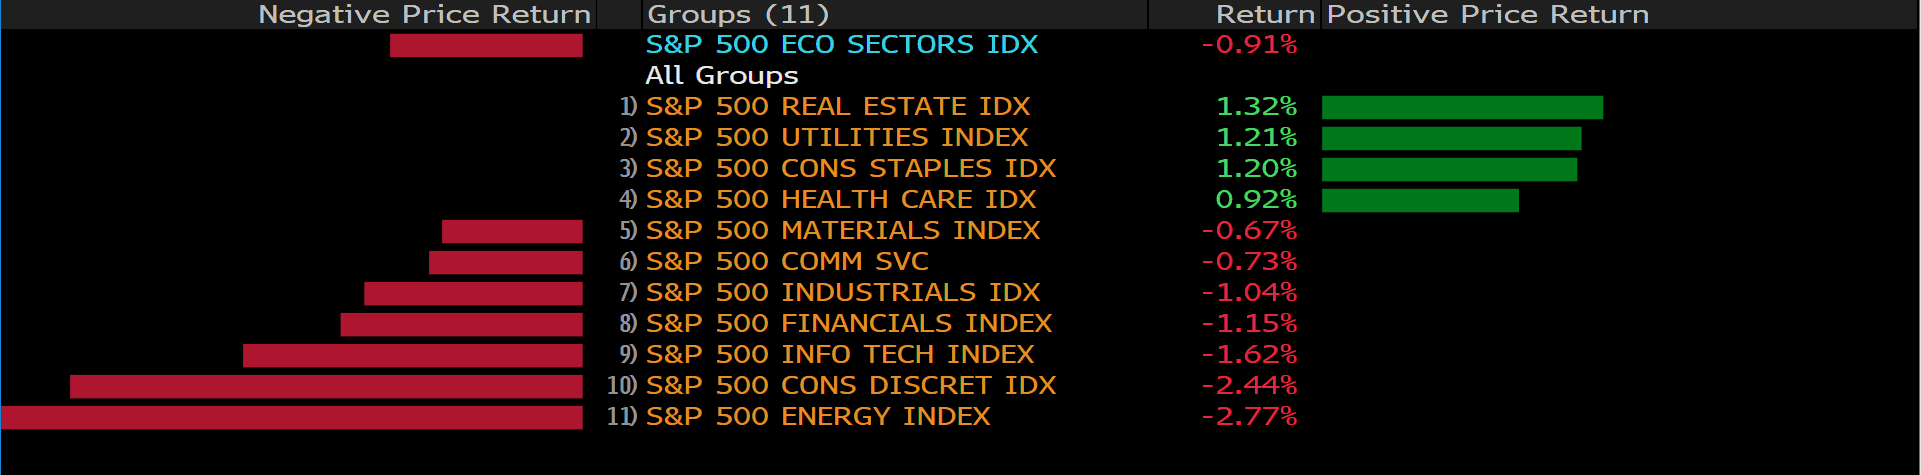
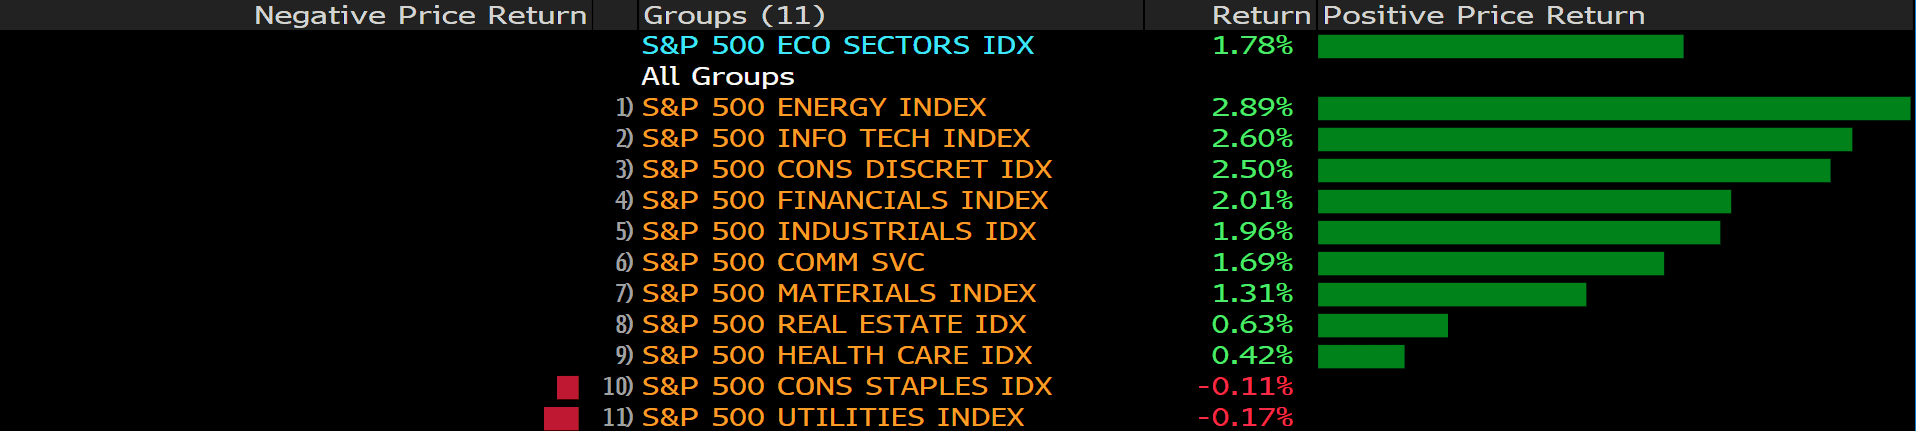
The benchmarks, S&P 500, Nasdaq 100 and the Dow Jones Industrial Average both rose on Tuesday as risk appetite flips positive in American session and the prospect of President Joe Biden’s economic plan are also improving. S&P 500 was up 1.8% on a daily basis and the Dow Jones Industrial Average also advanced with a 1.6% gain for the day. Nine out of eleven sectors stayed in positive territory as the energy and information technology sectors are the best performing among all groups, rising 2.89% and 2.60%, respectively. The Nasdaq 100 climbed the most with 2.3% gain on Tuesday due to the surge in chipmaker Micron Technology Inc., and the MSCI World index rose 1.7%.

一張含有 文字 的圖片

自動產生的描述


Main Pairs Movement:

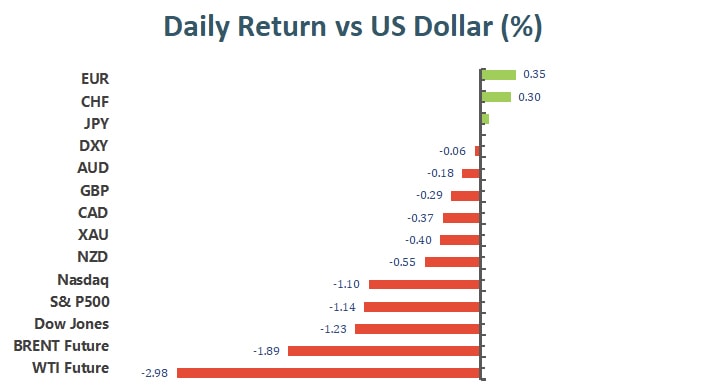
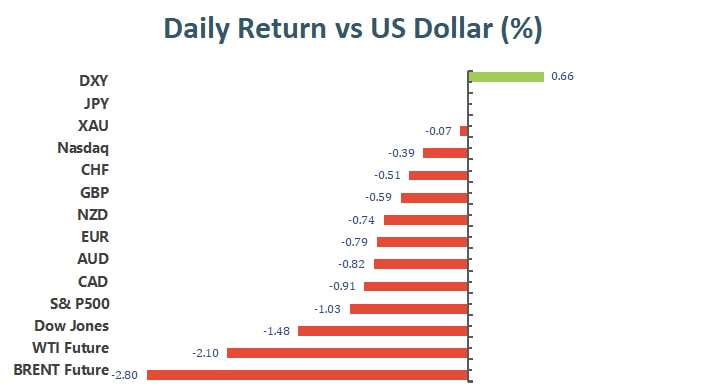
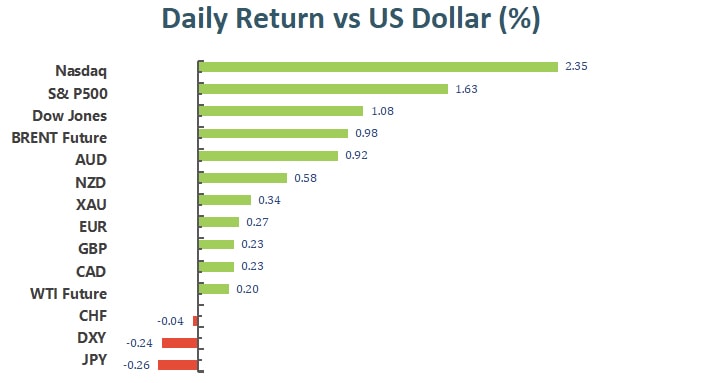
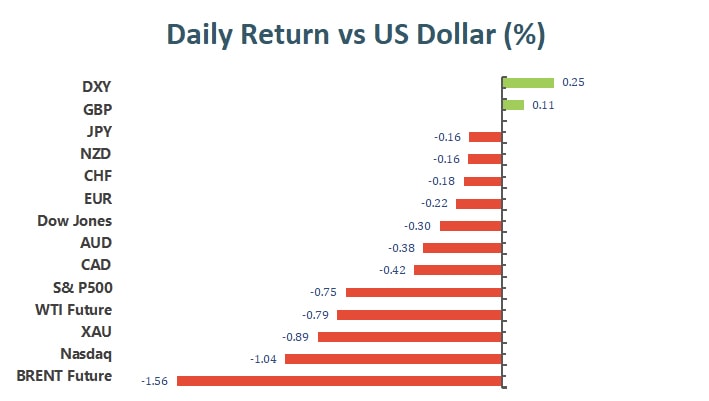
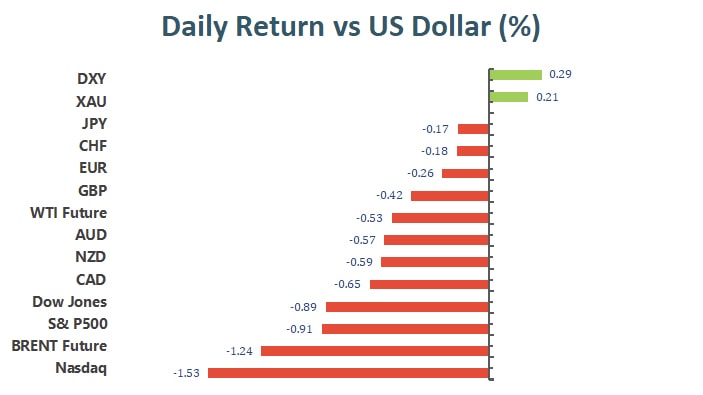
The US dollar edged lower on Tuesday, staying in negative territory amid upbeat market mood despite the US 10-year yields ending 3.7% higher. The DXY index dropped to a daily low under 96.35 level during European session, then rebounded back above 96.62 to offset most of its intraday’s losses. Investors now considered that vaccines helped tame the Omicron virus outbreak and the news that the US FDA is ready to authorize pills from Pfizer and Merck also favored US stock market and acted as a headwind for the safe-haven greenback.

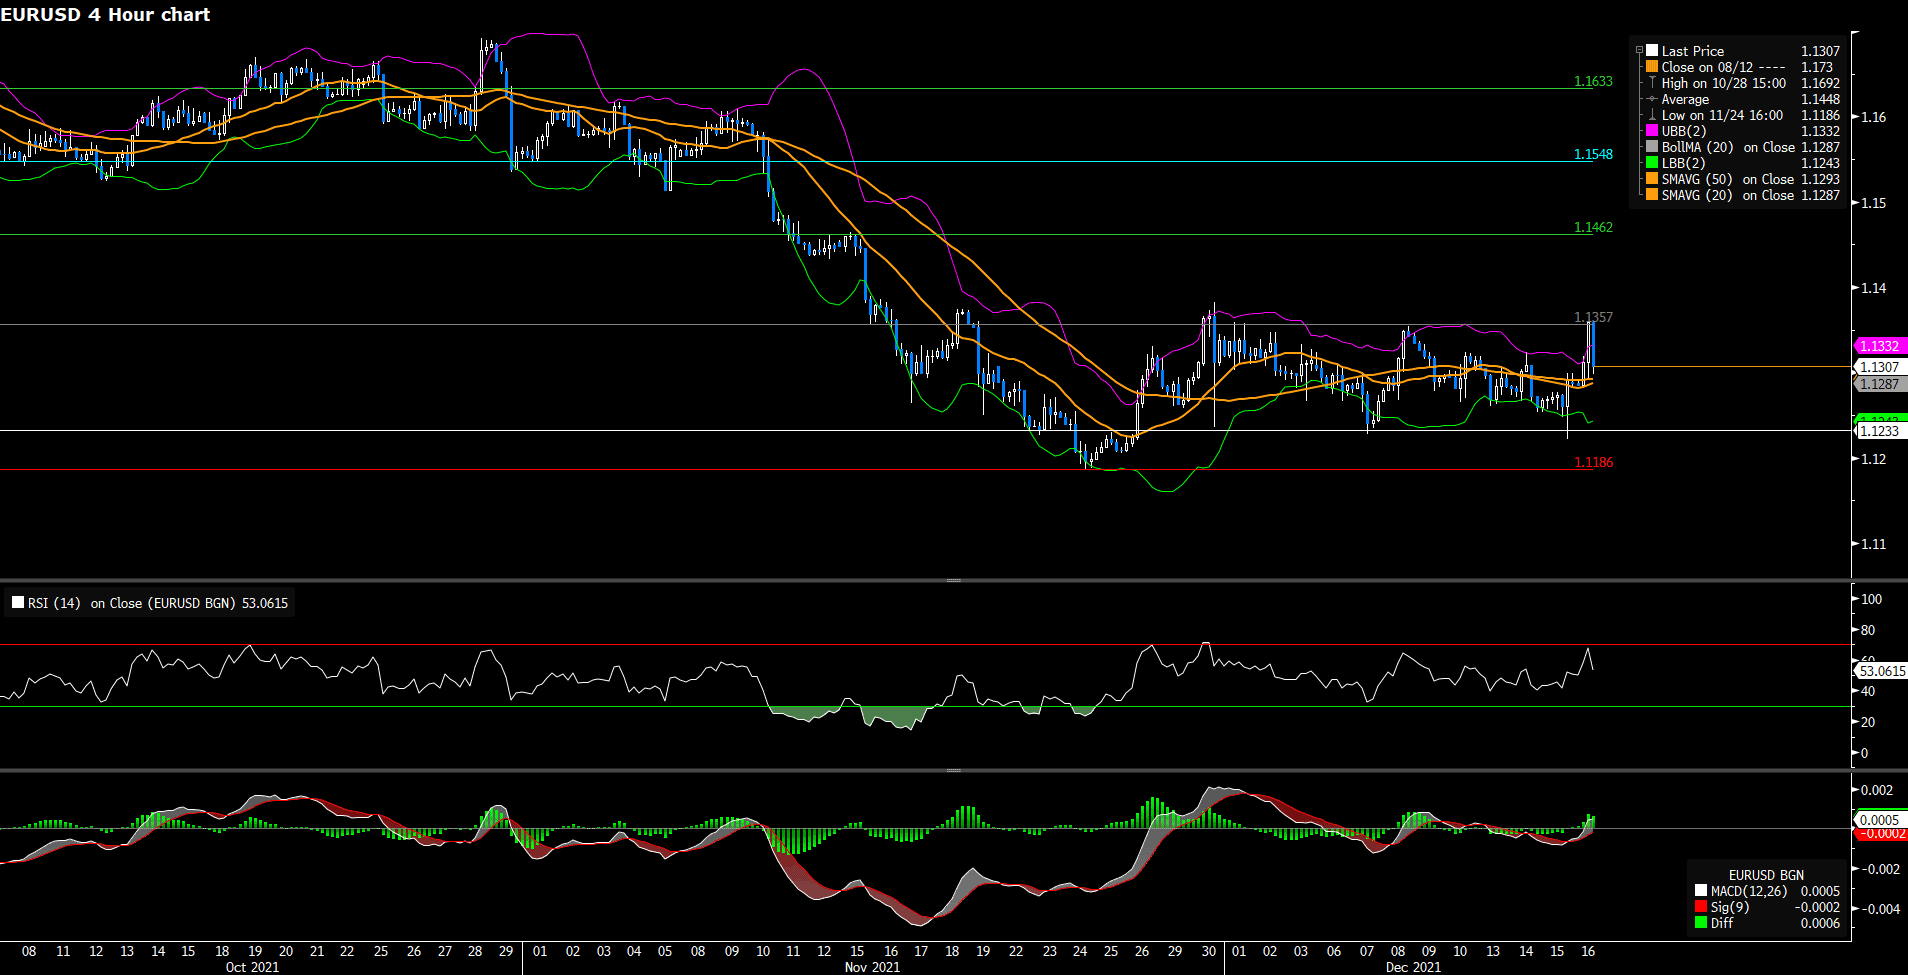
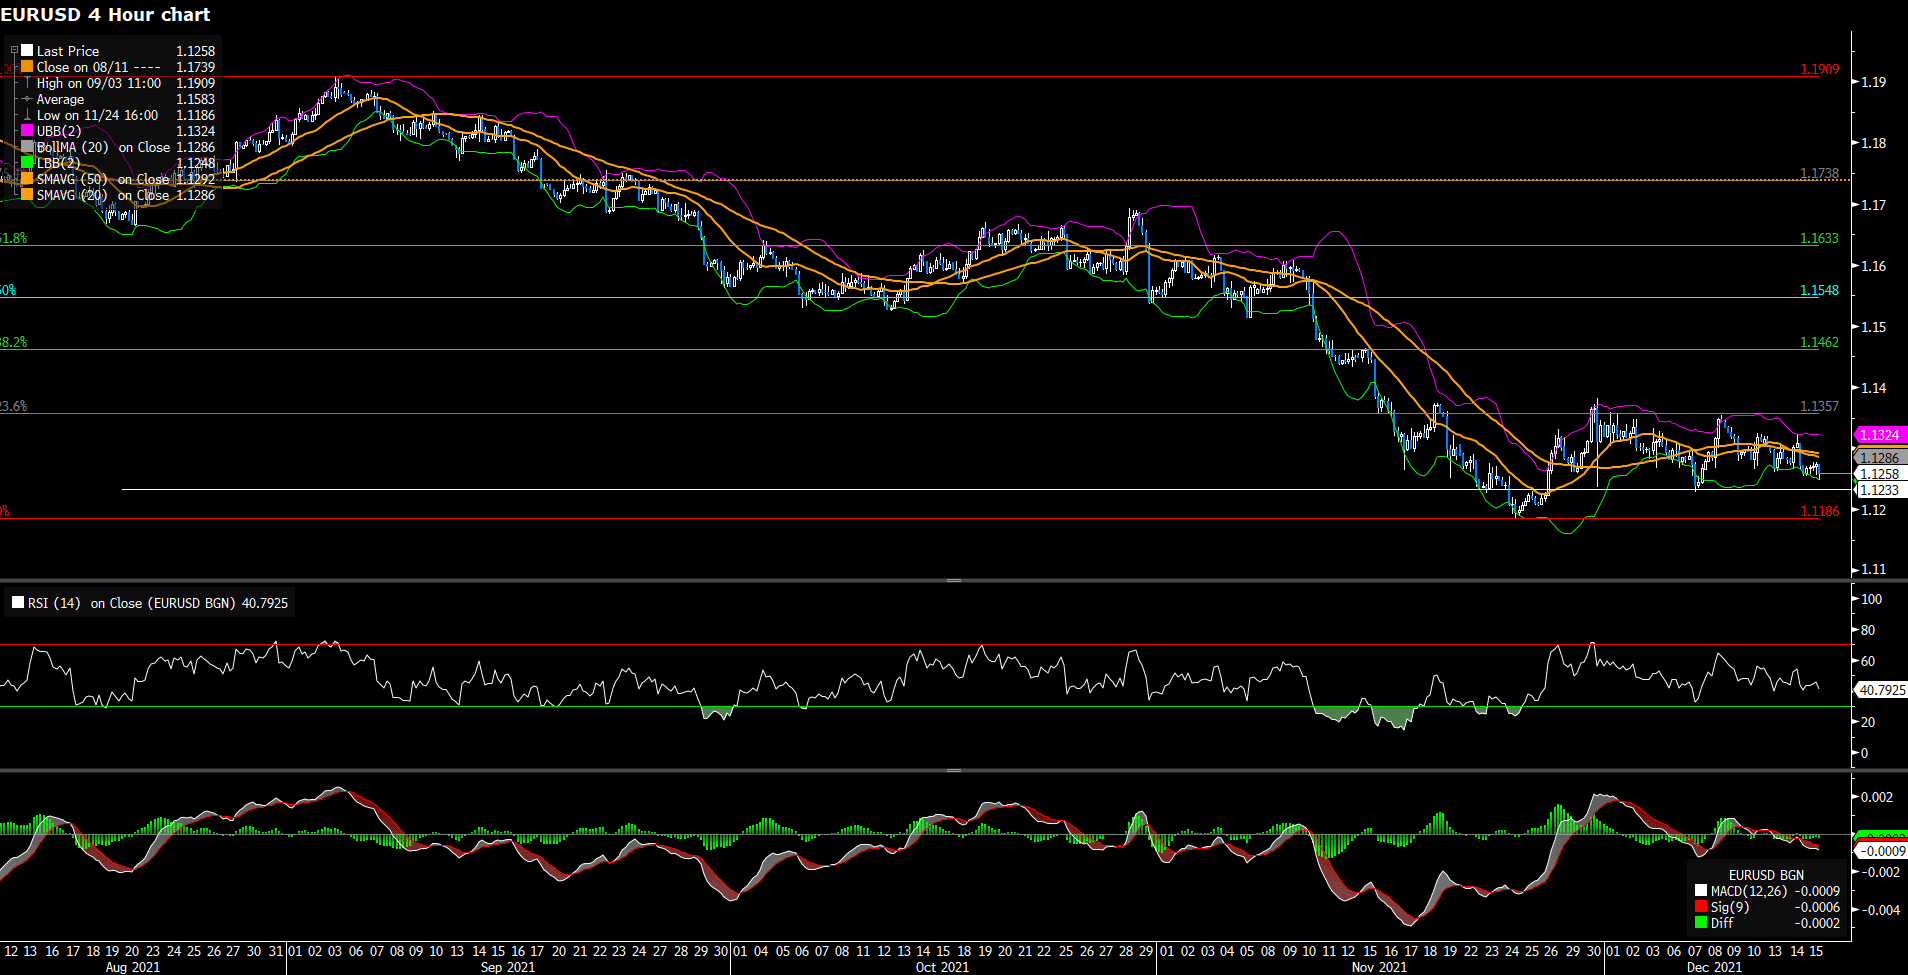
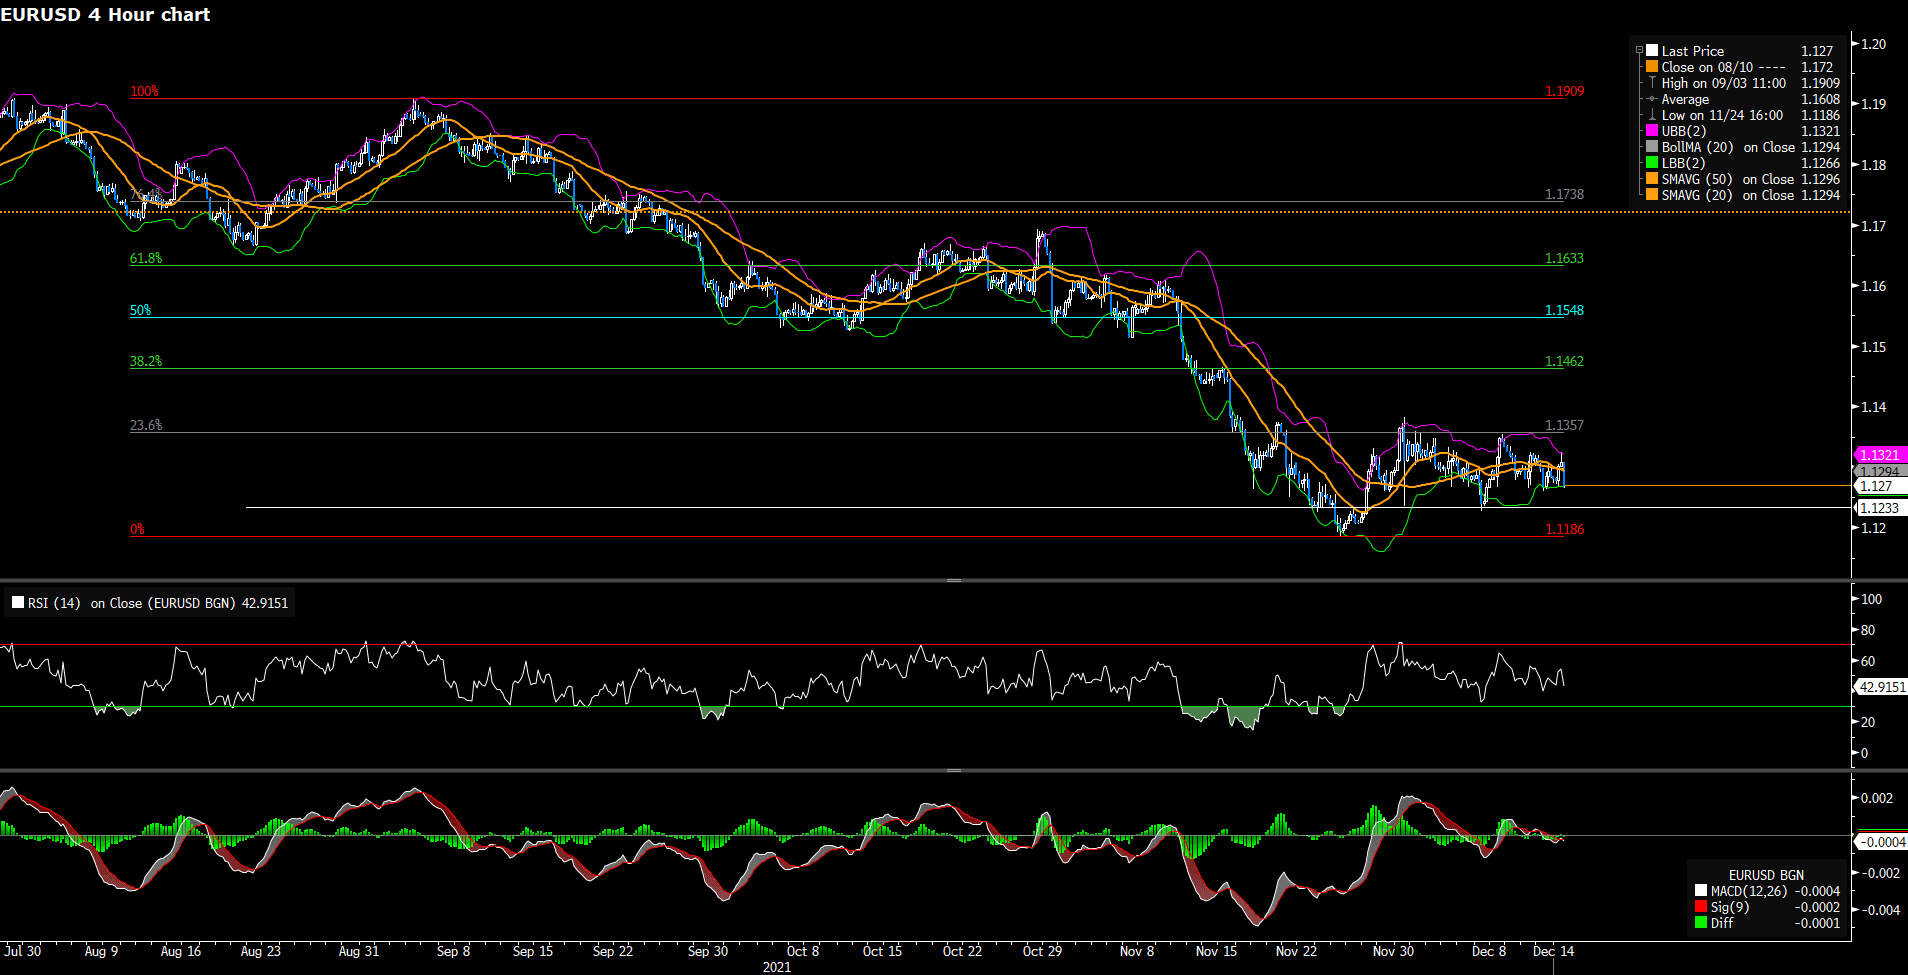
GBP/USD advanced 0.47% on Tuesday as a broader recovery in risk appetite across markets favored risk currency like British pounds. But traders will remain on notice for an new lockdown announcement that could come later in the week. The cable kept being pushed higher through out the session, touching daily highs around 1.326 area. Meanwhile, EUR/USD climbed to a daily top above 1.130 level but then retreated back to surrender some of its intraday’s gains. The pair gained 0.09% for the day, as volumes are thinning ahead of Christmas holidays.

Gold declined and touched a daily low under $1785 in late American session, as the appetite for riskier assets dented demands in the precious metal. Meanwhile, WTI oil surged almost 3.0% for the day, as the risk-on market mood and positive news about Omicron variant both acted as a tailwind for the black gold.


Technical Analysis:

XAUUSD (4- Hour Chart)

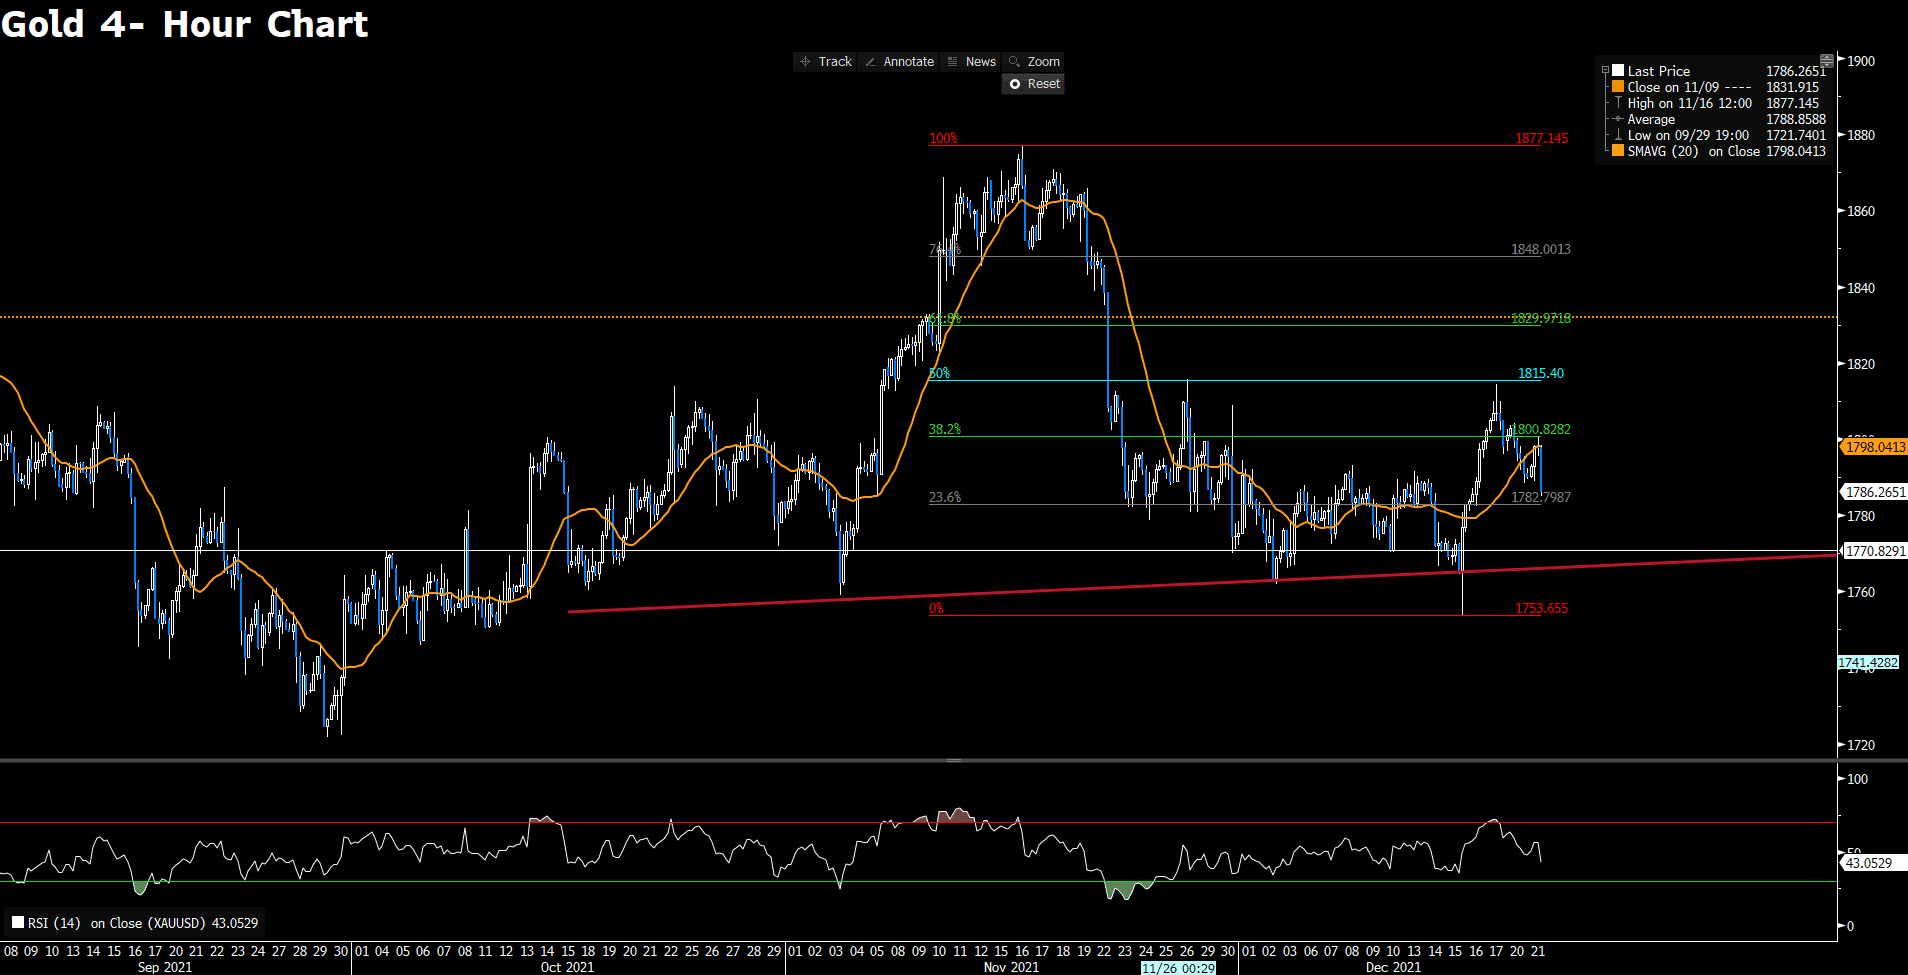
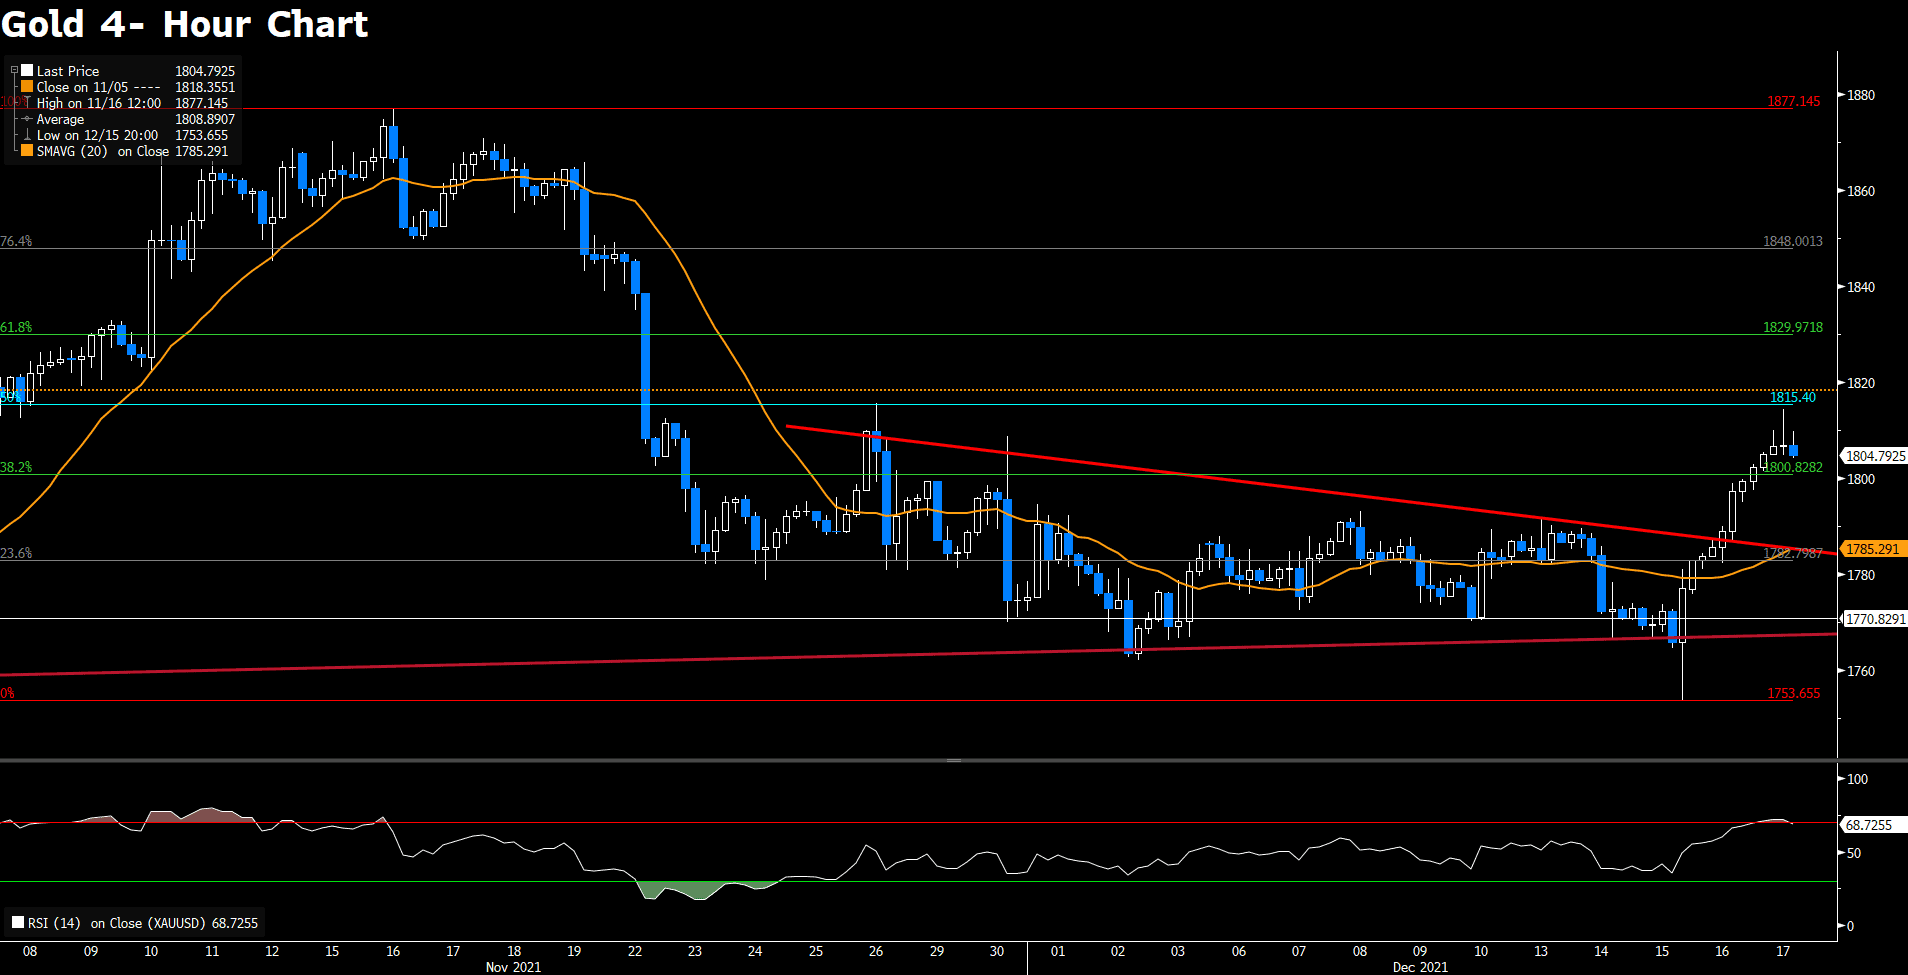
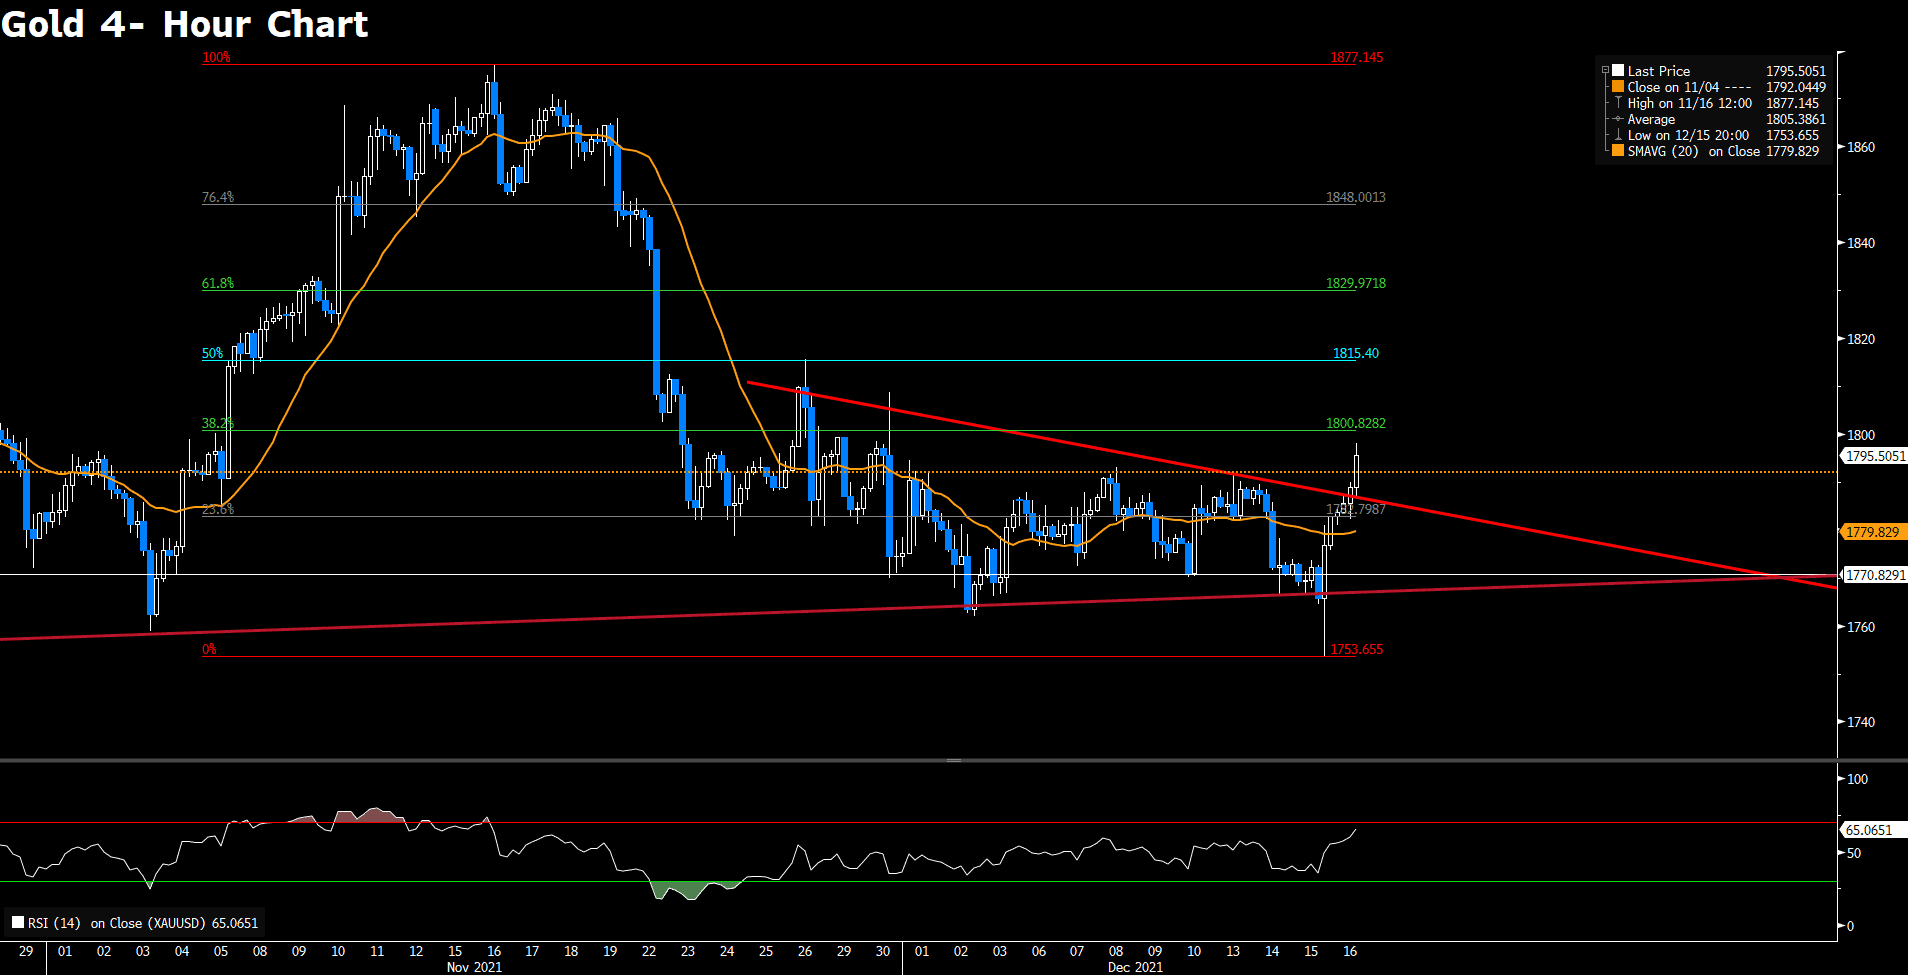
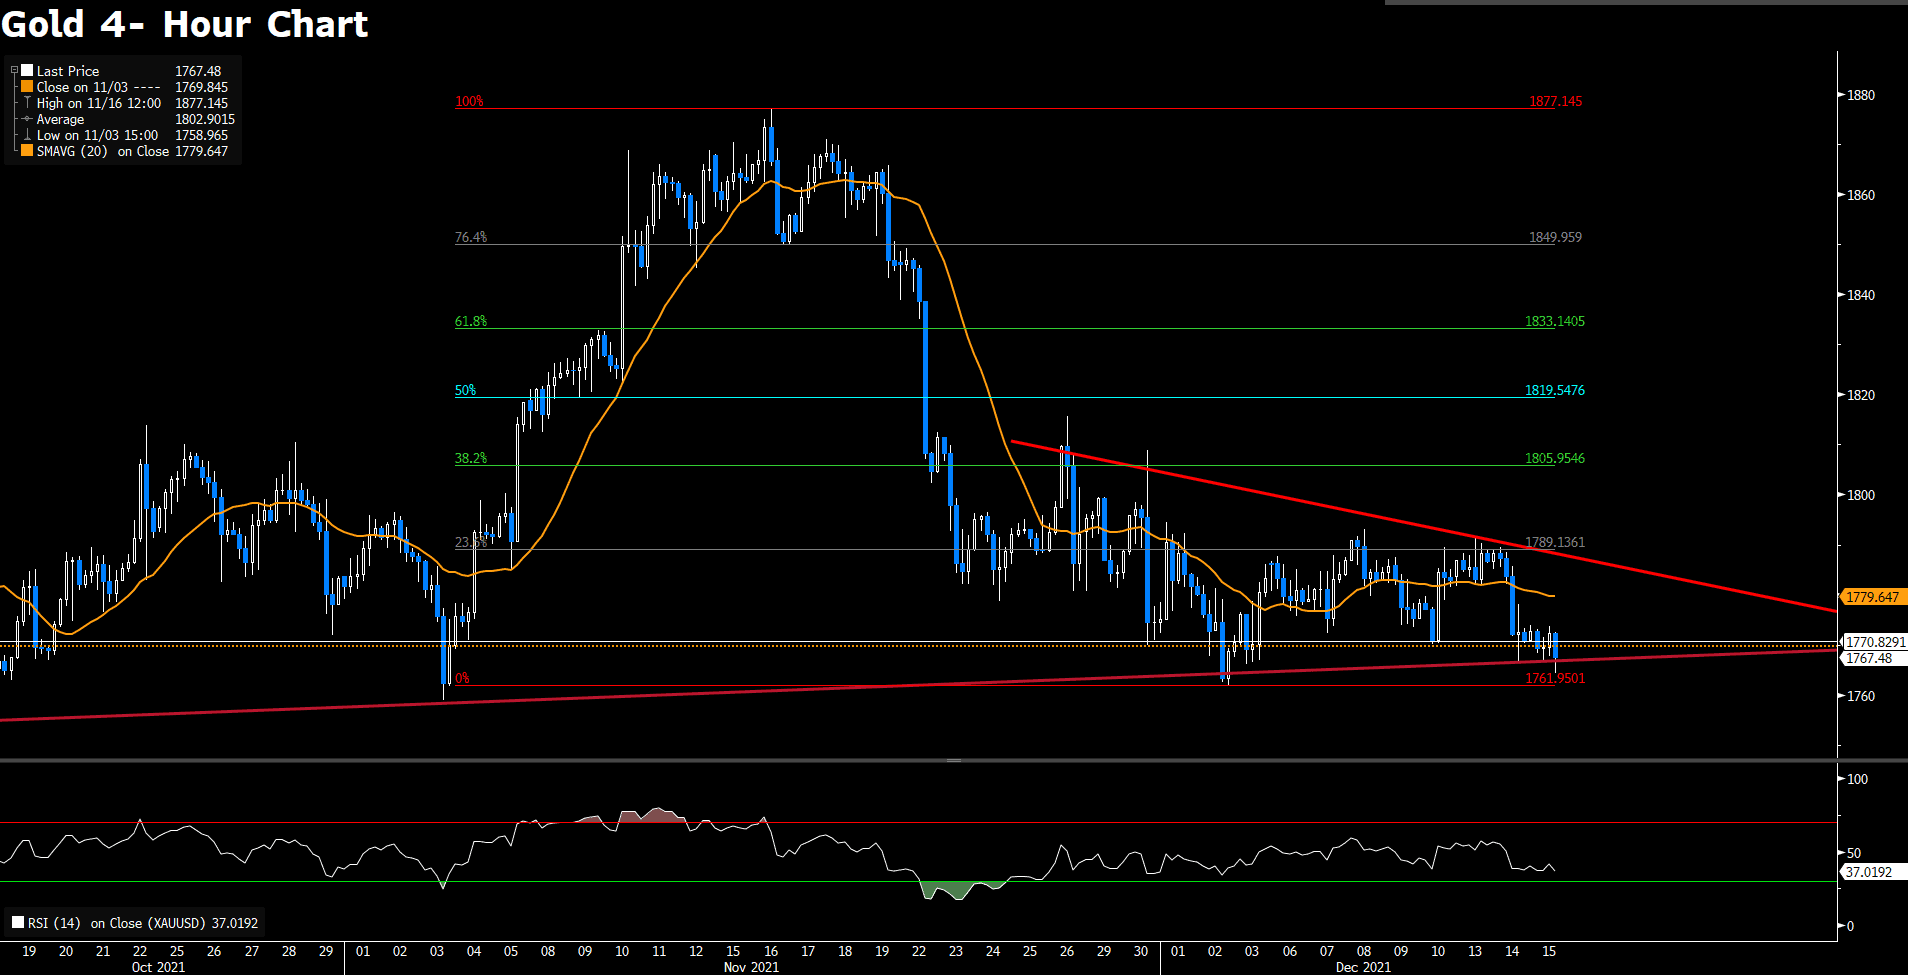
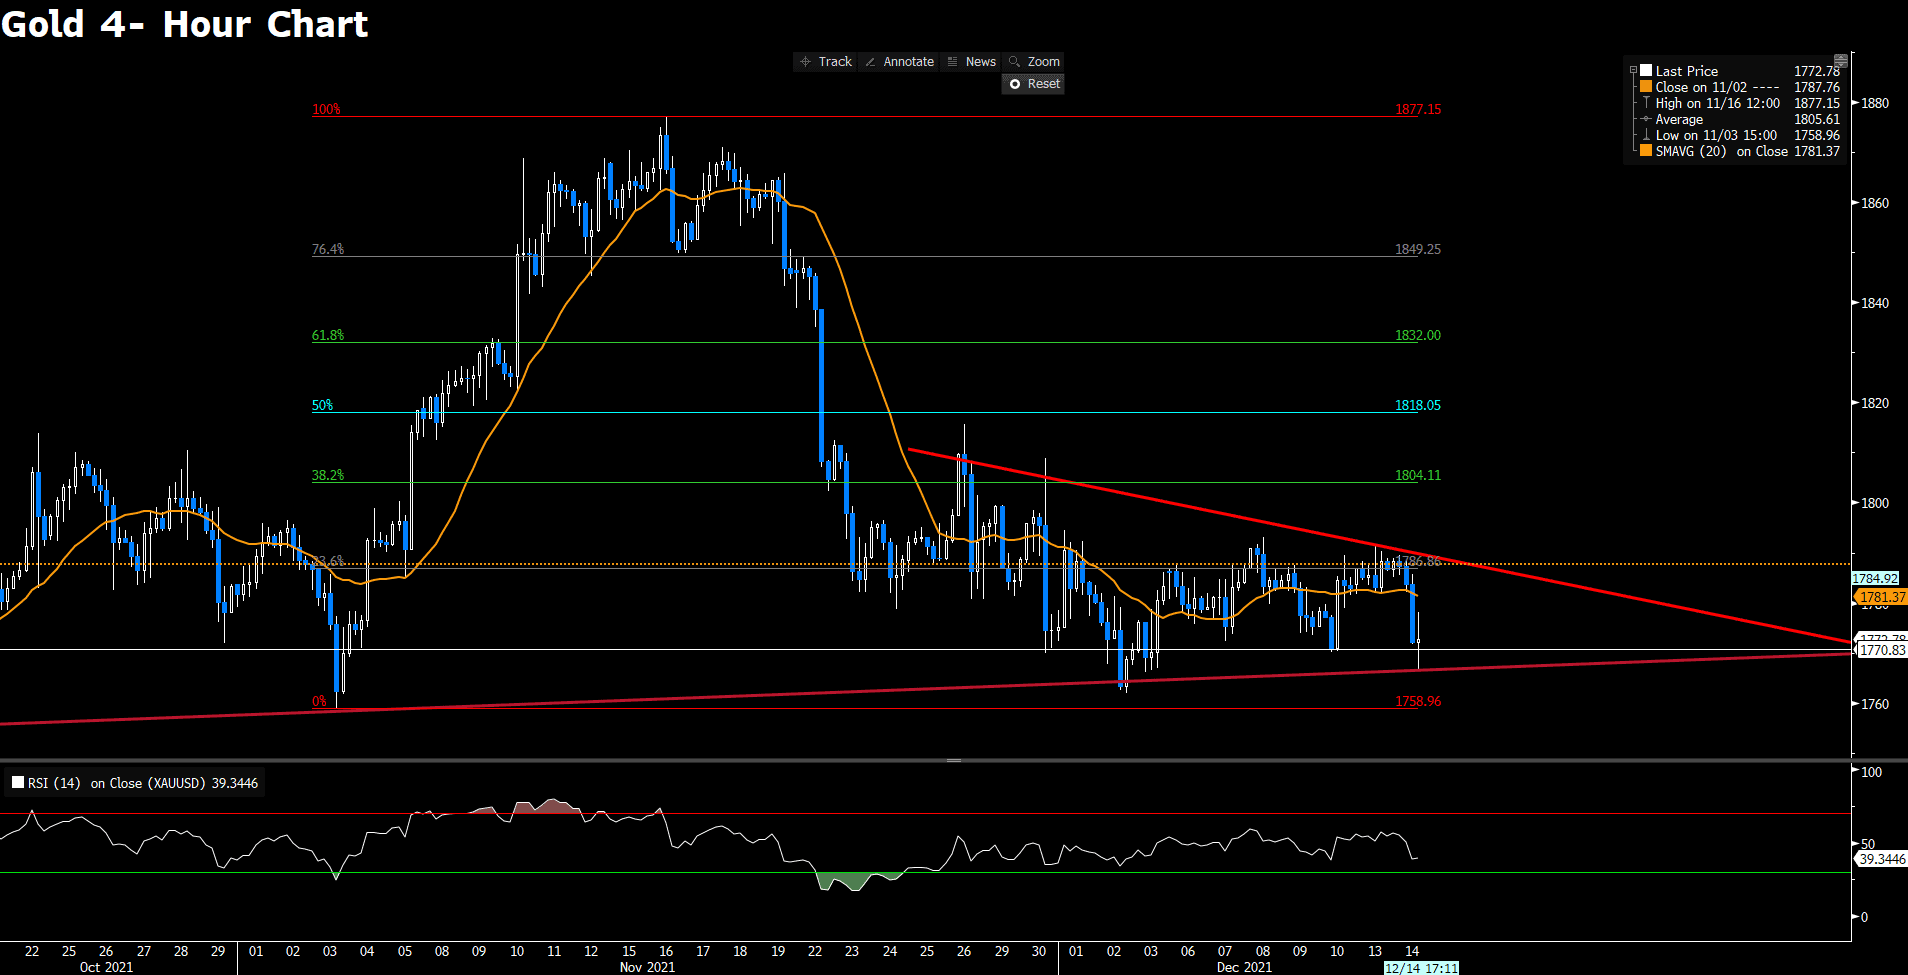
The precious metal, gold eases as the markets assess Omicron impact and the Fed’s plan on hiking rates. Fundamentally, gold is caught in a dilemma; although gold is considered a hedge against inflations, the Fed’s rate hikes at the same time increase the opportunity cost of holding non- yielding gold. As a result, it is expected to see a choppiness and consolidating trend for gold. From the technical perspective, gold becomes bearish in the near- term, trading at 1787, as it falls below the 20 SMA, suggesting that gold has turned weak against the US dollar. Gold is expected to consolidate within 1782 to 1800 range as the technical indicator RSI is neither in the overbought nor oversold territory, suggesting a directionless circumstance. On the upside, any subsequent move would face stiff and psychological resistance at 1800, followed by 1815. On the flip side, 1765- 1770 region seems to protect the immediate downside, followed by 1753.

Resistance: 1800, 1815, 1829

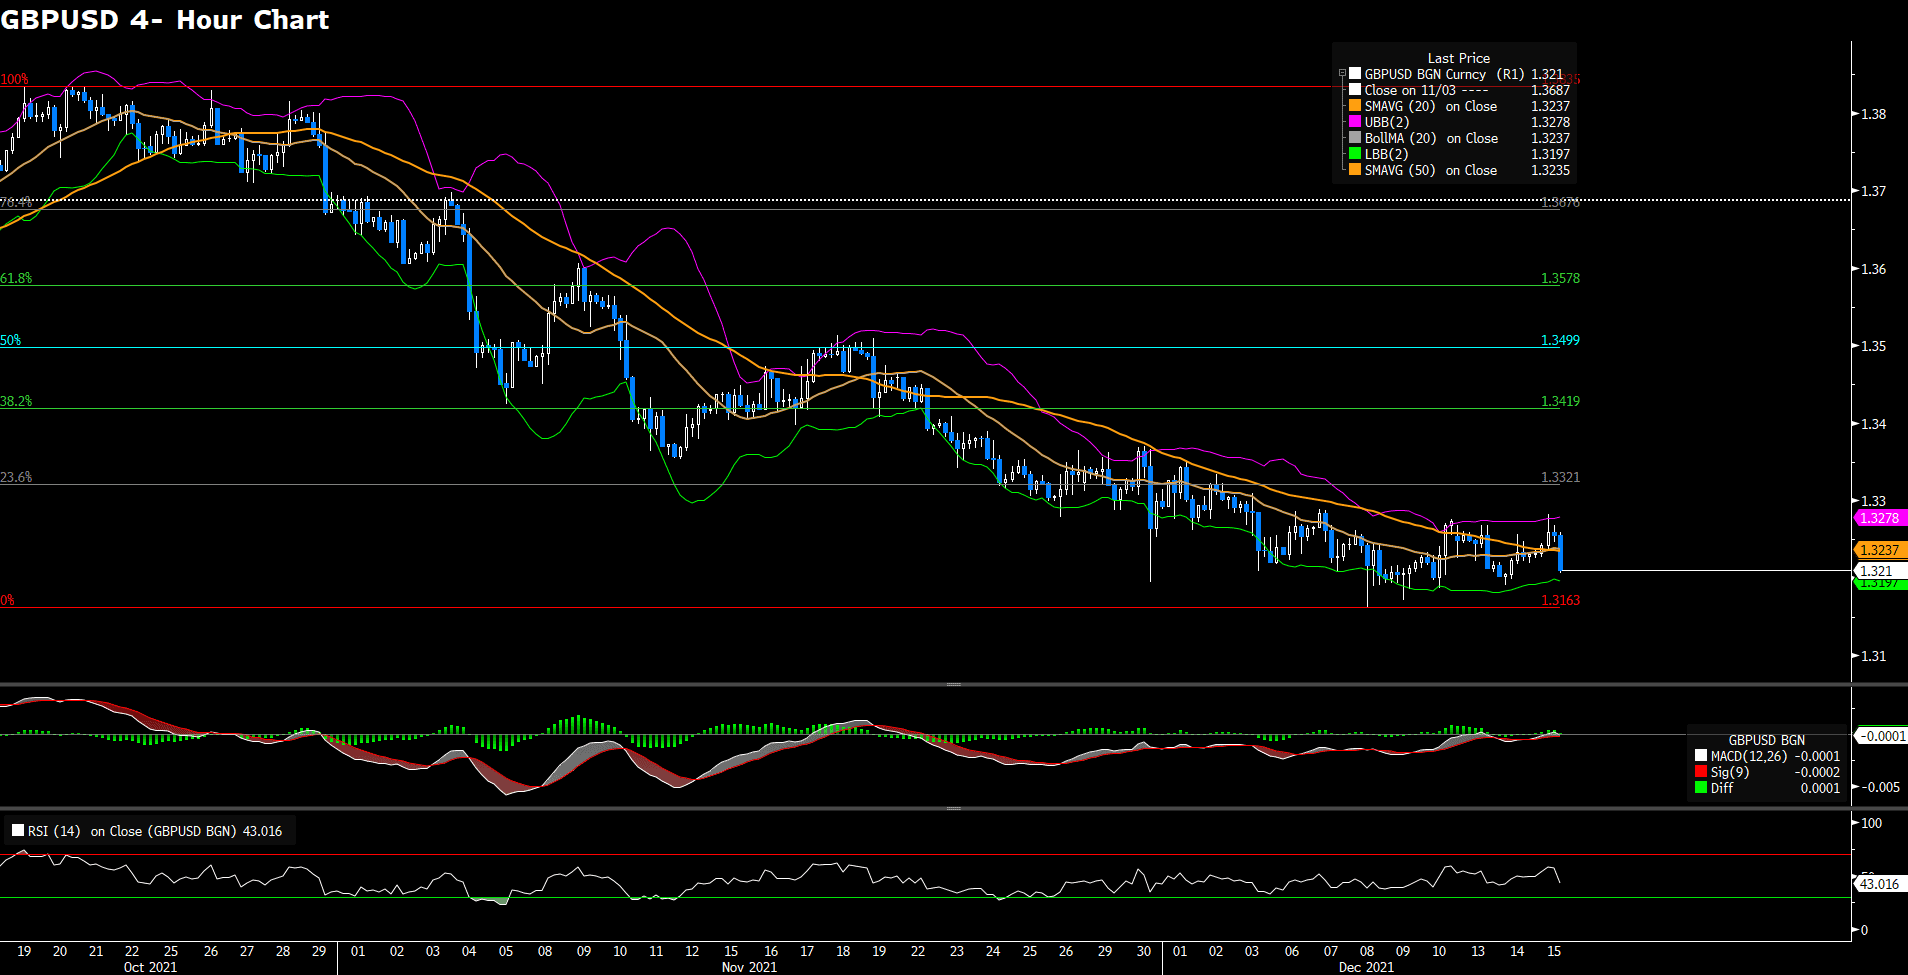
Support: 1782, 1770, 1765, 1753.


GBPUSD (4- Hour Chart)

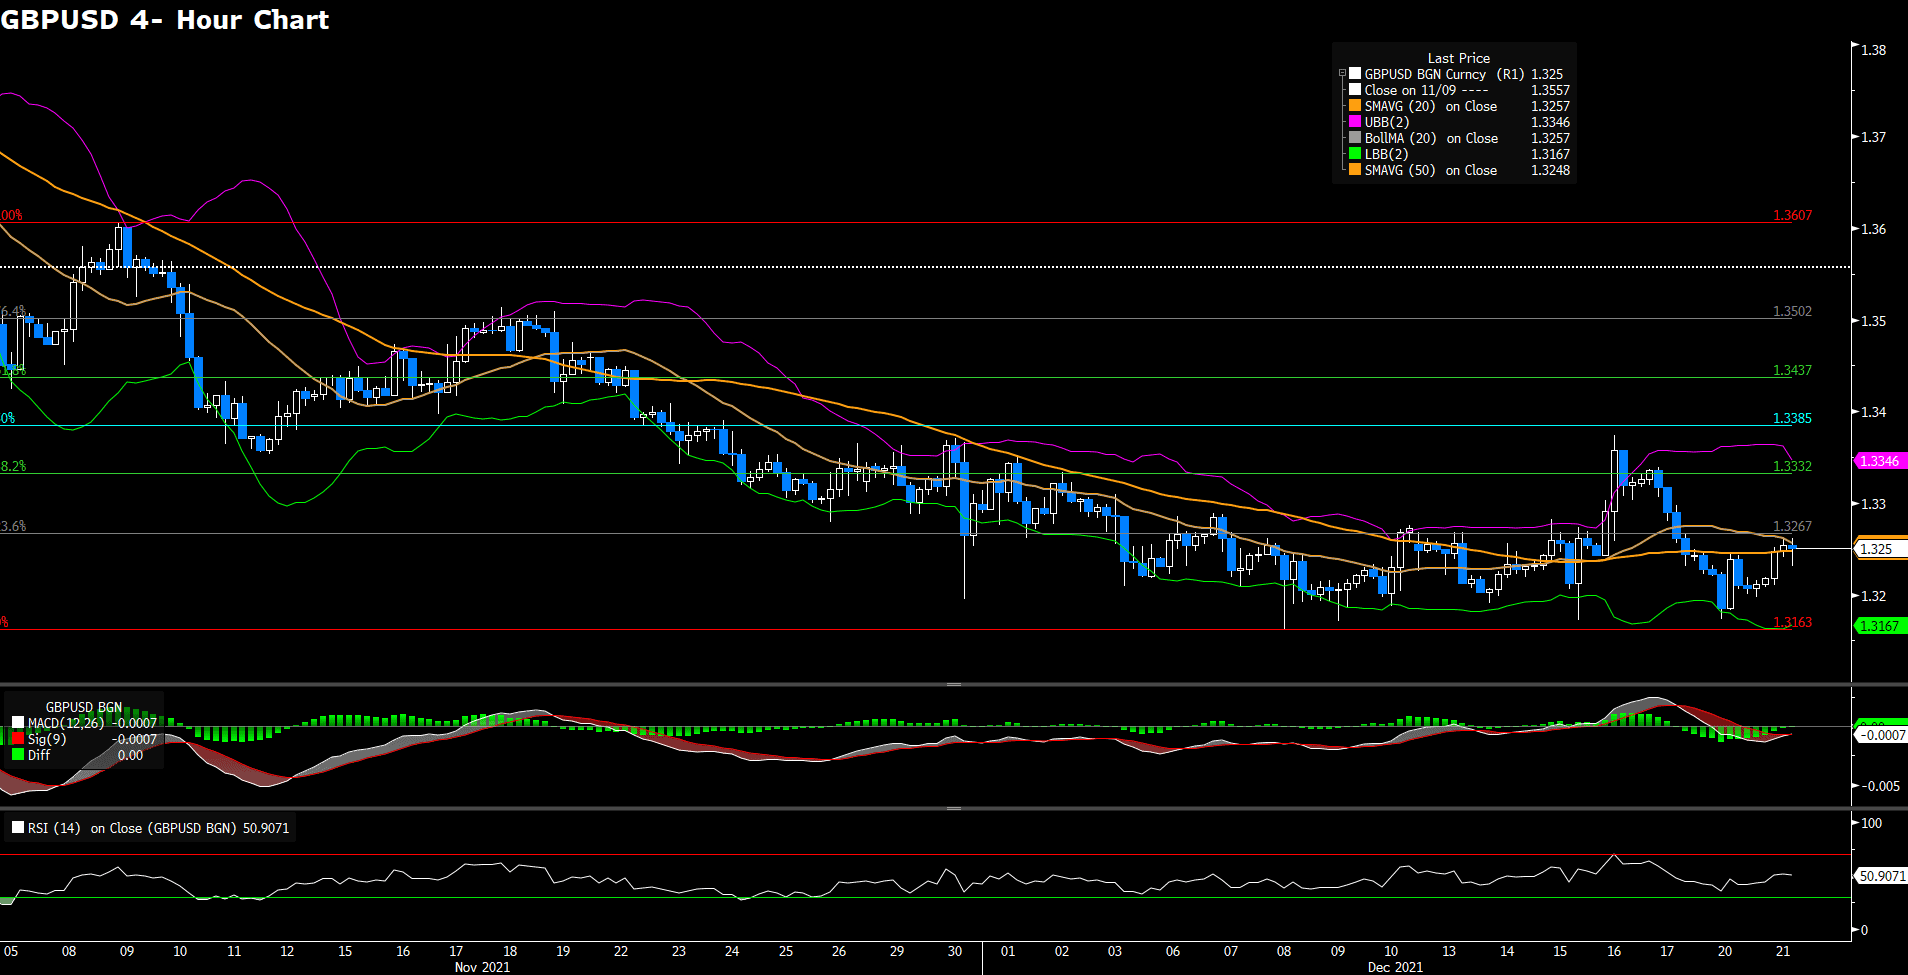
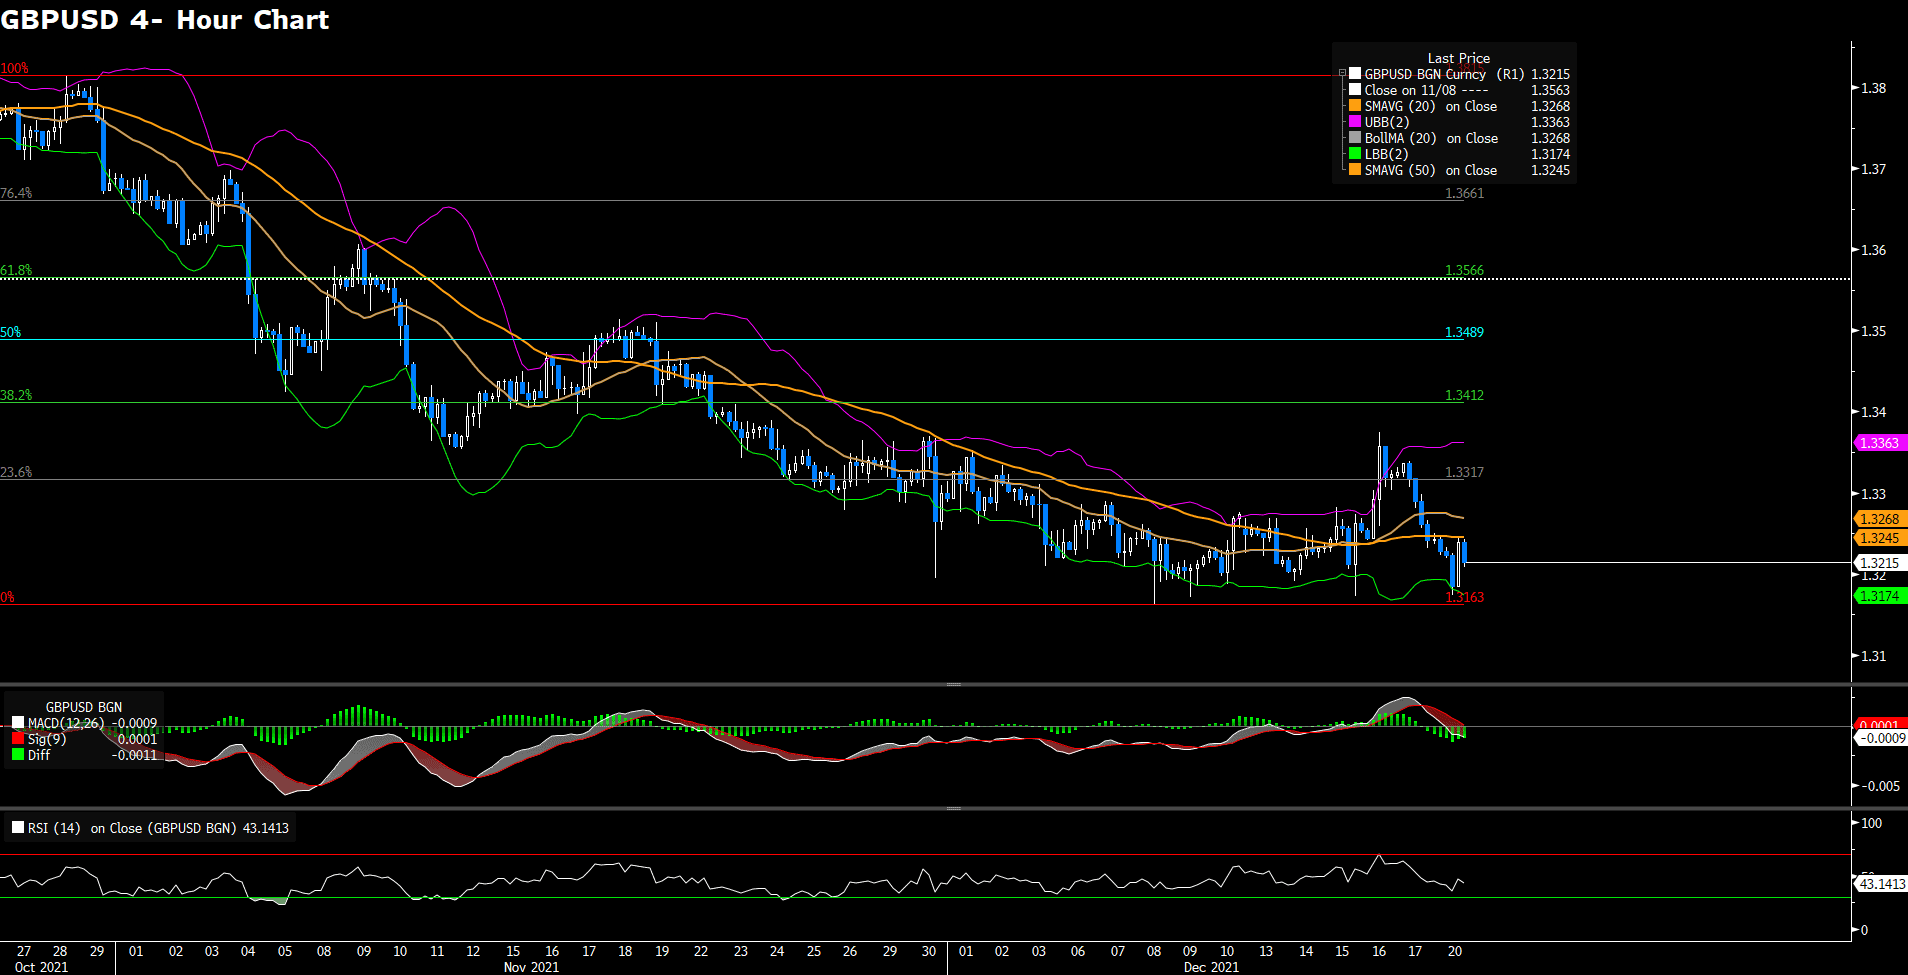
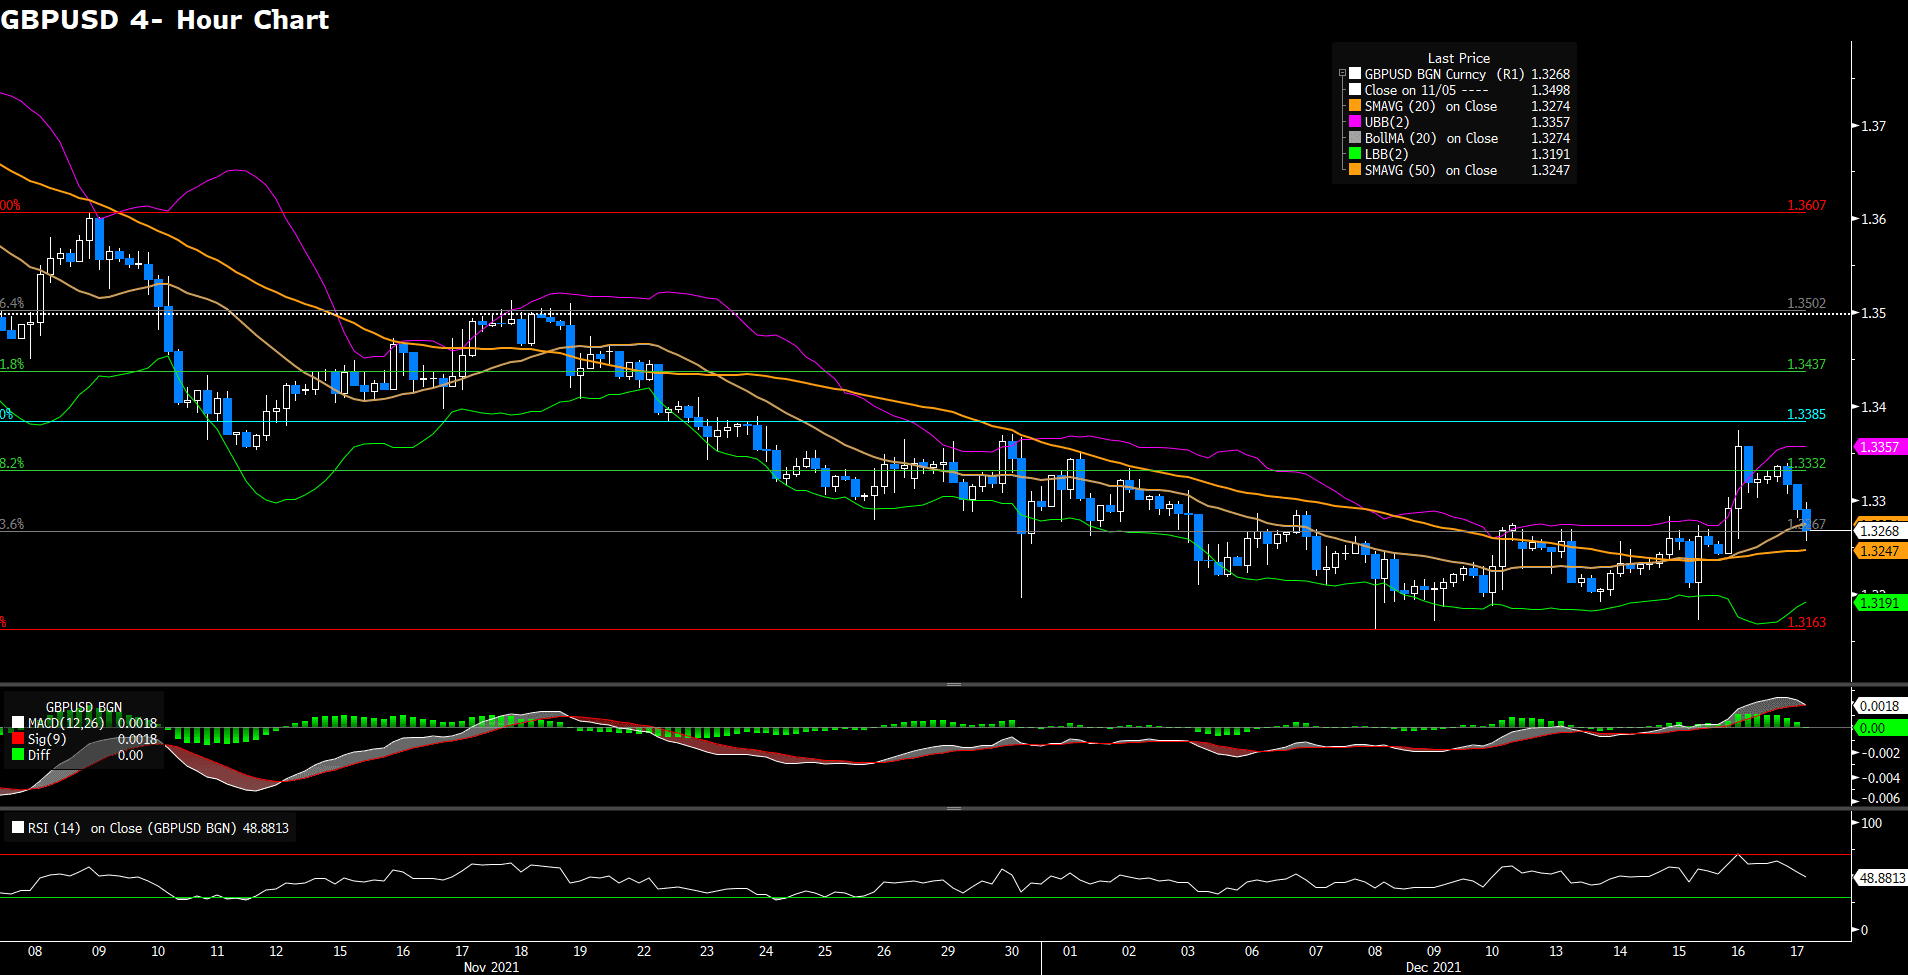
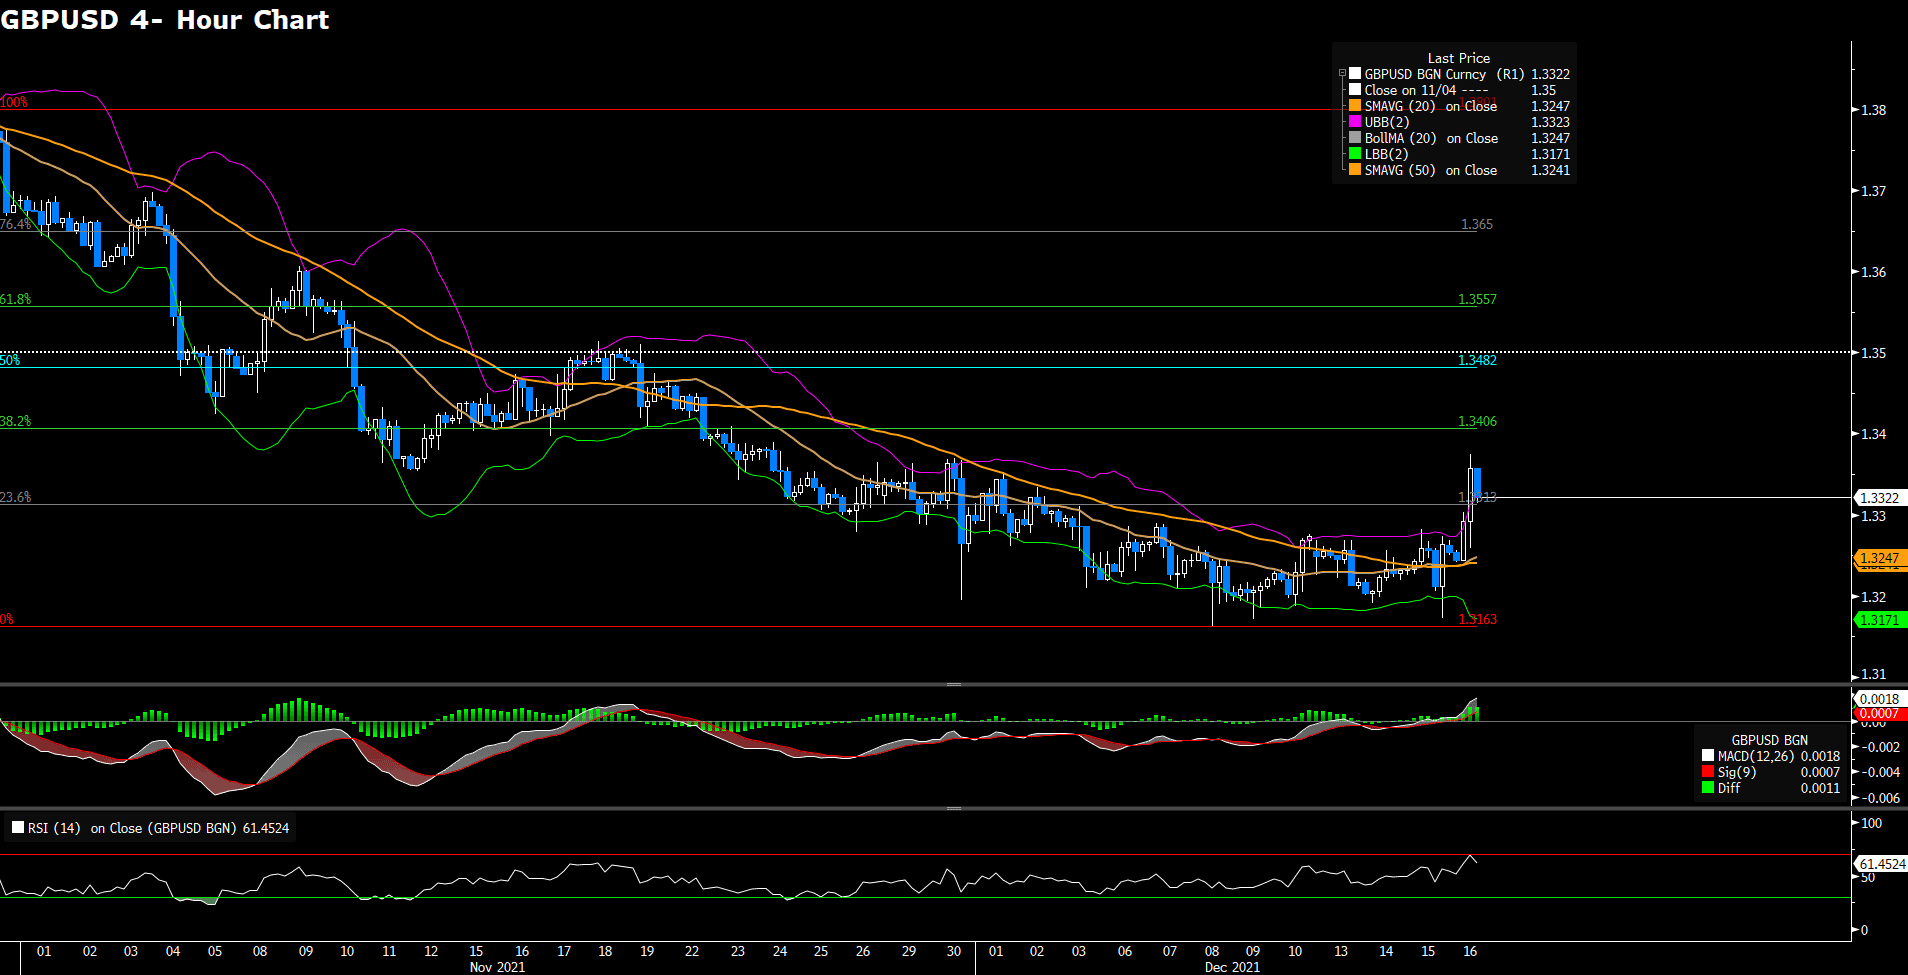
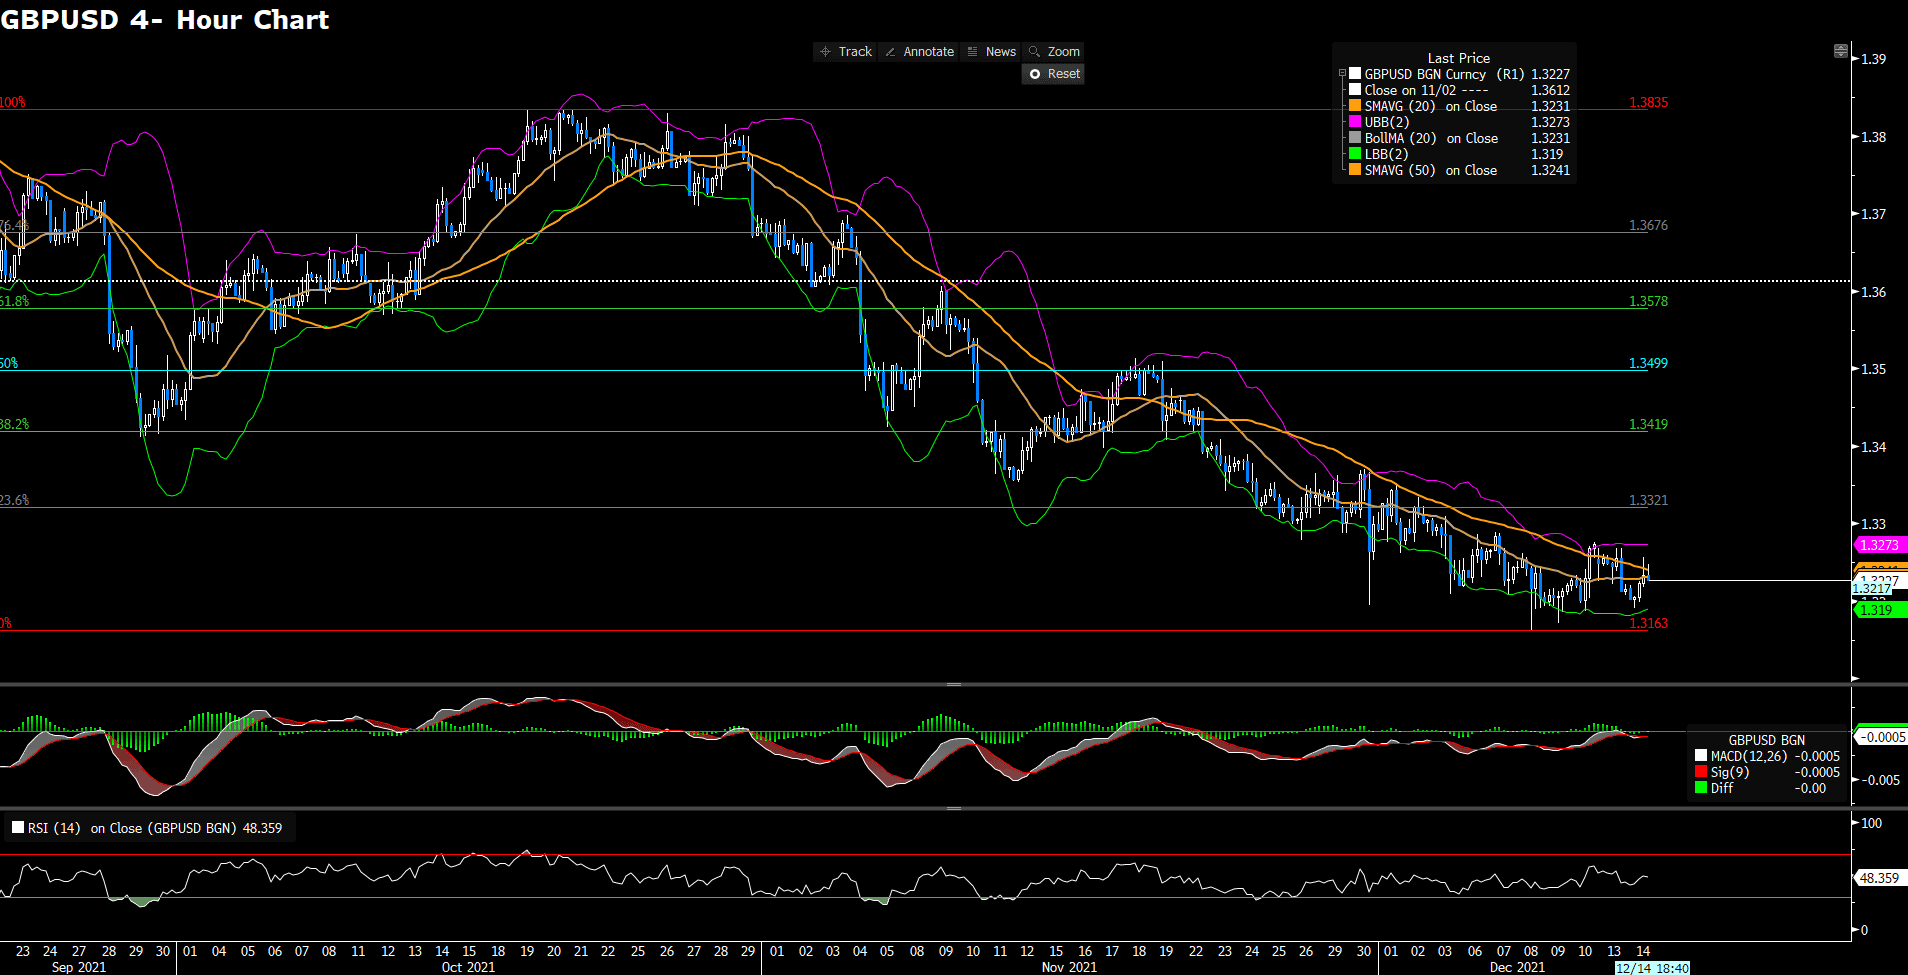
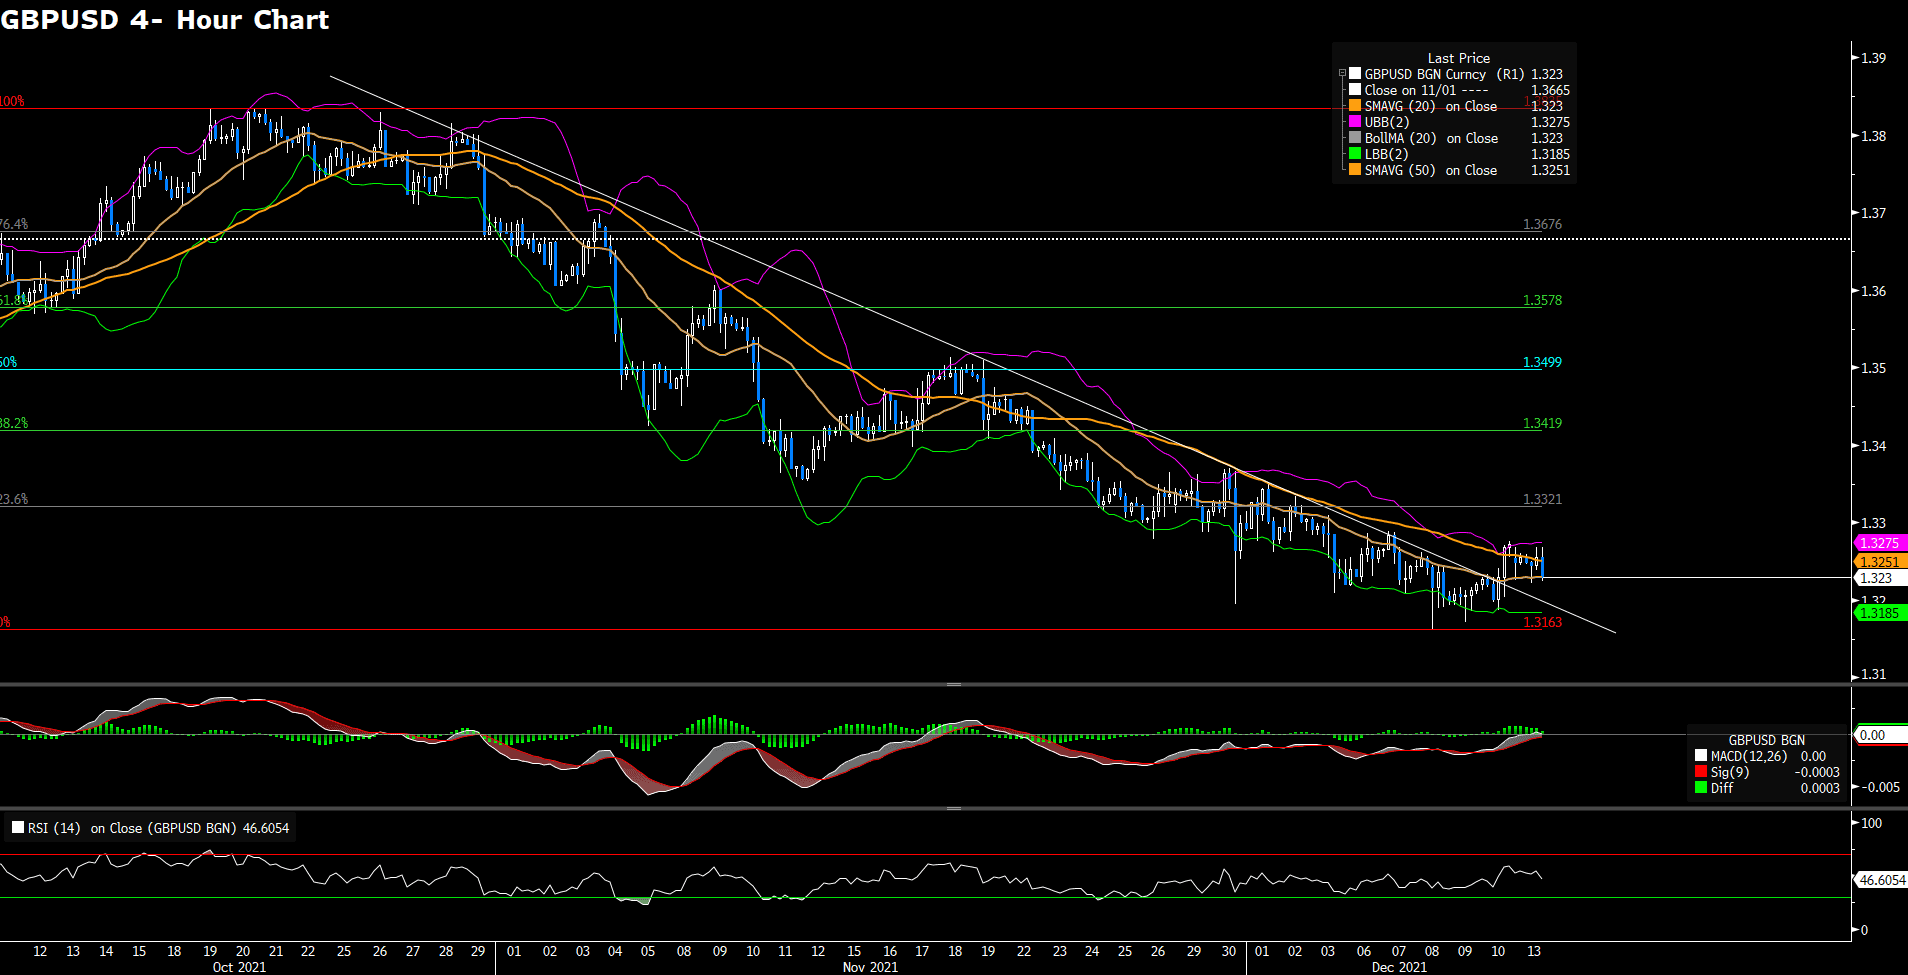
GBPUSD gains traction in the early US trading session on Brexit headline, currently trading at 1.3252. However, the markets’ focus remains on the likelihood of stricter Covid restriction amid the spread of Omicron. From the technical perspective, except the outbreak price action on last Friday, GBPUSD overall falls back, turning into a consolidation phase in the range from 1.3163 to 1.3267. From the near- term outlook, the currency pair remains bearish as it continues to trade below the 20 and 50 SMAs. In the meantime, the bears are supported by a negative MACD, lending aids to the bears, although the RSI is currently directionless. On the upside, GBPUSD needs to climb above its resistance 1.3267 in order to turn bullish in the near- term.

Resistance: 1.3321, 1.3419, 1.3499

Support: 1.3163


AUDUSD (4- Hour Chart)

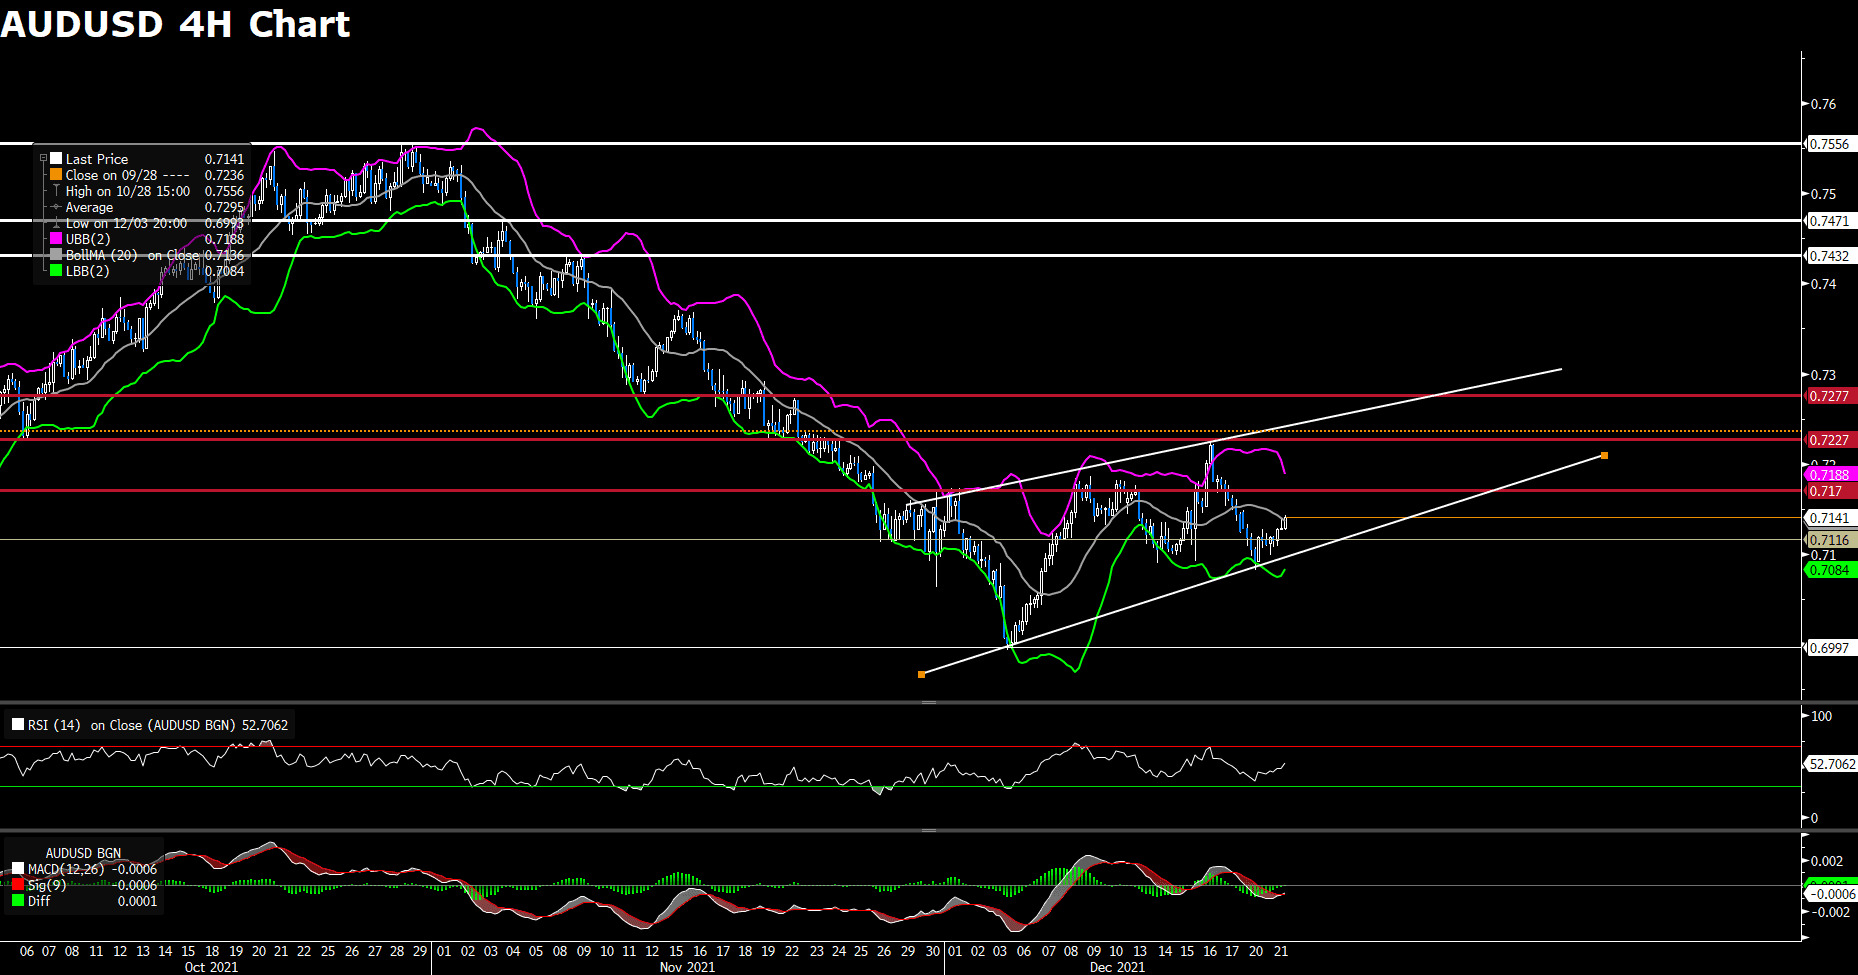
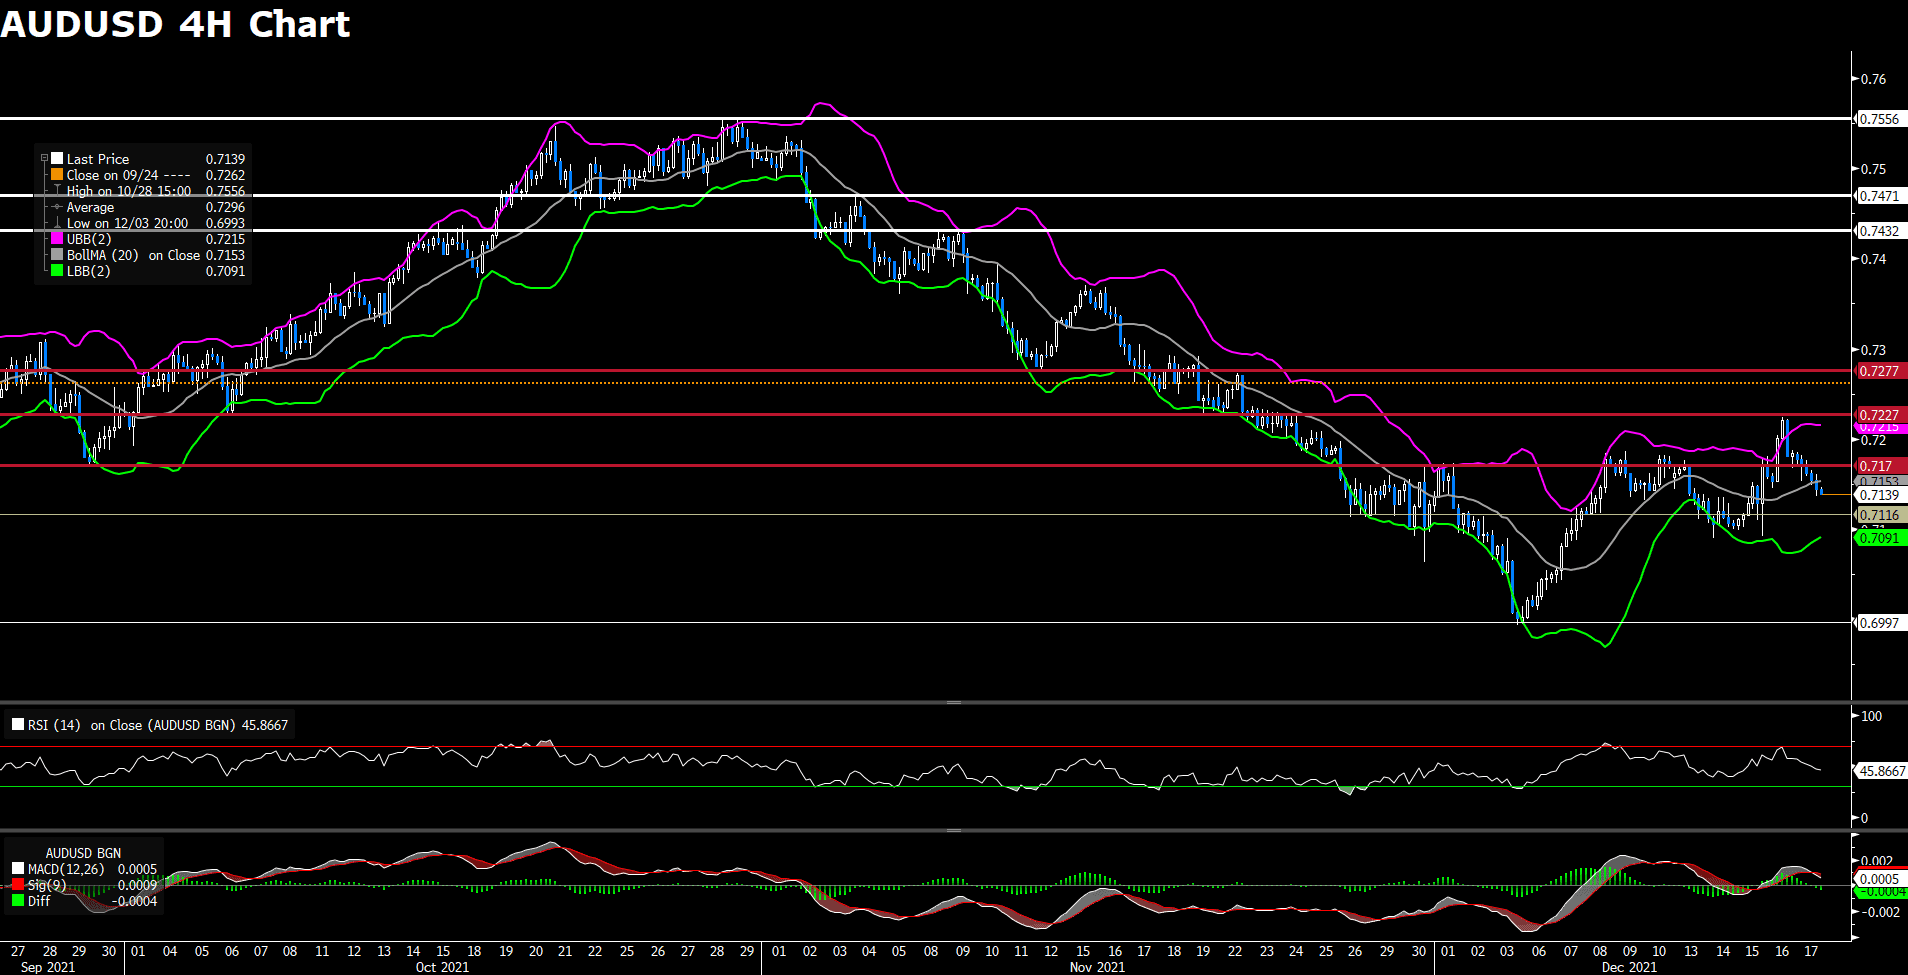
The RBA minutes seemed to deliver few surprise for the Aussie, and the markets preferably focus on the US data later this week. From the technical aspect, AUDUSD advances above the resistance at 0.7116, trading at 0.7142 as the time of writing. The four- hour outlook of the currency pair remains bullish as it continues to trade within the ascending channel. More importantly, both the MACD and RSI synchronously turn upside, meaning that buyers are taking the control. AUDUSD is expected to head toward 0.717, the immediate hurdle; if the pair successfully breaches the level, then it will re- confirm the bullish trend. On the flip side, AUDUSD needs to hold steadily above the ascending line in order to remain bullish.

Resistance: 0.717, 0.7227, 0.7277

Support: 0.6997


Economic Data

Currency

Data

Time (GMT + 8)

Forecast

GBP

GDP (YoY) (Q3)

15:00

6.6%

GBP

GDP (QoQ) (Q3)

15:00

1.3%

USD

GDP (QoQ) (Q3)

21:30

2.1%

USD

CB Consumer Confidence (Dec)

23:00

110.8

USD

Existing Home Sales (Nov)

23:00

6.52M

USD

Crude Oil Inventories

23:00

-2.633M

Market Focus

US stock declined on Monday amid downbeat market sentiment, making its biggest three-day drop since September as the concerns about the rapid spread of the Omicron variant in Europe dragged down stocks. After the Netherlands announced a full lockdown on Sunday, the UK is rumored to be planning a lockdown from 27 December and other countries are expected to follow suit straight after Christmas. Investors now worry that the US could end up in a same result when it comes to the pandemic. On top of that, US Democrat Senator Joe Manchin rejected Biden administration’s $1.75T Build Back Better (BBB) social spending package, which has dented confidence in US growth prospects and weighed negatively on the market mood. Meanwhile, the hawkish signals Fed that it might end asset purchases sooner than planned also acted as a headwind for the stock markets.

The benchmarks, S&P 500, Nasdaq 100 and the Dow Jones Industrial Average both dropped on Monday amid concerns about President Joe Biden’s economic agenda and the surging cases of the Omicron variant. S&P 500 was down 1.1% on a daily basis and the Nasdaq 100 also declined with a 1.1% loss for the day. Nine out of eleven sectors stayed in negative territory as the financials and materials sectors are the worst performing among all groups, losing 1.90% and 1.82%, respectively. The the Dow Jones Industrial Average dropped the most with 1.2% loss on Monday and the MSCI World index fell 1.4%. Moreover, the S&P 500 CBOE Volatility Index climbed back and touched two-week highs above 25.00 for the day due to the surge in selling.

一張含有 文字 的圖片

自動產生的描述

In Asia, China’s economy is dragged down by the slowdown in the nation’s property sector , as well as the regulatory crackdown on private industries from Beijing. Therefore, the surprise rate cut by the People’s Bank of China (PBOC) failed to support the Asia-Pacific shares.


Main Pairs Movement:

The US dollar edged lower on Monday, staying in negative territory amid falling US 10-year Treasury yield. The DXY index dropped to a daily low under 96.36 level during American session, then rebounded back moderately to pare some of its intraday’s losses. Goldman Sachs Group Inc. economists reduced US economic growth forecasts after US Democrat Senator Joe Manchin rejected Biden’s roughly $2 trillion tax-and-spending package. But the hawkish Fed and prospects that the US central bank policymakers expect three rate hikes by the end of 2022 will both limit the downside for the greenback.

GBP/USD declined 0.21% on Monday amid global concerns on the Omicron variant, as the UK reported 82,886 new coronavirus cases. The resign from Brexit UK’s top negotiator David Frost also weigh on the pair. The cable touched a daily top in late European session, then retreated back to surrender most of its intraday’s gain. Meanwhile, EUR/USD climbed to a daily top above 1.13 level and gained 0.34% for the day, as the euro has been the best performing G10 currency on Monday.

Gold declined and touched a daily low under $1788 in late American session. The recent weakness for the precious metal was mainly due to fears over the Omicron covid variant. Meanwhile, WTI oil tumbled 1.01% for the day, as the pressure on European countries to announce a lockdown will restrict near-term crude oil demand.


Technical Analysis:

XAUUSD (4- Hour Chart)

Gold is trading below 1800, struggling to make use of risk- averse market condition as major indices are tumbling amid Omicron fears. From the technical analysis, gold’s bulls are fighting against the critical level above the 20 SMA on the four- hour chart. On intraday basis, gold has failed to defend its support at 1800(38.2% Fib. Retracement.) If the next level, the 20 SMA, goes, gold is likely to slip back to test mid- December highs and the support at 1782, leading to a bearis trend. The technical indicator, the RSI, seems to favor the downside momentum more as the RSI is still far away from the oversold territory, giving rooms for gold to extend further south. On the flip side, in order to reclaim the bullish trend, gold would need to hold steadily above 1800.

Resistance: 1800, 1815, 1829

Support: 1782, 1770, 1753


GBPUSD (4- Hour Chart)

GBPUSD fails to recover above the 50 SMA in the early American trading session, trading at 1.3222. GBPUSD’s upside seems to be capped amid the rapid surge of the new Omicron cases in December, more than 140,000 cases got reported in London. From the technical perspective, GBPUSD continues to trade within the lower bounce of Bollinger Band, suggesting that the outlook remains downside in the near- term. In intraday trading, the 50 SMA becomes a barrier, followed by the resistance at 1.3317. On the downside, it is suggesting that the bearish momentum might continue as the RSI is still away from oversold, meaning that there are rooms for the pair to extend further south before it becomes technically oversold on the 4- hour chart. And the next relevant support located at 1.3163. On the flip side, GBPUSD needs to climb at least above the 20 and 50 SMAs in order to reclaim positive move.

Resistance: 1.3321, 1.3419, 1.3499

Support: 1.3163


Nasdaq 100 (Daily Chart)

The major indices, including Nasdaq 100, tumble on Monday as the market continues to react the resurgence of the Covid from the new variant Omicron. From the technical perspective, the Nasdaq extends further south for a three successive day. As the time of writing, today’s decline would bring the Nasdaq below its immediate support level at 15706, suggesting a bullish- to- bearish trend in the near- term. Furthermore, today’s bearish move would officially make the Nasdaq break all four SMAs, including the 5 SMA, 10, SMA, 20 SMA, and 60 SMA, indicating a negative mode for the index. In the meantime, the downside momentum is also supported by the negative MACD. As of now, in order to overturn its current stance, the index needs to climb at least 15706 to reclaim upside trend, and climb above all four SMAs to re- confirm a bullish stance. Nonetheless, from a bigger perspective, the bullish trend of the Nasdaq seems to be not over yet until it hits the overall up- trend. In the past, the up- trend most of the time acts as a strong support for a rebound after a big tumble for the Nasdaq.

Resistance: 15706, 16487

Support: 14457


Economic Data


Currency

Data

Time (GMT + 8)

Forecast

AUD

Mid-Year Economic and Fiscal Outlook

07:30

N/A

AUD

RBA Meeting Minutes

08:30

N/A

CAD

Core Retail Sales (MoM) (Oct)

21:30

1.5%


Market Focus

US stock declined on Friday amid downbeat market sentiment, dropping to two-weeks lows as traders and market participants weigh up this week’s main macro narratives, including the Fed’s hawkish pivot. The Fed and the European Central Bank both started to tighten their monetary policy, given the fact that they see inflation pressures as a higher priority than protecting output and employment from further pandemic fallout. More bad news for equity investors, the Fed might need to end its upcoming hiking cycle sooner, which suggest that the stock markets are due for a rougher patch and the economic growth could be at risk. Long-term US bond yields also fell on Friday, weighing on the appeal of cyclical stocks. On top of that, concerns about the spread of Covid-19 still remained, as New York reports over 20,000 cases in single-day record and caused a wave of school closings as well as business disruptions.

The benchmarks, S&P 500, Nasdaq 100 and the Dow Jones Industrial Average both dropped on Friday amid downbeat market mood and a perspective that Fed is about to speed up to end its asset purchases sooner than planned. S&P 500 was down 1.0% on a daily basis and the Nasdaq 100 declined with a 0.4% loss for the day. All eleven sectors stayed in negative territory as the energy and financial sectors are the worst performing among all groups, losing 2.27% and 2.24%, respectively. The the Dow Jones Industrial Average dropped the most with 1.5% loss on Friday and the MSCI World index fell 0.9%.

一張含有 文字 的圖片

自動產生的描述

In Asia, the focus in China is on the loan prime rate decision. A property sector crackdown has weighed on economic expansion and calls for a rate cut are now gaining momentum, despite the Chinese central bank’s benchmark hasn’t been cut since April 2020.


Main Pairs Movement:

The US dollar advanced on Friday, staying in positive territory amid risk-off market sentiment. The DXY index climbed to a daily top around 96.67 area near the end of the day, as the hawkish Fed and the renewed weakness in stock markets both pushed the greenback higher. The Federal Reserve Governor Christopher Waller said that rates could rise as early as March, following a decision to end asset purchases sooner than planned. Additionally, the Summary of Economic Projections, also known as SEP, also showed that the US central bank policymakers expect three rate hikes by the end of 2022, projecting the FFR at 0.90%.

GBP/USD declined 0.64% on Friday amid renewed US dollar strength, falling back to 1.330 area after the BoE surprised markets with a 15bps rate hike on Thursday. The cable touched a daily top in early European session, then retreated back to surrender most of its intraday’s gain. Meanwhile, EUR/USD dropped to a daily low under 1.124 level, losing 0.82% for the day.

Gold edged lower and touched a daily low around $1795 in late American session. The falling US stock market failed to pushed the precious metal higher, which dropped 0.06% on a daily basis. Meanwhile, WTI oil tumbled 2.18% for the day, as market’s risk appetite faded amid this week’s hawkish turn from many G10 central banks and a continued rise in Omicron cases across the world.


Technical Analysis:

XAUUSD (4- Hour Chart)

Gold rides higher on the hawkish central banks’ decisions, having taken out the psychological level at 1800. The renewed upside in gold price might get the stanta rally io. From the technical perspective, the intraday bias turns bullish on the 4- hour chart as gold has overcame the critical psychological resistance at 1800. If the latter is scaled, the gold will head toward its next immediate resistance at 1815; nonetheless, the upside momentum might be capped as the RSI indicator has reached the overbought territory, suggesting a pullback. Selling interest can begin accelerating once gold price falls below 1800 again, opening floors toward the previous descending wedge.

Resistance: 1815, 1829

Support: 1800, 1782, 1770, 1753


GBPUSD (4- Hour Chart)

GBPUSD erases most of the gain from yesterday after the BOE’s hawkish tone as the US dollar holds steadily above 96.00. From the technical analysis, GBPUSD looks to head back to a consolidation phase in the 1.3332- 1.3163 range. As the time of writing, GBPUSD is at a critical point, the intersection of the 20 SMA and the support at 1.3267; if the pair falls below the level, then it will turn downside in the near- term. From the technical indicator, the RSI looks to favor sellers while the MACD starts turning south side, suggesting that buyers side is less powerful. As a result, the currency pair might gradually shift to selling side.

Resistance: 1.3321, 1.3419, 1.3499

Support: 1.3267, 1.3163


AUDUSD (4- Hour Chart)

AUDUSD trims early gains from this week, trading at 0.7142 as the time of writing. The Australian dollar sees a downside as the markets appear to making the assumption that economic disruption in Australia will likely happen as the new variant Covid spreads more rapidly. From the technical aspect, the Aussie sees a turnaround after testing its monthly high around 0.7227. The outlook of the Aussie remains neutral as the pair seems to fall back to the consolidated phase, and the range is looking to fall within 0.717 and 0.7116. For the time being, the Aussie is expected to continue heading toward its immediate support at 0.7116 as the RSI is leaning down, suggesting that the sellers are more favorable; at the same time, the MACD becomes negative, giving the pair rooms to extend further south.

Resistance: 0.7170, 0.7227

Support: 0.7116, 0.6997


Economic Data

Currency

Data

Time (GMT + 8)

Forecast

AUD

Mid-Year Economic and Fiscal Outlook

08:30

N/A

CNY

PBoC Loan Prime Rate

09:30

N/A

Market Focus

The three indexes started to rise on Thursday and then fell back. Earlier, the Federal Reserve announced that it would speed up the end of stimulus measures and promote investors to shift to more economically sensitive industries. However, the decline in technology stocks hurt the Nasdaq index, S&P 500 index and Philadelphia Semiconductor index. Besides, The Bank of England made a surprising decision on Thursday, becoming the first major central bank to raise interest rates since the pandemic began, raising its benchmark interest rate from 0.10% to 0.25%. At the same time, the European Central Bank also stated on Thursday that it will further slow down asset purchases under its Pandemic Emergency Purchase Program (PEPP) in the first quarter of next year, and stop purchases in March. However, ECB President Christina Lagarde reiterated that the possibility of interest rate hikes in 2022 is still very small. Although the Fed has not taken any major moves recently, news of other central banks’ announcements of monetary policy tightening has made the market even more tense. At the end of the market, the Dow Jones Industrial Average declined 0.1% to 35,897.64 points, the S&P 500 index fell 0.9% to 4,668.67 and the Nasdaq Composite Index slumped 2.47%.

一張含有 文字 的圖片

自動產生的描述

Nine of the 11 major sectors of the S&P 500 index rose, led by economic financial stocks, energy and materials stocks, of which the financial stock index rose 1.21%. The Nasdaq Index is under pressure from a sharp decline in technology and other growth industries, Apple fell 3.93%, Amazon dropped 2.56% and Microsoft dropped 2.91%, moreover, Adobe Systems was also a big loser that day, with its stock price falling more than 10% after the software manufacturer’s 2022 fiscal year performance fell below Wall Street expectations.


Main Pairs Movement:

Following the Fed’s decision the day before to accelerate the reduction of asset purchases and the announcement of three times interest rate hikes in 2022, the Swiss National Bank, the Bank of England and the European Central Bank have successively announced monetary policy decisions.

The Bank of England’s monetary policy unexpectedly raised the benchmark interest rate to 0.25% and maintained the quantitative easing amount at £895.

The European Central Bank announced a cautious reduction in scale, which is basically in line with market expectations. The European Central Bank kept interest rates unchanged and confirmed that the pandemic emergency purchase plan will end in March 2022.

The EUR/USD closed at the 1.13298 level, and finally broke through the 1.13000 level, and even reached the 1.1360 level. The GBP/USD closed at 1.33200, and rose to the level of 1.33743 when the Bank of England unexpectedly announced an interest rate hike.

Gold has the best performance, rising for the second day in a row, and closed is close to 1800 level. Crude oil prices also rose up, and WTI is currently trading at approximately $71.96 per barrel.


Technical Analysis:

XAUUSD (4- Hour Chart)

Gold advances to monthly highs near 1800 during the American trading session after the ECB announced that it will further cut its bond purchases but continue its unprecedented monetary policy support; more importantly, the ECB decides to leave the interest rates unchanged at 0%. From the technical perspective, the outlook of gold turns bullish on the 4- hour chart since it has officially breached the bearish wedge; meanwhile, gold has kept its sustained strength above the 20 simple moving averages, suggesting a near- term appreciating price action. On the upside, gold is going to test the immediate psychological resistance at 1800; this level would be considered as critical as the RSI is nearly at the overbought territory; that being said, the upside momentum might be reduced. On the flip side, any meaningful pullback below the bearish wedge and 1782 will be seen as a fresh trigger for bearish trades.

Resistance: 1800, 1815, 1829

Support: 1782, 1770, 1753


GBPUSD (4- Hour Chart)

GBPUSD advances to its highest level in December after the BOE announced that it is going to raise its policy rate to 0.25%; The BOE became the first major bank to raise interest rates since the pandemics. From the technical aspect, a hawkish BOE opens the door for additional upside momentum for the pound, challenging the immediate hurdle at 1.3313. The near- term outlook turns slightly bullish as the currency pair trades above the 20 and 50 simple moving averages on the 4- hour chart. However, the rally seems to run out of steam ahead of 1.3406 as the RSI has reached above 61st mark as the time of writing. On the upside, the positive price action is still supported by a firm positive MACD. On the contrary, the relevant support is at 1.3163.

Resistance: 1.3321, 1.3419, 1.3499

Support: 1.3163


EURUSD (4- Hour Chart)

EURUSD trims most of the gain from the ECB’S confirmation of ending the PEPP in March 2022, currently trading at 1.1309. From the technical perspective, the outlook of the currency pair remains neutral stance, although it trades with substantial strength intraday, testing the immediate barrier at 1.1357. Failing to breach 1.1357 level discourages the buyers for further price action. In order to reclaim a bullish stance, EURUSD needs to climb above the resistance. As the time of writing, both technical indicators, the RSI and MACD head firmly higher within positive levels, reflecting persistent buying interest. On the contrary, if EURUSD falls below the simple moving averages, it will turn slightly bearish in the near- term, possibly testing its support at 1.1233.

Resistance: 1.1357, 1.1462, 1.1548

Support: 1.1233, 1.1186


Economic Data

Currency

Data

Time (GMT + 8)

Forecast

JPY

BoJ Monetary Policy Statement

10:30

N/A

JPY

BoJ Press Conference

10:30

N/A

GBP

Retail Sales (MoM) (Nov)

15:00

0.8%

EUR

German Ifo Business Climate Index (Dec)

17:00

95.3

EUR

CPI (YoY) (Nov)

18:00

4.9%

RUB

Interest Rate Decision (Dec)

18:30

8.50%

VT Markets The Adjustment Of Weekly Dividend Notification

Dear Client,

Warmly reminds you that the component stocks in the stock index spot generate dividends. When dividends are distributed, VT Markets will make dividends and deductions for the clients who hold the trading products after the close of the day before the ex-dividend date.

Indices dividends will not be paid/charged as an inclusion along with the swap component. It will be executed separately through a balance statement directly to your trading account, the comment for which will be in the following format “Div & Product Name & Net Volume ” .

Please note the specific adjustments as follows:

Note: The above data is for reference only, the actual execution data may be changed, please refer to the MT4/MT5 software for details.

If you’d like more information, please don’t hesitate to contact [email protected].

Market Focus

After the Federal Reserve announced that it will accelerate the reduction of monthly asset purchases in the context of rising inflation, three indices hit theirs best gain in a week on Wednesday. The Fed stated that it will increase its bond purchases by $30 billion per month in January, which is twice the $15 billion per month announced in November. The timetable for raising interest rates is advanced. It is expected that the interest rate will be raised up to three times next year, and then three more in 2023, bringing the Fed’s benchmark interest rate to 1.6%. The risk sentiment has improved after the statement was announced, because before the Fed meeting, the sentiment of monetary policy tightening was tense, and the previous increase has been basically digested. At the end of the market, the Dow Jones Industrial Average rose 1.1% to 35,927.44 points, the S&P 500 index rose 1.63% to 4,709.85 and the Nasdaq Composite Index added 2.1%.

一張含有 文字 的圖片

自動產生的描述

In the S&P 500 sector, the only loser is the energy sector. The main reason is that people are still worried about oversupply, although people are still worried about Omicron’s threat to travel and energy demand, making energy still under pressure and oil prices still falling. Devon Energy, Occidental Petroleum and Diamondback Energy fell more than 2%. On the other hand, the biggest winner of the index sector is undoubtedly the technology sector related to interest rates. With interest rates unchanged, the technology sector led to a rocket up. Nvidia and AMD lead the technology sector, followed by Alphabet, Microsoft, Facebook and Apple, contributing to the index’s performance.


Main Pairs Movement:

Before the Fed’s monetary policy decision was released, market participants expected that monetary policy would be tightened and accompanied by nervousness. This caused the DXY to soar to almost annual highs, but then interest rates remained unchanged, and the only news is that they will speed up the reduction in bond purchases starting in January 2022, so the dollar index turned south and closed at 96.33.

The EUR/USD is close to the 1.1300 level, but it was still below that level before the European Central Bank meeting, which will be held on Thursday. The ECB will announce its monetary policy decision, but the market is generally expected to maintain the current policy, this means the euro is hardly to get extra impetus.

GBP/USD closed at 1.32582, also staying at recent levels without any breakthrough. The UK will announce its PMI later on Thursday, which may provide some strength for the pound.

Gold hit a new low of 1,752 in several months and then rebounded to around $1,778 per ounce. Crude oil prices have risen with the stock market, and WTI is currently trading at approximately $71.50 per barrel.


Technical Analysis:

XAUUSD (4- Hour Chart)

Gold price struggles to rebound, hovering below 1770, as focus shifts to FOMC meeting. Gold price is undermined since the market expects the hawkisk Fed will pace its tapering and the interest rates. From the technical analysis, as the time of writing, gold bears now target the descending wedge around 1765. Gold will re- confirm a bearish outlook if the wedge is breached downwardly. Alternatively, the recovery now needs to face stiff resistance at 1770, followed by 1789, in order to turn a bearish- to- bullish trend on the 4- hour chart. However, it looks like bears are still in control as the RSI indicator has not reached the oversold territory, suggesting a continuation of selling pressures. And the next relevant support is at 1761.

Resistance: 1770, 1789, 1805

Support: 1761


GBPUSD (4- Hour Chart)

GBPUSD declined toward 1.3200 after the soaring UK inflation report, resulting in a renewal of the US dollar demand. From the technical perspective, the outlook of the currency pair becomes bearish on the 4- hour char as it trades below its 20 and 50 simple moving averages, indicating a bearish condition in the near- term. Since the RSI has not yet reached the oversold condition, sellers are still in control; thus, GBPUSD is expected to head toward its immediate support at 1.3163. Furthermore, the MACD is also turning negative as the time of writing, meaning that the pair has essentially turned from buying to selling. On the upside, GBPUSD’s bulls need to climb above the static level at 1.3321 to reclaim positive move. More price action will eye on today’s FOMC meeting and tomorrow’s ECB meeting.

Resistance: 1.3321, 1.3419, 1.3499

Support: 1.3163


EURUSD (4- Hour Chart)

EURUSD declines merely trading at 1.1250 as the US dollar’s momentum picks up. From the technical aspect, EURUSD looks to test its immediate support at 1.1233, followed by 1.1186. The outlook remains neutral in the near- term as the technical indicator, RSI, lacks directional strength, steadily holding slightly below 50th mark. The support level at 1.1233 could be breached with the US Fed’s announcement later; if that is the case, EURUSD will become bearish in the near- term. On the upside, the currency pair needs to extend further north above the acceptance level at 1.1357 in order to turn upside.

Resistance: 1.1357, 1.1462, 1.1548

Support: 1.1233, 1.1186


Economic Data

Currency

Data

Time (GMT + 8)

Forecast

USD

FOMC Economic Projections

03:00

N/A

USD

FOMC Statement

03:00

N/A

USD

Fed Interest Rate Decision

03:00

0.25%

USD

FOMC Press Conference

03:00

N/A

NZD

GDP(Q3) YoY

05:45

-4.5%

GBP

Composite PMI

17:30

57.6

GBP

Manufacturing PMI

17:30

58.1

GBP

Services PMI

17:30

58.5

EUR

ECB Monetary Policy Statement

20:45

N/A

EUR

ECB Interest Rate Decision (Dec)

20:45

N/A

USD

Building Permits (Nov)

21:30

1.663M

USD

Initial Jobless Claims

21:30

200K

USD

Philadelphia Fed Manufacturing Index (Dec)

21:30

30

VT Markets Notification of trading adjustment in holiday

Dear Client,

Please note the adjustment on following products due to international holiday in December:

The above time is MT4/5 server time. The trading time of other products is not affected. The above data may be subject to change. Please refer to the actual time on MT4/5.

If you have any questions, our team will be happy to answer your questions.
Please mail to [email protected] or contact the service online.

VT Markets New Product launch

Dear Client,

To provide our clients with a wealth of trading options, VT Markets will launch new CFDs on Index Futures on Dec 20th, 2021.

Kindly reminder that HK50ft will rollover firstly on Dec 29th, 2021.

The specifications of the new products as shown in the table below.

The above data is for reference only, please refer to the MT4/MT5 software for specific data.

Please check our official page to get more detail about
Forex: https://www.vtmarkets.com/trading/markets/indices/

Please contact [email protected] if you would like more information regarding to this.

Market Focus

US stock declined on Tuesday amid downbeat market sentiment, as pressures increased on the Federal Reserve to tighten monetary conditions in a faster than expected pace. The headline US Producer Price Index (PPI) released on Tuesday rose at an annual pace of 9.6% in November, which is more than market’s expectation of 9.2%. The surging US PPI and CPI data weighed on the equity market as investors worried that this could make the Fed to act more aggressively, despite the officials have give no signs that they would rush up to tighten monetary policy. On top of that, concerns about the spread of new Omicron variant still remained as the UK reported one death related to the newly discovered variant. Investors now await the critical Federal Reserve monetary policy decision on Wednesday, which might provide some clues on the pace of bond tapering and interest rate hikes.

The benchmarks, S&P 500, Nasdaq 100 and the Dow Jones Industrial Average both dropped on Tuesday amid downbeat market mood and a perspective that relief that Fed is about to end the cycle of easy money. S&P 500 was down 0.7% on a daily basis and the Dow Jones Industrial Average declined with a 0.3% loss for the day. Ten out of eleven sectors stayed in negative territory as the information technology and real estate sectors are the worst performing among all groups, losing 1.64% and 1.27%, respectively. The Nasdaq 100 dropped the most with 1.0% loss on Tuesday and the VIX rose almost 12%, as investors started to move their investments from stocks to other asset.

一張含有 文字 的圖片

自動產生的描述

In Asia, China will release Industrial Output for November and retail sales data, which are expected to show slower economic activity due to a real-estate recession and falling consumption. Meanwhile, Chinese property developer shares and bonds plunged to the lowest since early 2017.


Main Pairs Movement:

The US dollar advanced on Tuesday , staying in positive territory amid risk-off market sentiment. The DXY index dropped to a daily low under 96.15 in mid-European session, but then started to see heavy buying and rebounded towards 96.5 level. The higher yields and weaker stocks both lend support to the greenback, which rose 0.21% on a daily basis. Investors now expect the Fed to tighten its monetary policies in a faster pace due to higher PPI and CPI data.

GBP/USD advanced 0.10% on Tuesday amid upbeat UK jod data, as the number of people claiming unemployment-related benefits declined by 49.8K in November. The cable touched a daily top in late European session, then retreated back to surrender some of its intraday’s gain. Meanwhile, EUR/USD dropped to a weekly low under 1.126 area, losing 0.21% for the day.

Gold slipped and touched a daily low around $1766 amid renewed US dollar strength. The falling US stock market failed to pushed the precious metal higher, which dropped 0.87% on a daily basis. Meanwhile, WTI oil tumbled 1.16% for the day, as more countries reimpose restrictions to avoid an Omicron variant outbreak. The rising Covid-19 cases and the downbeat market mood both acted as a headwind for the black gold.


Technical Analysis:

XAUUSD (4- Hour Chart)

The precious metal, gold, slipped to fresh daily low below 1780 after the annual PPI surged to 9.6% in November. The sell- off mainly came from the market’s reaction as a high inflation might quicken the pace of the US Fed’s QE taper as well as hikes in the interest rates. From the technical perspective, gold continues to trade in a subdued manner within 1786- 1770 ranges. In the near term, the outlook of gold looks bearish as it trades below the 20 SMA, and heading to test its support at 1770. For now, any further rallies below 1770 will confirm a sell as if gold penetrates the level, it will at the same time break the descending wedge. More price action is likely to be in place after Wednesday’s FOMC policy announcement.

Resistance: 1786, 1804, 1818

Support: 1770, 1758


GBPUSD (4- Hour Chart)

GBPUSD stays in the positive territory neat 1.3230 on Tuesday as the US dollar has a difficult time to find the demand after the release of PPI report. However, the pound’s demand is at the same time at stake as the Omicron infections in the UK looks worse than expected. As a result, further price action eyes on Wednesday’s FOMC announcement. From the technical aspect, despite the recent rebound, the outlook of the currency pair continues to remain bearish as it still trades below the 20 and 50 SMAs on the four- hour chart. In the meantime, the RSI is neither in the oversold nor overbought territory, punctuating the lack of upside strength. On the upside, GBPUSD needs to at least trade above the SMAs to reclaim bullish momentum in the near- term. Trading above the resistance at 1.3321 will re- confirm a bearish- to- bullish trend.

Resistance: 1.3321, 1.3419, 1.3499

Support: 1.3163


EURUSD (4- Hour Chart)

EURUSD trades near its weekly low at 1.1269 amid the advances in the US government bond yields. The focus remains on Wednesday’s US Fed decision and Tuesday’s the ECB meeting. From the technical analysis, EURUSD continues to seesaw within 1.1233- 1.1357 range. On the four- hour chart, the outlook remains bearish as the pair continues to trade below the 20 and 50 Simple Moving Averages; in the meantime, it trades within the lower bounce of Bollinger Band. The RSI indicator remains neutral, suggesting a directionless situation. On the upside, EURUSD needs to trade above 1.1357 in order to begin another bullish trend; the pair might extend further gain p to 1.1462 if it successfully breaches the immediate resistance at 1.1357.

Resistance: 1.1357, 1.1462, 1.1548

Support: 1.1186


Economic Data

Currency

Data

Time (GMT + 8)

Forecast

NZD

RBNZ Gov Orr Speaks

03:00

N/A

CNY

Industrial Production (YoY) (Nov)

10:00

3.6%

GBP

CPI (YoY) (Nov)

15:00

4.7%

USD

Core Retail Sales (MoM) (Nov)

21:30

0.9%

USD

Retail Sales (MoM) (Nov)

21:30

0.8%

CAD

Core CPI (MoM) (Nov)

21:30

N/A

USD

Crude Oil Inventories

23:30

-2.600M

Market Focus

US stocks fell on Monday due to concerns about the Omicron coronavirus variant before the Federal Reserve meeting later this week. The decline was mainly concentrated in the oil and gas, consumer services and technology sectors. At the end of the market, the Dow Jones Industrial Average lost 0.89% to 35,650.96 points, the S&P 500 index lost 0.91% to 4,668.98 and the Nasdaq Composite Index, dropped 1.39%.

一張含有 文字 的圖片

自動產生的描述

Seven of the 11 major sectors of the S&P 500 fell, with only defensive stocks such as real estate, utilities, consumer staples and healthcare rising. Travel-related stocks fell because the fast-spreading Omicron accounted for about 40% of COVID-19 infections in London, and at least one person died in the UK. On the other hand, the best-performing stock in the Dow Jones Industrial Average was Coca-Cola Company, which rose 2.63%, Walmart rose 1.80% and Johnson & Johnson rose 1.79% in late trading. The worst performing stock was Boeing, which fell 3.74%, the Dow fell 2.49% and the Home Depot fell 2.45%. In addition, the best performing company in the Nasdaq Composite Index was SeaChange International Inc, which rose 128.81%, Arena Pharmaceuticals Inc soared 80.38% after Pfizer agreed to acquire a $6.7 billion all-cash transaction, Pfizer also rose 5.3%, and Foghorn Therapeutics Inc rose 54.96%. The worst performers were Nisun International Enterprise Development Group Co Ltd, which fell 60.29%, X4 Pharmaceuticals Inc fell 44.13%, and IGM Biosciences Incclose fell 41.31%.


Main Pairs Movement:

The three most important central banks in the world will hold their last monetary policy meeting in 2021, which will exacerbate weak sentiment. The Federal Reserve will announce its monetary policy decisions on Wednesday, while the Bank of England and the European Central Bank will announce their monetary policy decisions on Thursday. Concerns about how the ongoing Omicron epidemic might affect such decisions and global economic growth continue. At the same time, the UK reported its first death related to the Omicron variant, which stimulated market risk aversion.

In the US Treasury market, the 10-year long-term Treasury bond yields fell, and the 20-year and 30-year Treasury yields fell 7-8 basis points to close at 1.414%, 1.84% and 1.80%, respectively.

The EUR/USD hovered below 1.1300, while the GBP/USD fell to the 1.3200 area. Due to the slight decline in U.S. stocks, commodity-related currencies faced selling pressure and rebounded slightly before the close. The AUD/USD fell by 0.54%, and the USD/CAD rose by 0.62%. The safe-haven currencies Swiss franc and Japanese yen changed little against the U.S. dollar each day, and both fell 0.19% against the greenback.

Gold rose 0.21% and hovered at $1786 per ounce area, while WTI oil dropped 1.08% to $71.16 per barrel.


Technical Analysis:

BTCUSD (Daily Chart)

On Monday, 90% of Bitcoin have been mined according to the tracker from Blockchain.com. That being said, 90% of the coin are on the open market. From the technical aspect, Bitcoin falls back from $50,132, a 1.41% rise on Sunday. Bitcoin starts the week by re- testing the support pivot again at $46,510. On the daily chart, Bitcoin needs to move back through $55,103 to initiate the first bullish momentum into play. Failure to move back though the immediate resistance would continue to make Bitcoin downside. If the support at $46,510 cannot hold, then Bitcoin will head toward the next support at $39,566. However, it looks like that the bearish momentum is being weakened as the RSI remains oversold condition, due for a bounce back.

Resistance: 55,103, 58,000, 68,991

Support: 46,510, 39,566, 32,621


GBPUSD (4- Hour Chart)

GBPUSD edges higher on Monday as the US dollar struggles to preserve its strength to start the week. From the technical perspective, the outlook of the pair turns upside in the near term as it has breached the descending trendline and is trading above the 50 moving averages. However, the upside momentum seems lack of strength as the currency continues to consolidate in the range from 1.3321 to 1.3163. Moreover, the RSI indicator has hovered around the midline, suggesting that buyers and sellers show less interest in the pair for the time being. On the downside, if the pair falls below the bearish trendline, then it will turn bearish in the near- term and head toward 1.3163. Current resistance awaits at 1.3163 while supports are located at 1.3321, followed by 1.3419.

Resistance: 1.3321, 1.3419, 1.3499

Support: 1.3163


EURUSD (4- Hour Chart)

EURUSD rebounds toward 1.1300 to start the new week as the decline of the US bonds makes it difficult for the US dollar to outperform its rival currencies. From the technical perspective, the 4- hour outlook hints that the bullish momentum is still being limited as EURUSD continues to develop below the simple moving averages, currently hovering below the 20 and 50 SMAs. In the meantime, EURUSD keeps trading within the lower bounce of Bollinger Band after bottoming at 1.1259. It is expected to see the pair consolidate below the moving averages as the RSI is currently neutral, hovering around the midline; furthermore, the MACD is flat, neither supporting buyers nor sellers. Further movements of the pair will eye on Tuesday’s US PPI report.

Resistance: 1.1357, 1.1462, 1.1548

Support: 1.1186


Economic Data

Currency

Data

Time (GMT + 8)

Forecast

GBP

Average Earnings Index +Bonus (Oct)

15:00

4.6%

GBP

Claimant Count Change (Nov)

15:00

N/A

BRL

BCB Copom Meeting Minutes

19:00

N/A

USD

PPI (MoM) (Nov)

21:30

0.5%

Back To Top
server

Hello there 👋

How can I help you?

Chat with our team instantly

Live Chat

Start a live conversation through...

  • Telegram
    hold On hold
  • Coming Soon...

Hello there 👋

How can I help you?

telegram

Scan the QR code with your smartphone to start a chat with us, or click here.

Don’t have the Telegram App or Desktop installed? Use Web Telegram instead.

QR code