Market Focus
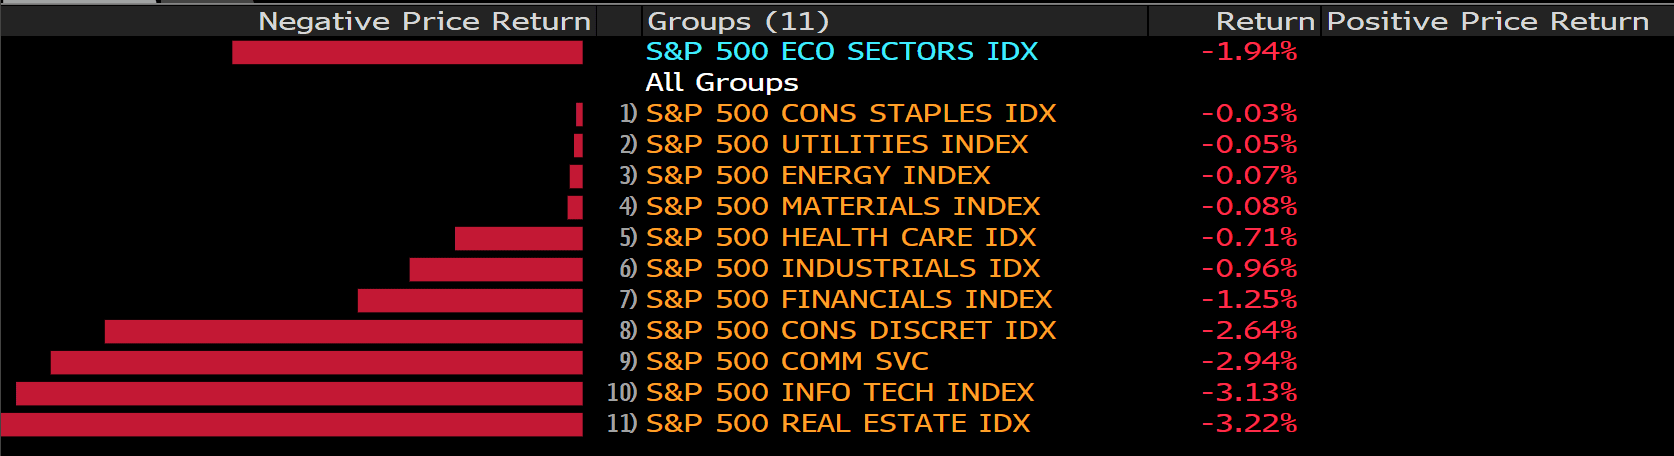
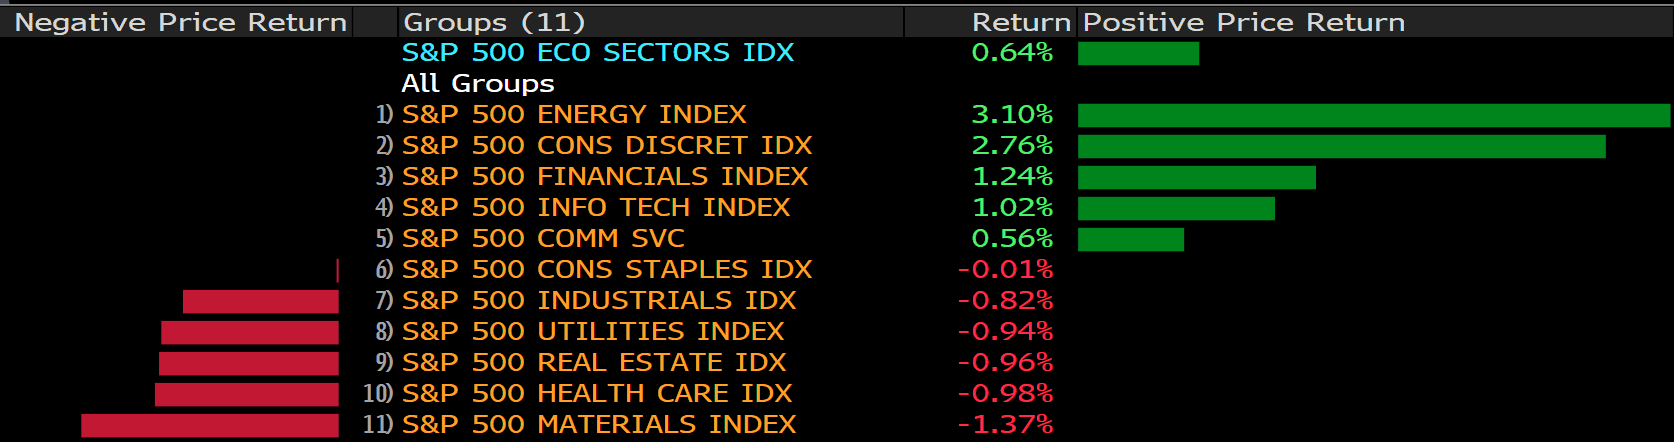
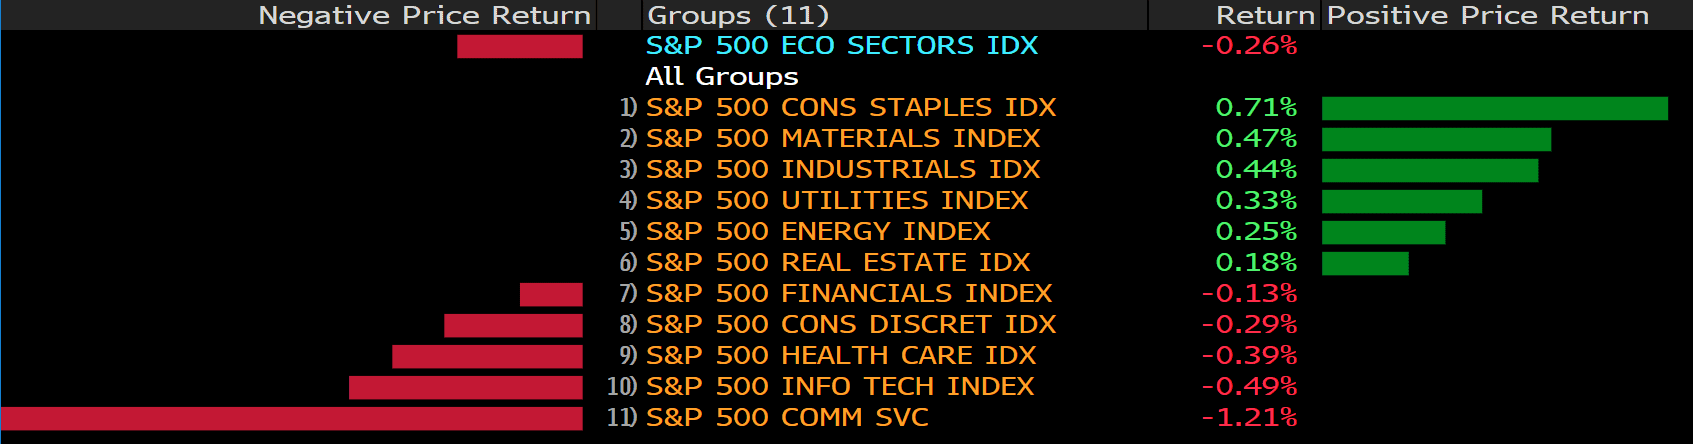
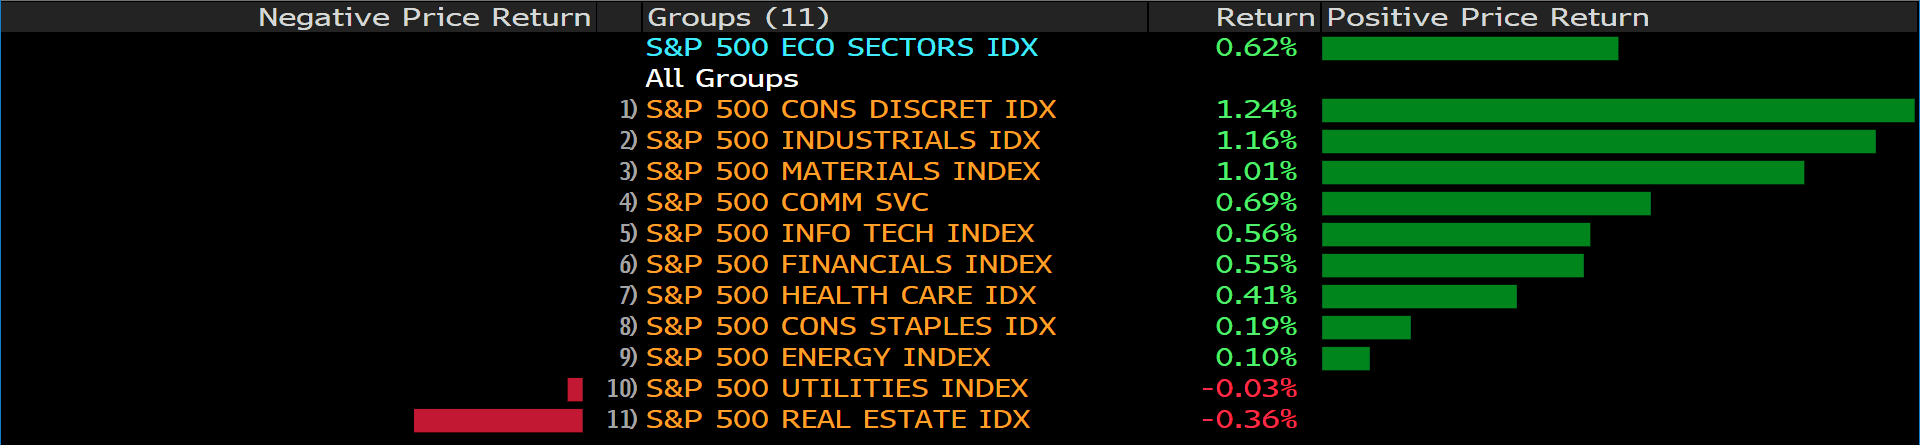
The S&P 500 index closed almost unchanged on Thursday as technology stocks fell, but financial and energy stocks provided support a day after the market sold off due to the hawkish tendencies in the Fed’s meeting minutes. On the economic front, data shows that ISM Non-Manufacturing PMI has weakened more than expected, and the Initial Jobless Claims unexpectedly rose to 207K. At the end of the market, the Dow Jones Industrial Average slipped 0.47% to 36,236.48 points, the S&P 500 index lost 0.1% to 4,696.04 and the Nasdaq Composite Index fell 0.04%.
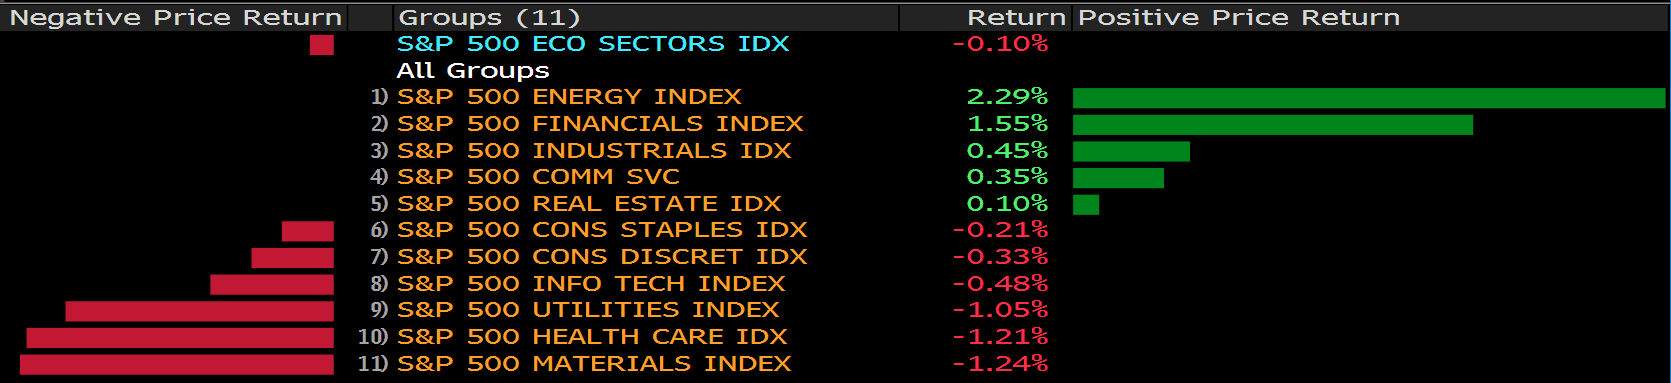
The S&P 500 financial stock index rose 1.6%, continuing the strong gains this week, and energy rose 2.3%, more than 9% since December 31. Energy sector was pushed higher by rising U.S. oil prices, however, since the omicron variant threatened demand when the supply increased in the first quarter, some people believed that headwinds were about to occur. With the 10-year Treasury bond yield approaching a 52-week high, the Fed is expected to tighten its policy sooner, and financial stocks, mainly bank stocks, are in an upward mode, supported by the rising U.S. Treasury bond yields. Signature Bank, SVB Financial and People’s United Financial were among the top gainers, rising 6.29%, 7.53% and 3.98% respectively.
Main Pairs Movement:
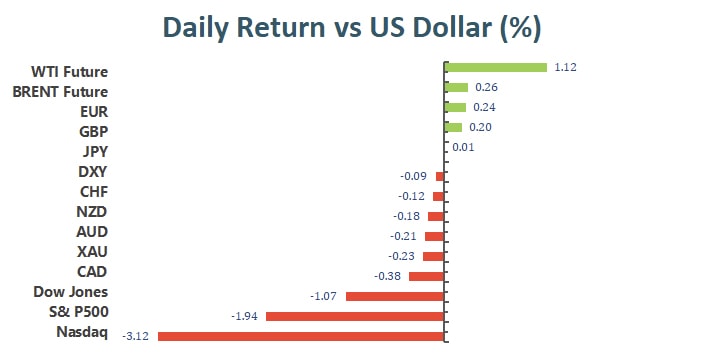
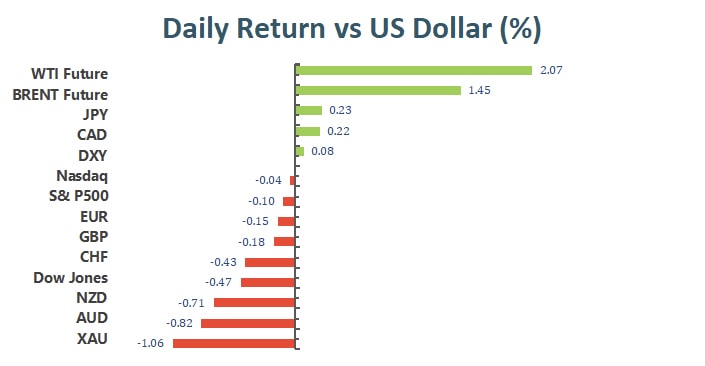
Despite the disappointing US data, the US dollar maintained most of its gains after the FOMC meeting minutes. The stock market maintains a weak tone, while U.S. Treasury yields are still close to the multi-month high set on Wednesday. In the end, the 10-year Treasury bond yield continued to rise, closing at 1.725%. Due to the strong yield trend, the US dollar index also remained a winner and hovered around the 96.24 level.
The focus on Friday will be the Nonfarm Payrolls report. Following the addition of 210K jobs in November, the country is expected to add 400K jobs. The unemployment rate is expected to be 4.1%, lower than the previous 4.2%, but the underemployment rate is expected to rise, from 7.8% to 8%.
The EUR/USD continued to fluctuate at a low level and closed at around 1.1290, while the GBP/USD trend slowed down, trading at around 1.3528.
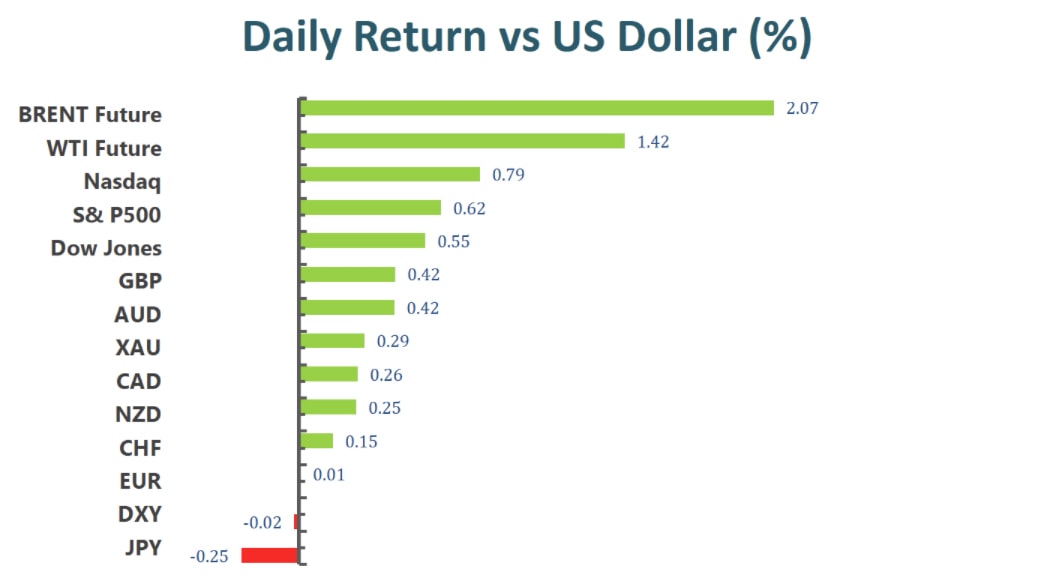
AUD/USD slipped lowered and fell 0.83%, finally hovering in the 0.7160 area. On the other hand, the Canadian dollar appreciated against the U.S. dollar, and the USD/CAD traded in the 1.2720 area, as crude oil prices soared to a new high in several months. The highest price of WTI crude oil was $80.22 per barrel, and the Brent oil was$82.81 per barrel.
Technical Analysis:
GBPUSD (Daily Chart)
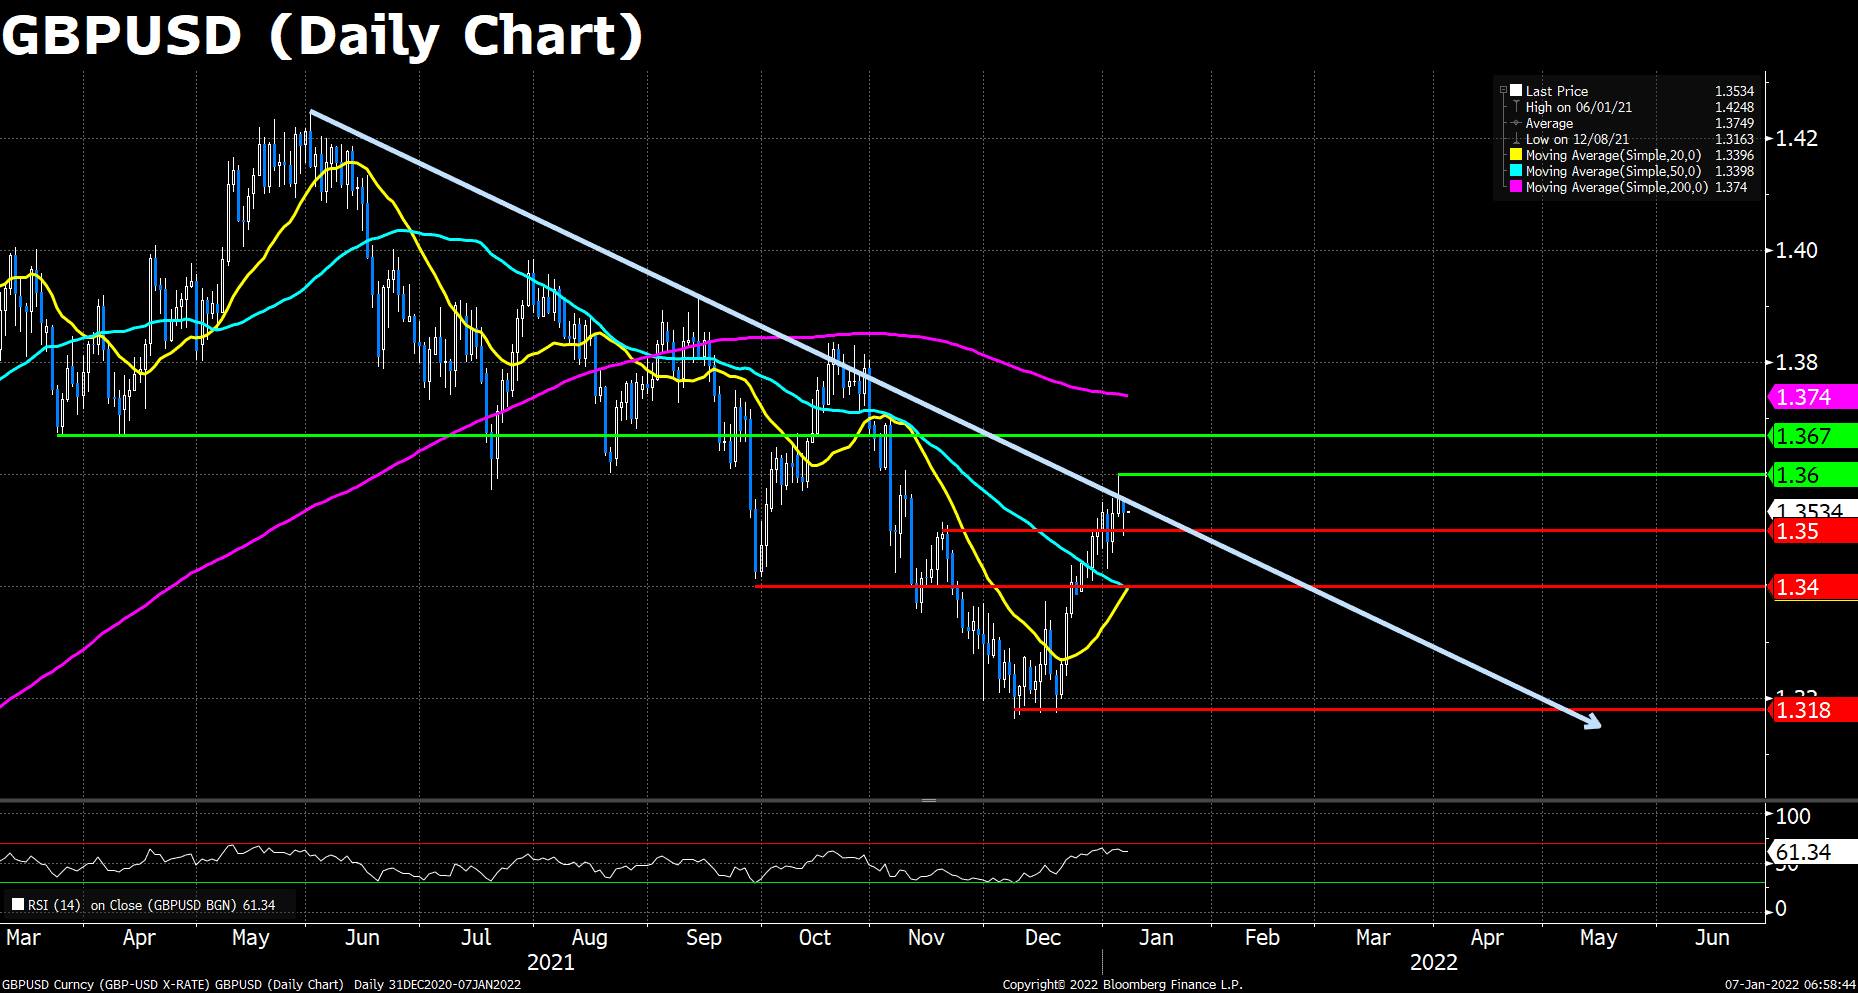
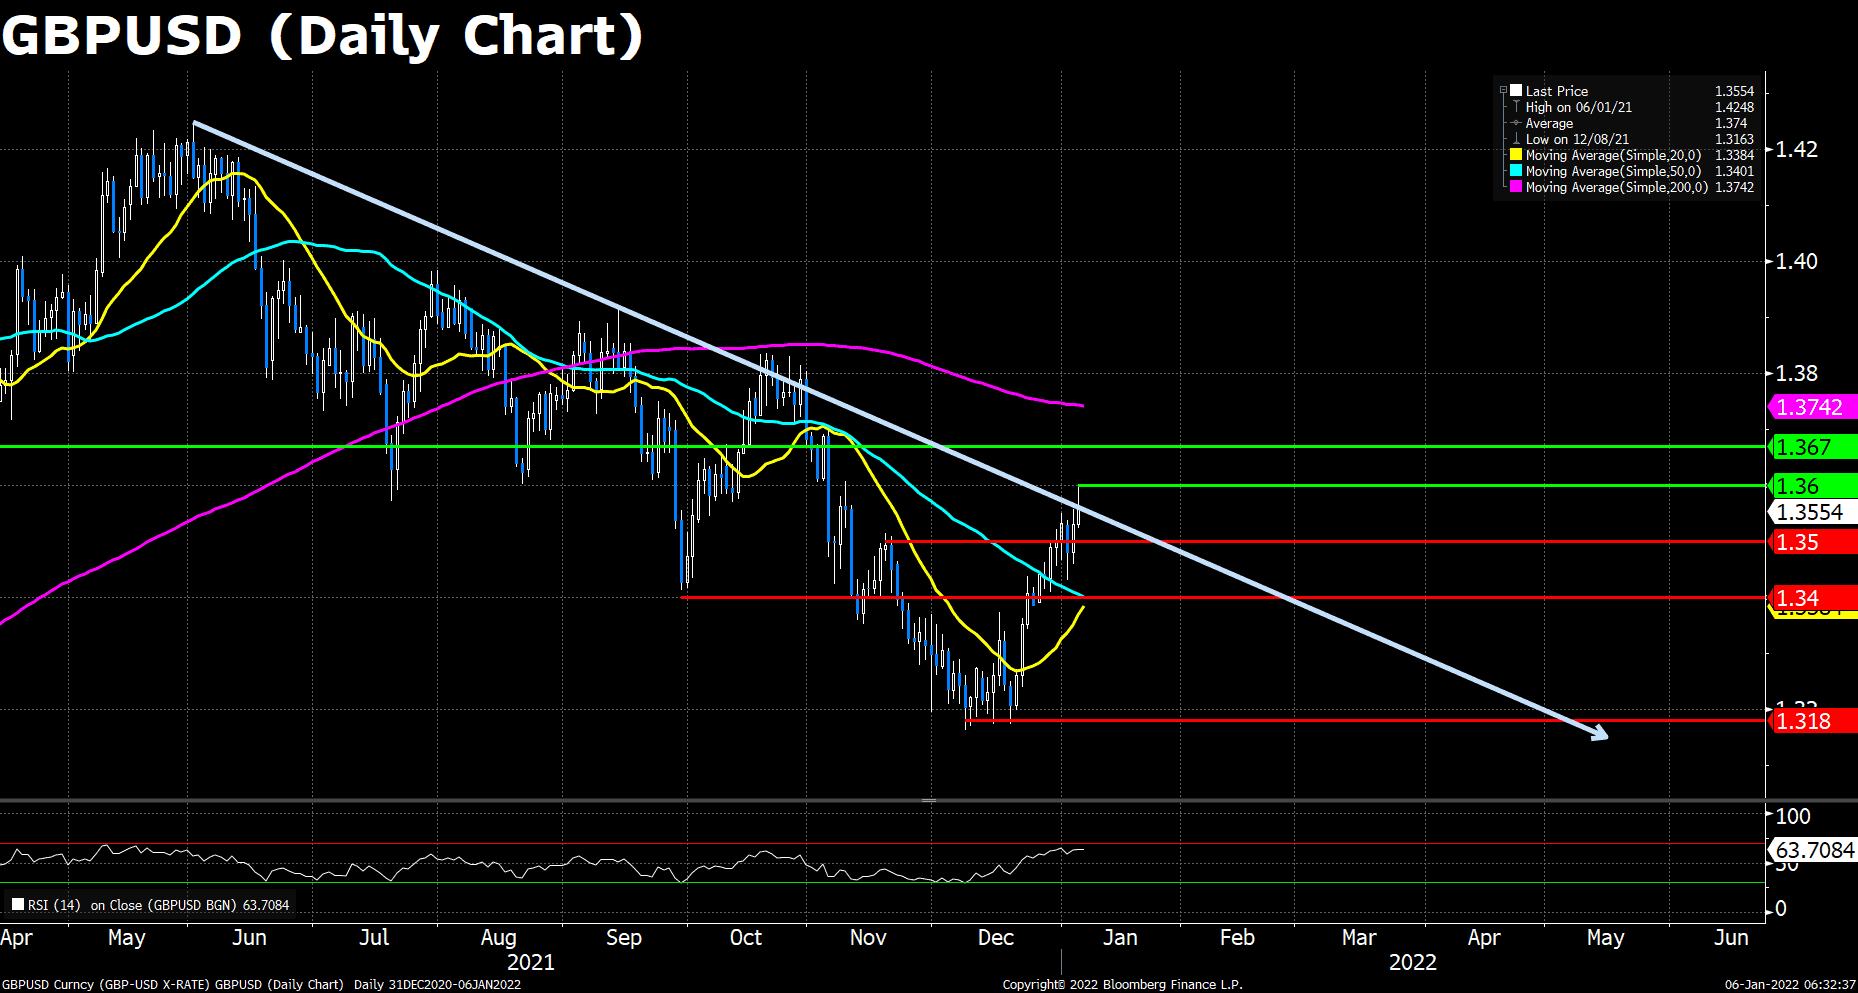
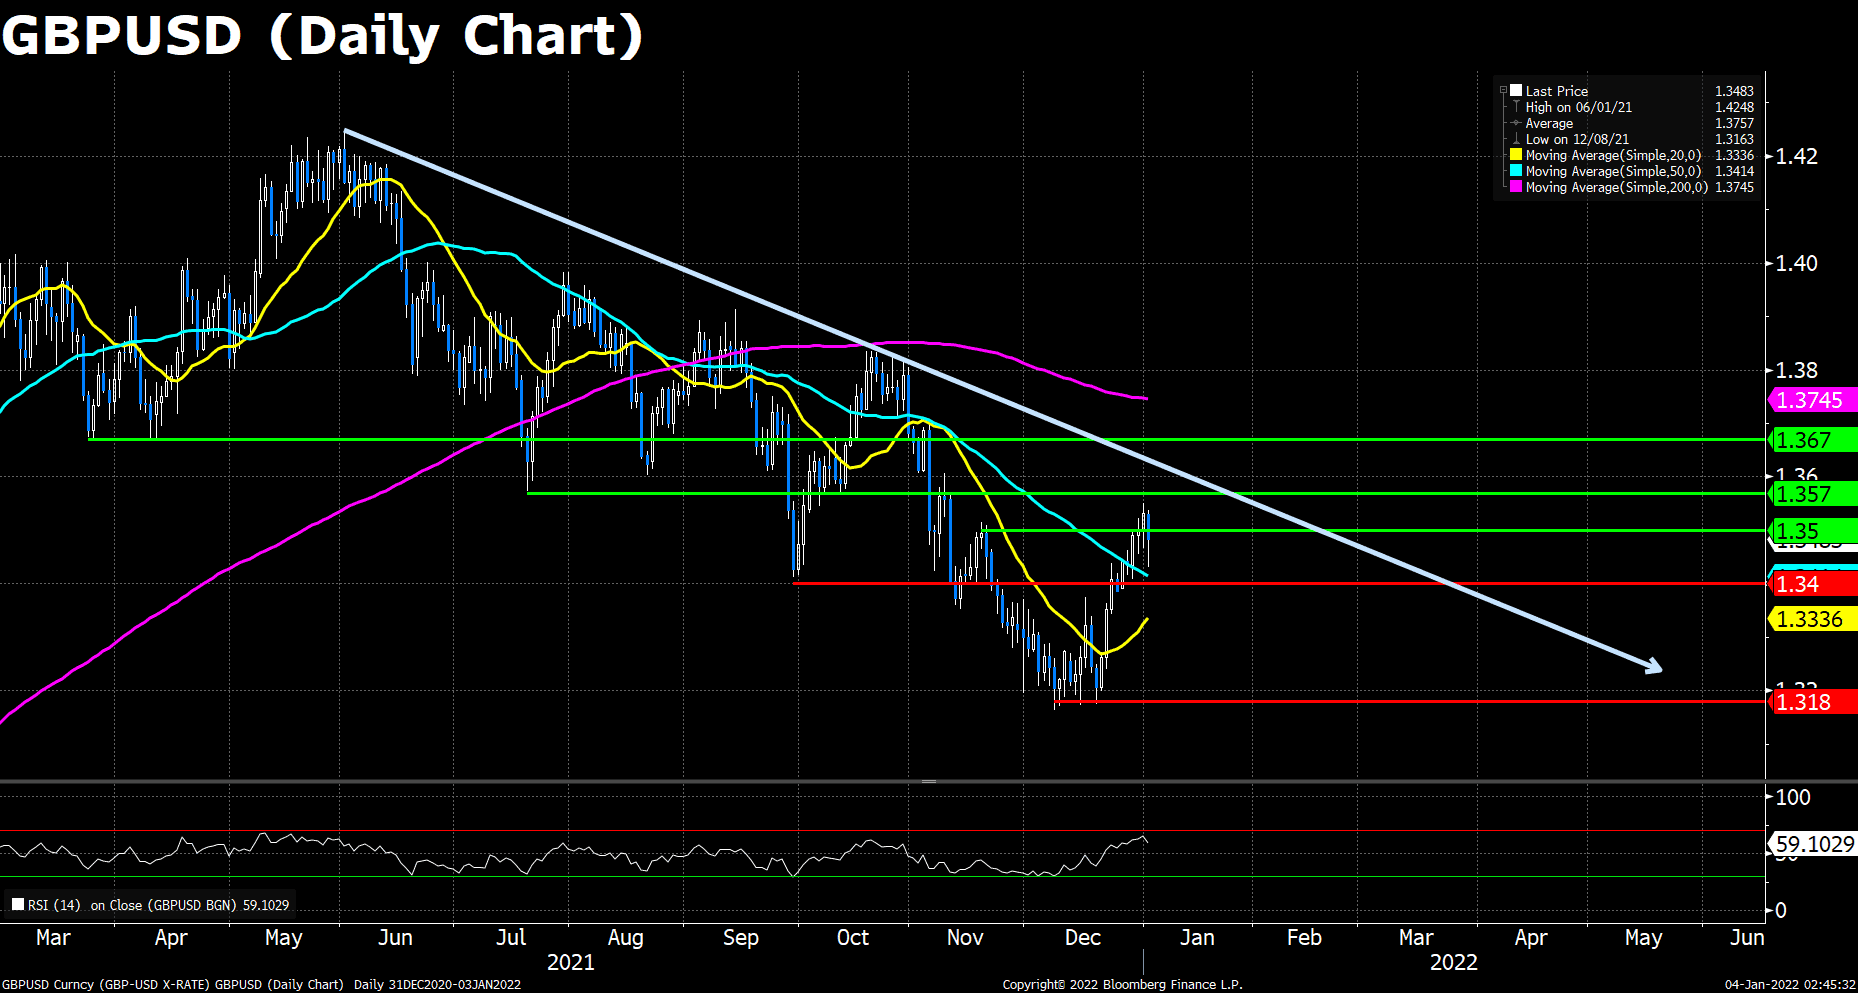
Cable remains on the back foot on Thursday’s Wall Street tradings despite a weaker than expected US December ISM Services PMI survey. The pair failed to regain 1.3550 mark earlier, trading lower by around 30 pips to Thursday’s open, and 75 pips to the 1.3600 key resistance. It is surprising that the greenback hasn’t strengthened more in wake of the latest Fed minutes, where the unexpected rate hike acceleration disclosed.
On the technical front, Cable consolidates between the two key points 1.3500 and 1.3600. A breach to either side should indicate the market sentiment of GBP/USD being positive or the opposite, and we expected the current tug of war between the bulls and the bears will end after the important US NFP released on Friday. The price action is now above its 20 and 50 DMA. The RSI for Cable reads 61.33, still in a healthy bullish range that underpins the sterling’s price.
Resistance: 1.3600, 1.3670
Support: 1.3500, 1.3400, 1.3180
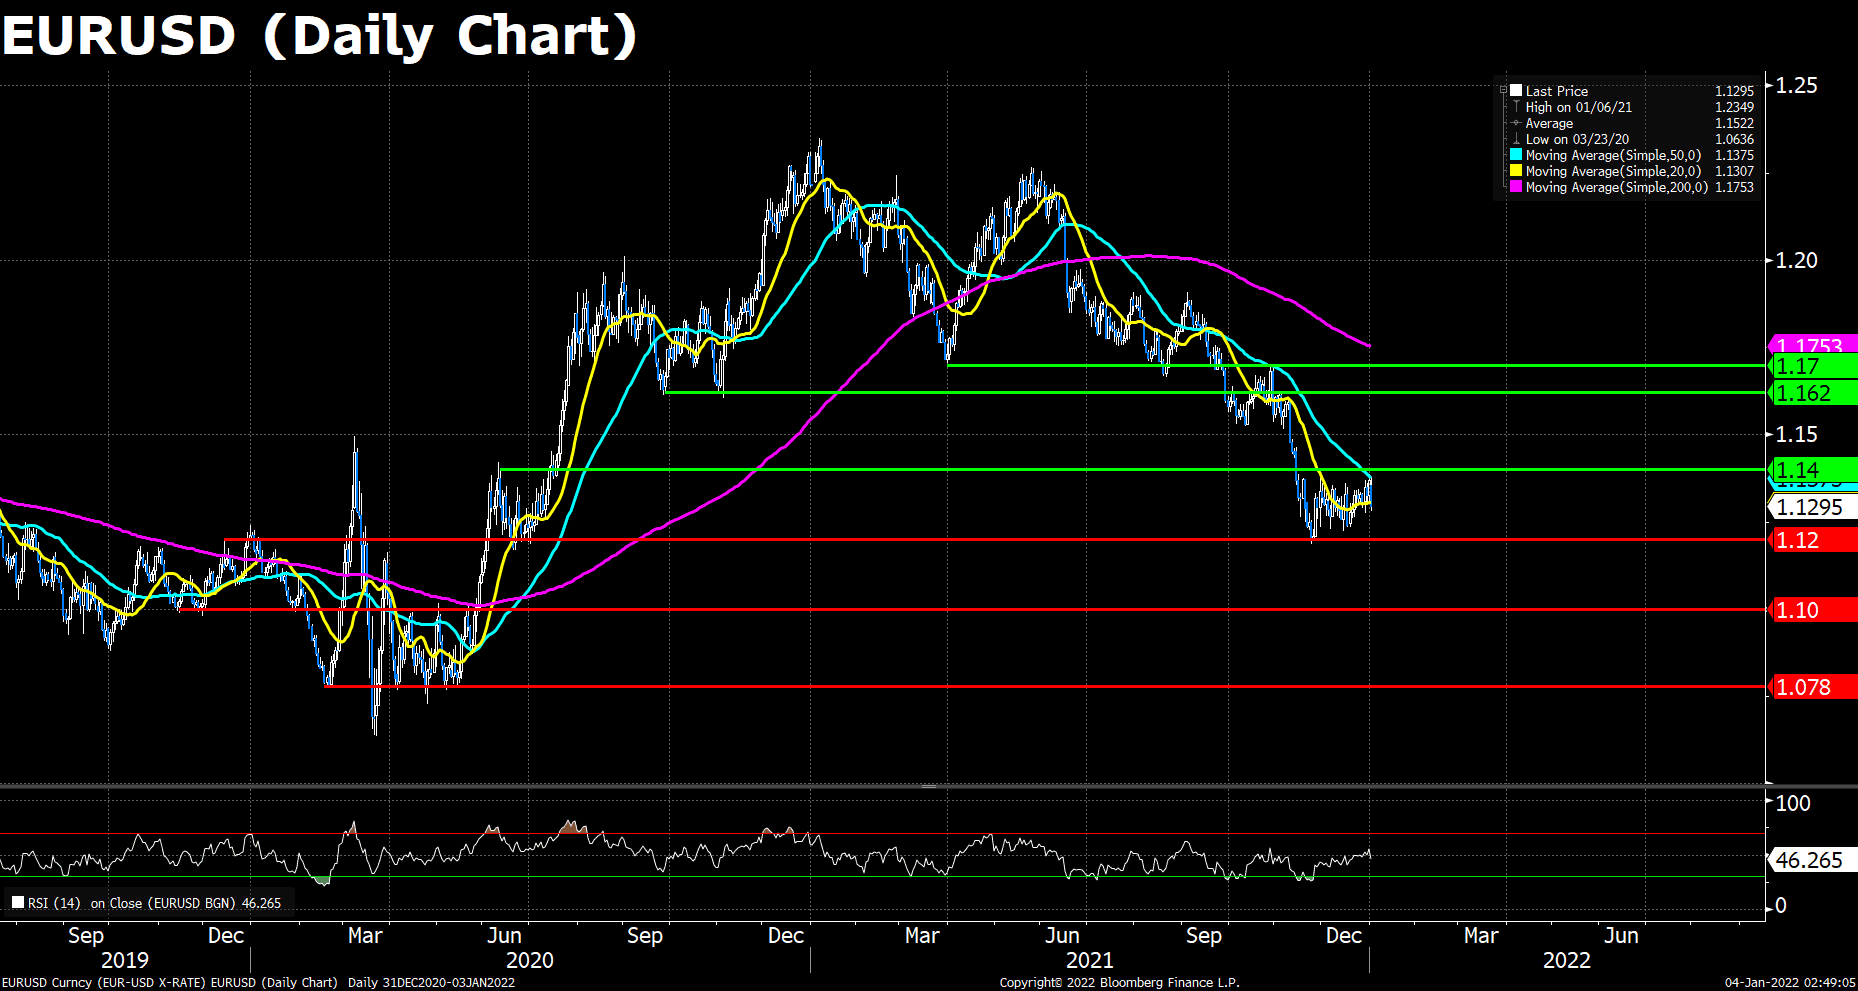
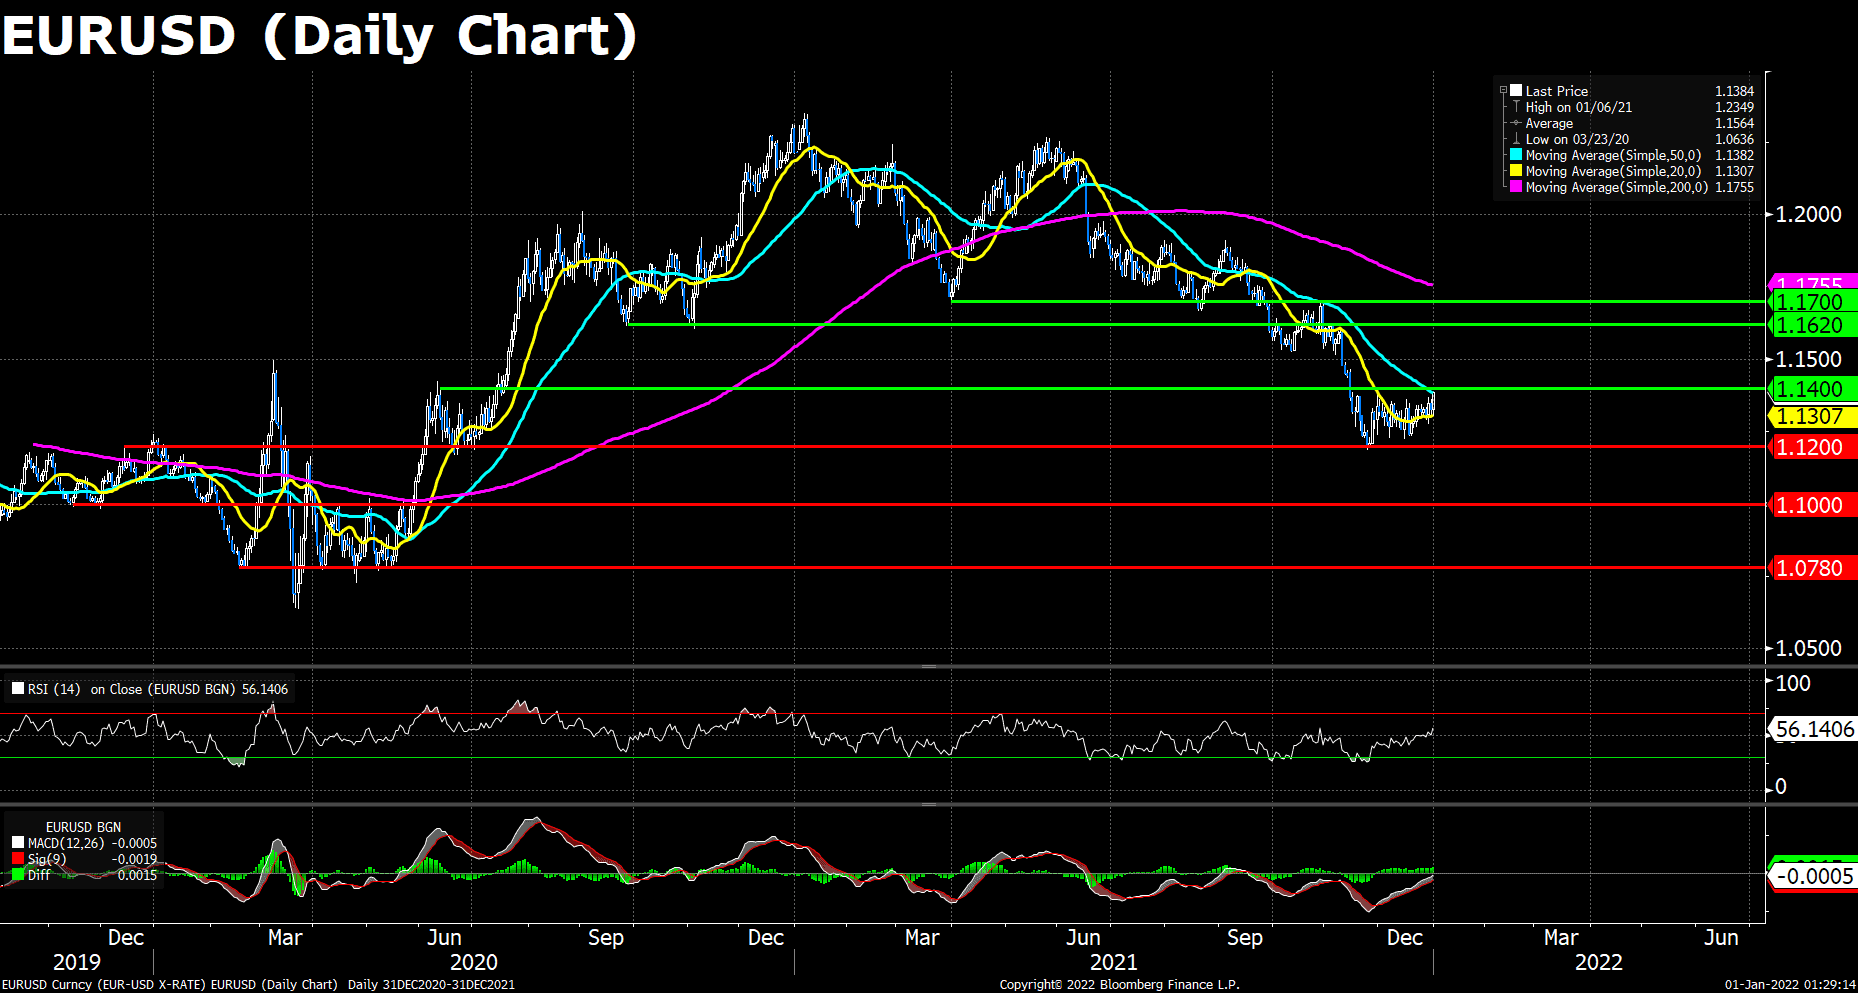
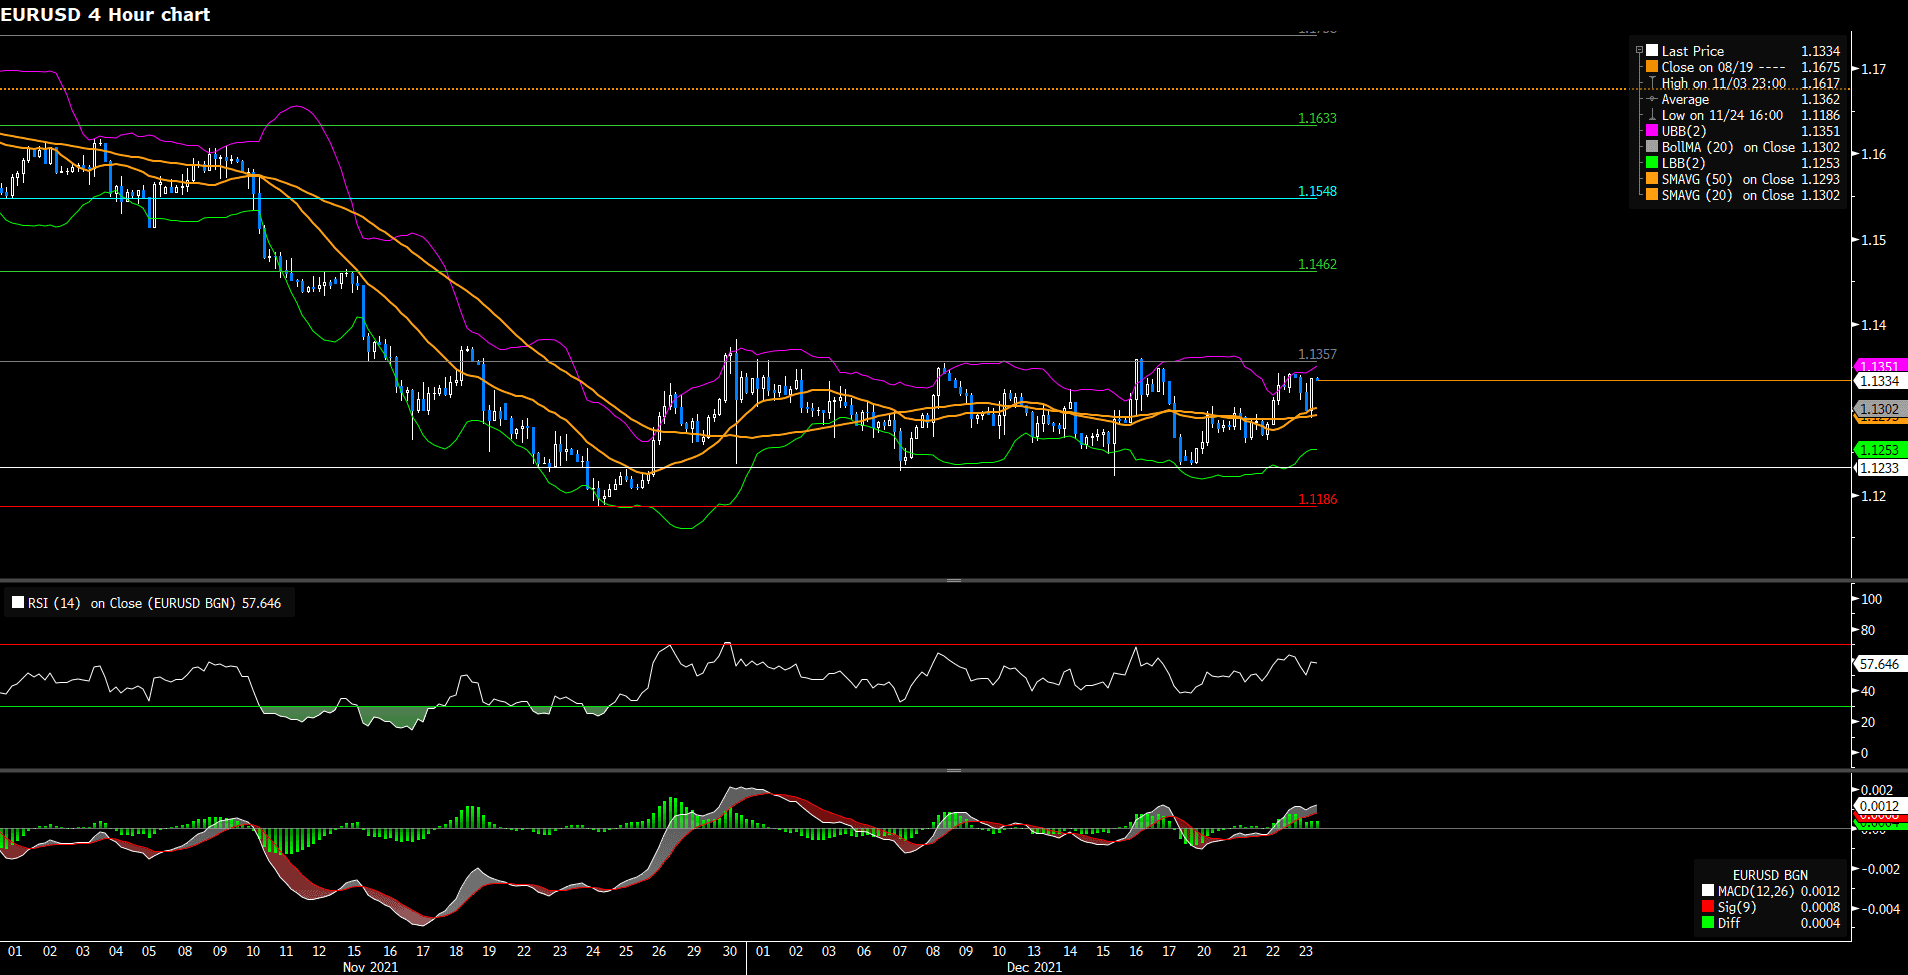
EURUSD (Daily Chart)
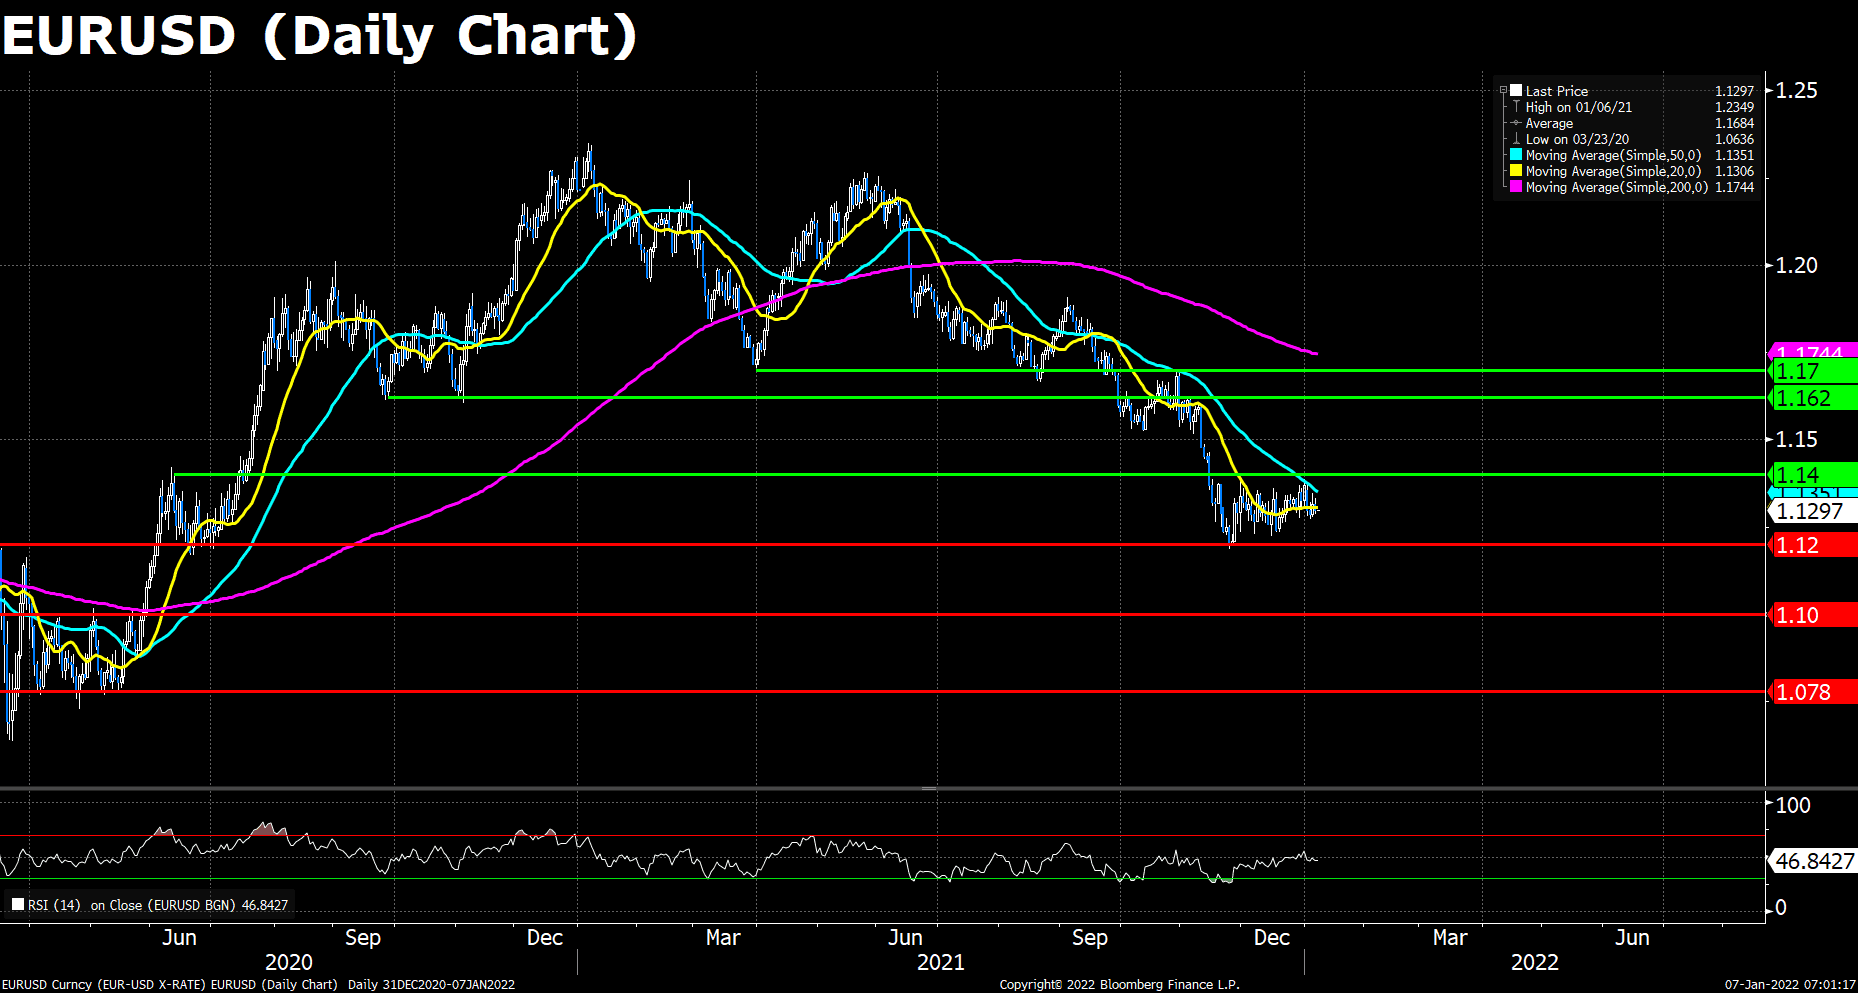
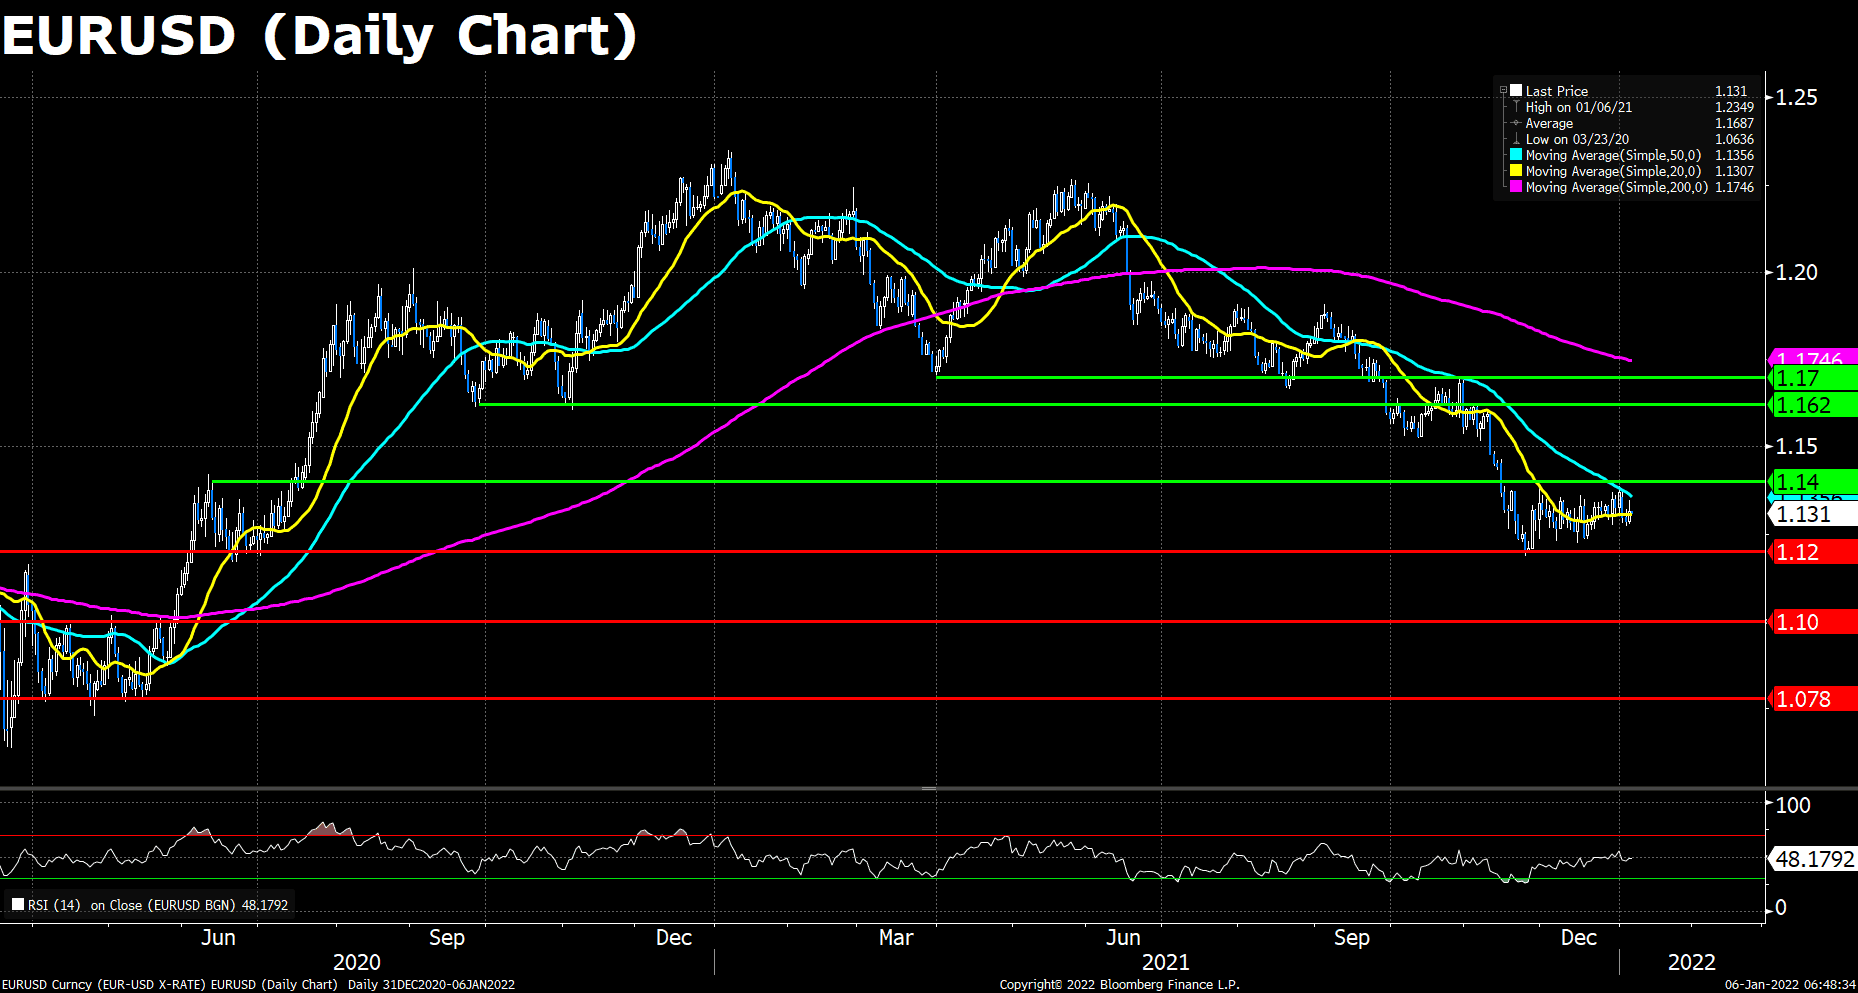
The Euro pair seesaws around the 1.1300 level throughout the day, failing to advance amid dismal US ISM figures. The pair now trades at 1.1297 as of writing but is expected to dip further, as the Fed’s moving up their tightening timetable, compared to the ECB’s dovish stance on their monetary policies, makes investors worry about the widening rate gap between the two currencies. Looking forward, the US NFP and the Retail Sales data of both the EU and the US are on the way to release.
On the technical, the Euro pair has retreated down below its 20 DMA, not to mention the 50 and 200 DMAs. The RSI indicator remains slightly below the average line, showing a neutral-to-bearish market sentiment. As previously mentioned, the pair must breached the key 1.1400 resistance to prove a convincing comeback. On the flip side, a slide below the 1.1200 support may indicate a continuation of the bearish trendline.
Resistance: 1.1400, 1.1620, 1.1700
Support: 1.1200, 1.1000, 1.0780
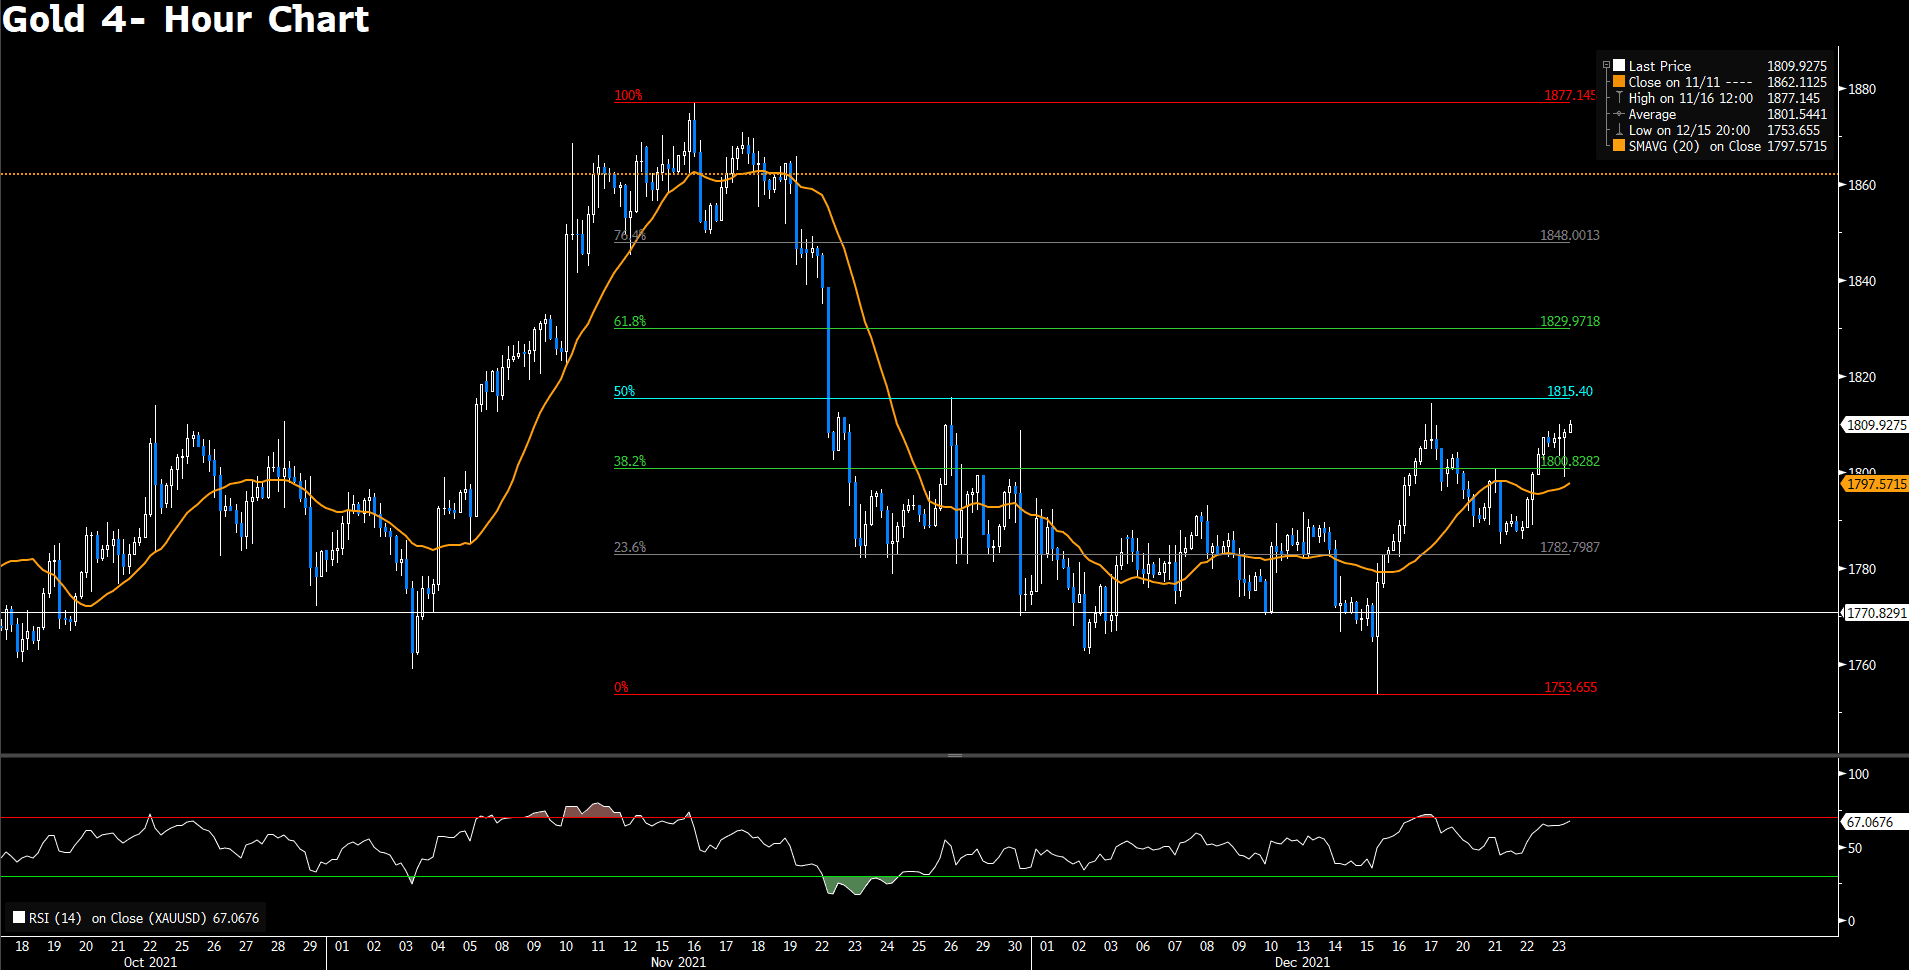
XAUUSD (Daily Chart)
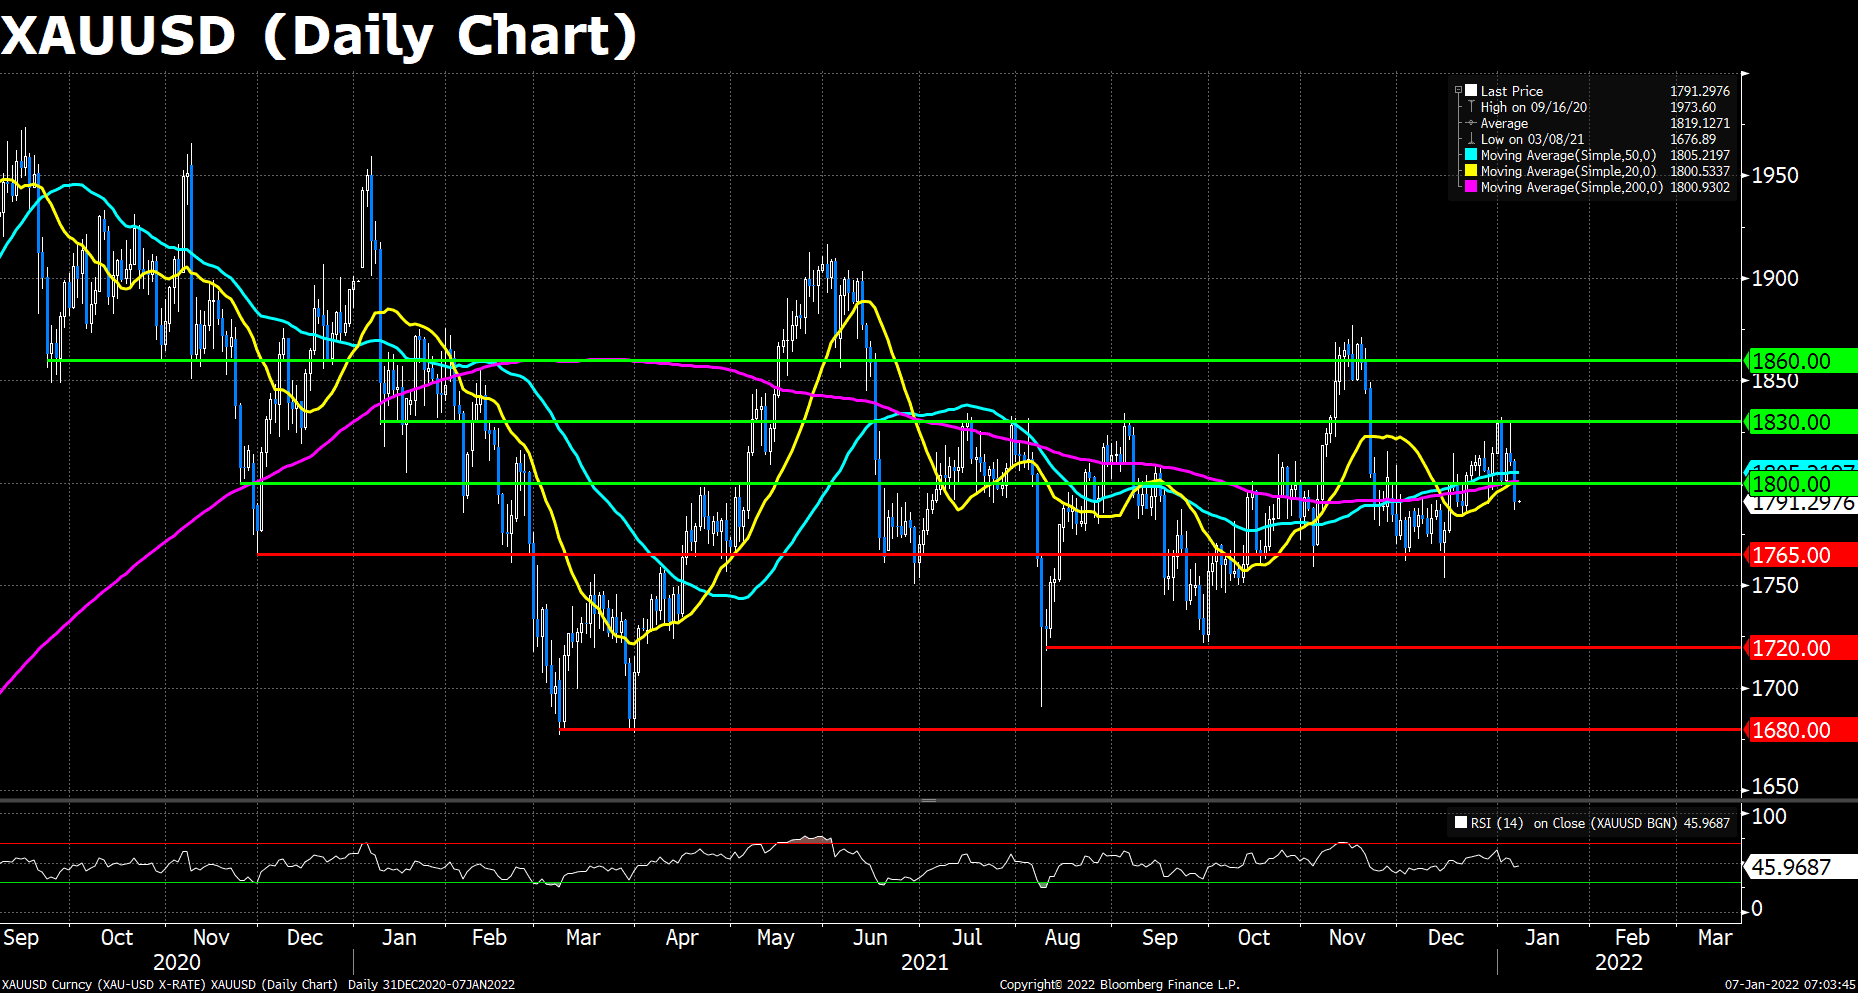
Spot gold price has tumbled from Asia Pacific session levels in the $1810 area to current levels (and session lows) around $1790, with on-the-day losses currently standing at just over 1%. A late-Asian afternoon rebound that saw spot prices climb from the mid-$1790s to near the $1810 level again ultimately proved nothing more than an intra-day dead-cat bounce and a good opportunity for gold bears to add to short positions. Selling pressure in gold markets derived from the rallying US yields, which was boosted by the hawkish talks in the FOMC meetings on Wednesday.
As to technical, the pair has fallen below all its moving averages during today’s tradings, while the RSI for gold is hovering slightly below the average line. The fresh bearish sentiments amid the hiking US yields may pressure the gold price to go further south. The previous $1800 defence was lost, eyeing to the next support level at $1,765. On the flip side, a bounce back above $1,800 before the end of the day would suggest more gains ahead for the yellow metal.
Resistance: 1800, 1830, 1860
Support: 1765, 1720, 1680
Economic Data:
|
Currency
|
Data
|
Time (GMT + 8)
|
Forecast
|
|
GBP
|
Construction PMI (Dec)
|
17:30
|
54.0
|
|
EUR
|
CPI (YoY) (Dec)
|
18:00
|
4.7%
|
|
USD
|
Nonfarm Payrolls (Dec)
|
21:30
|
400K
|
|
USD
|
Unemployment Rate (Dec)
|
21:30
|
4.1%
|
|
CAD
|
Employment Change (Dec)
|
21:30
|
27.5K
|
|
|
CAD
|
Ivey PMI (Dec)
|
23:00
|
|
|
|
|
|
|
|