Market Focus
Three major stock indexes weakened on Wednesday after U.S. bond yields soared and tech stocks retreated after Federal Reserve Chairman Jerome Powell signaled there was enough room to raise interest rates. The Fed said in a statement that it may be appropriate to raise interest rates “soon” and confirmed plans to end its bond-buying program in early March after the remarks. At the end of the market, the Dow Jones Industrial Average fell 0.38% to 34,168.09 points, the S&P 500 index lost 0.15% to 4,349.93 and the Nasdaq Composite Index added 0.02% to 13,542.12 points
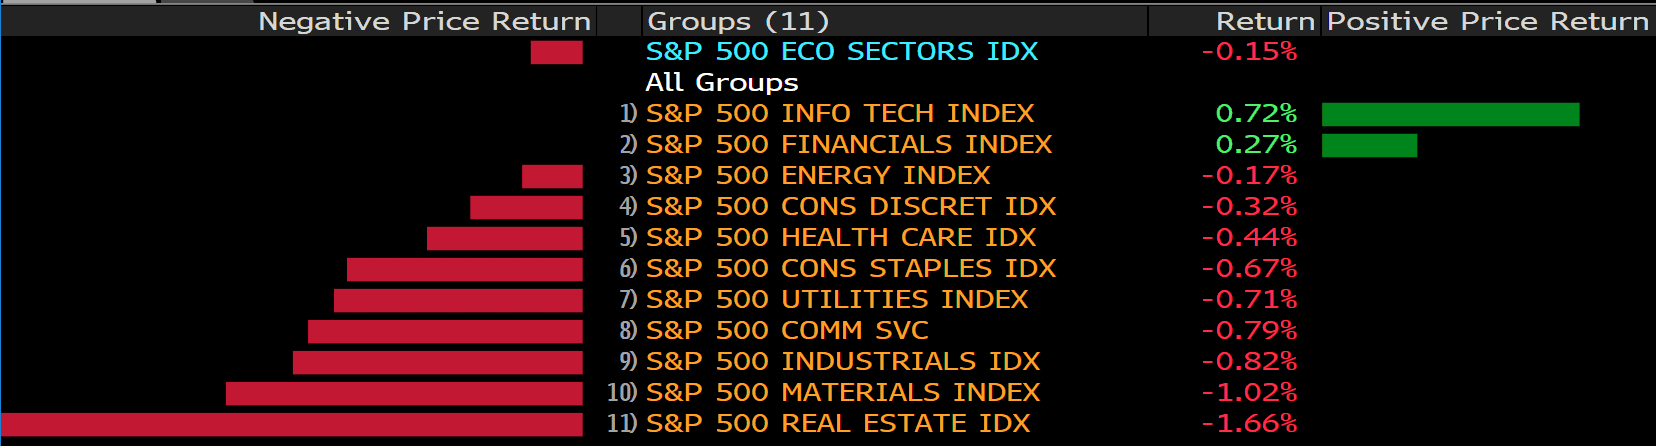
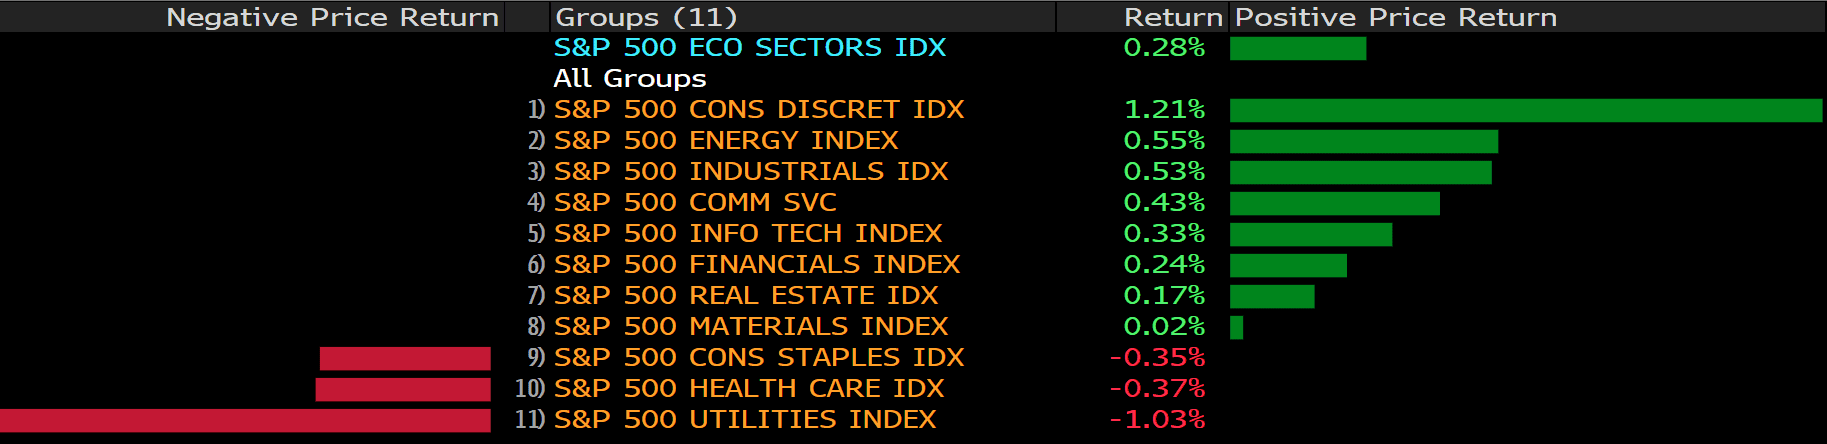
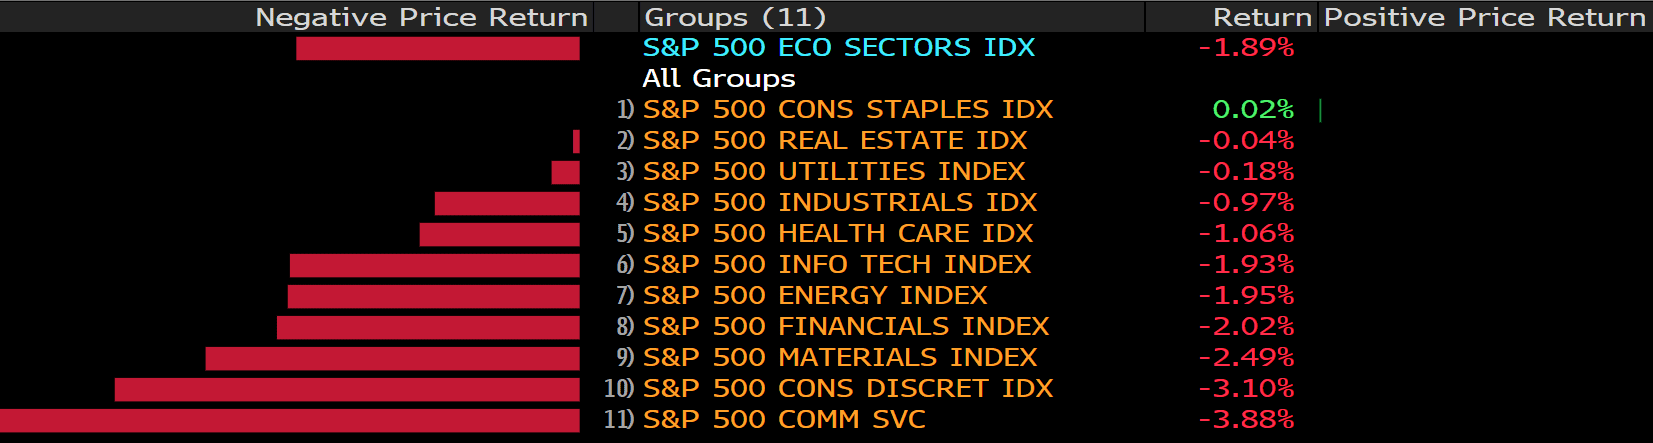
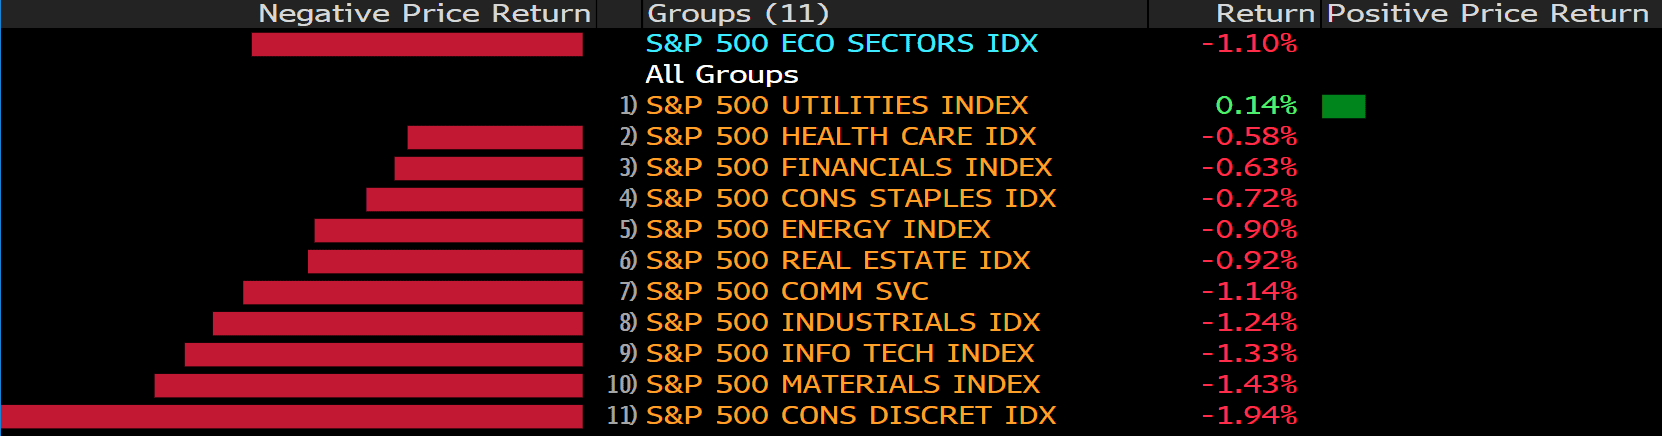
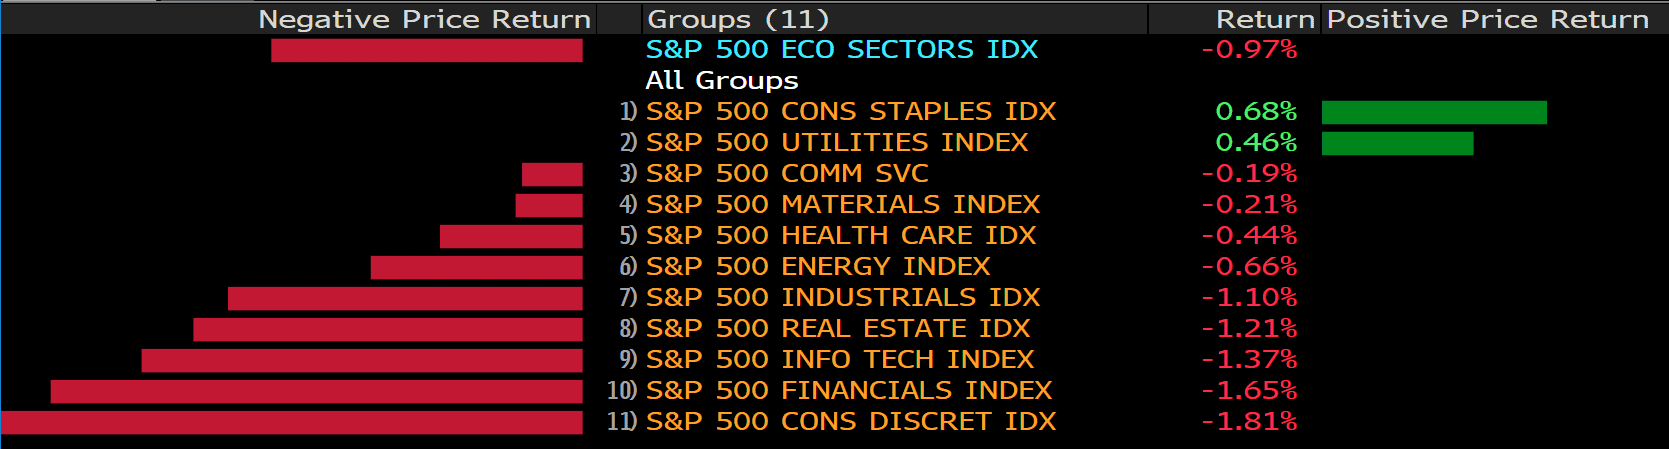
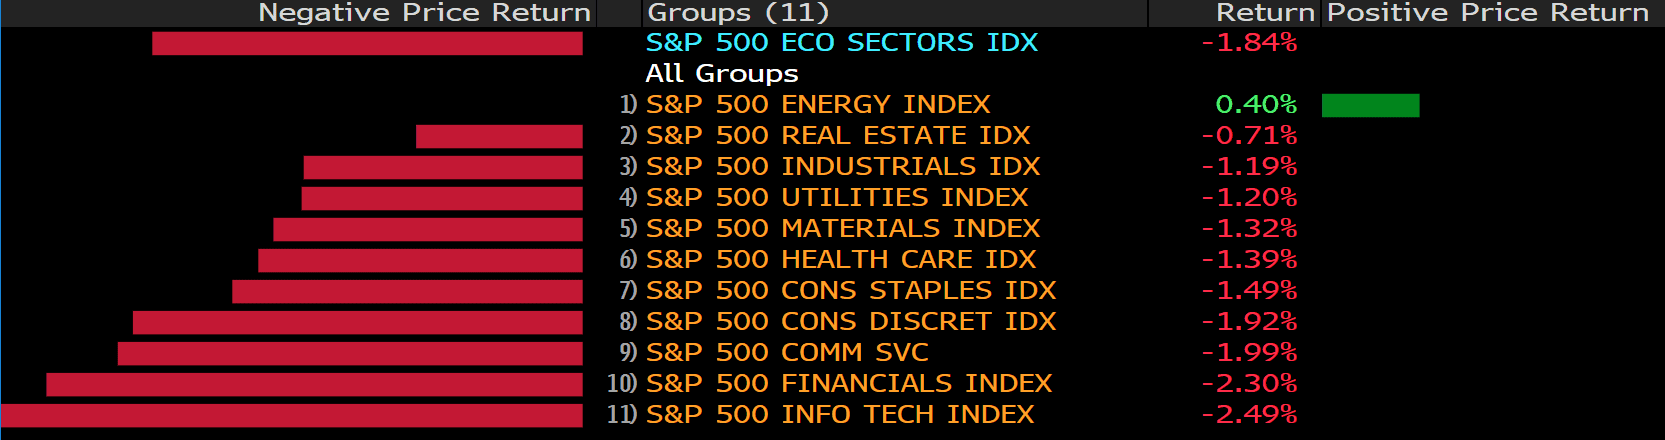
Of the 11 sectors of the S&P 500, 9 ended lower, with the real estate sector falling the most, down 1.66%. The biggest winner was information technology sector, which rose 0.72%, followed by the financial sector, which rose 0.27%. Fourth-quarter earnings season is in full swing, with one in five S&P 500 companies reporting results. According to Refinitiv data, 81% of them beat expectations. Microsoft rose 2.8% after beating consensus, driven in part by its cloud business. On the other hand, Boeing fell 3% after the planemaker reported a wider-than-expected fourth-quarter loss and lower-than-expected revenue, as delayed deliveries of its 787 Dreamliner program hurt performance. On Thursday, several companies will report earnings, such as Apple, Chevron, Danaher… .
Main Pairs Movement:
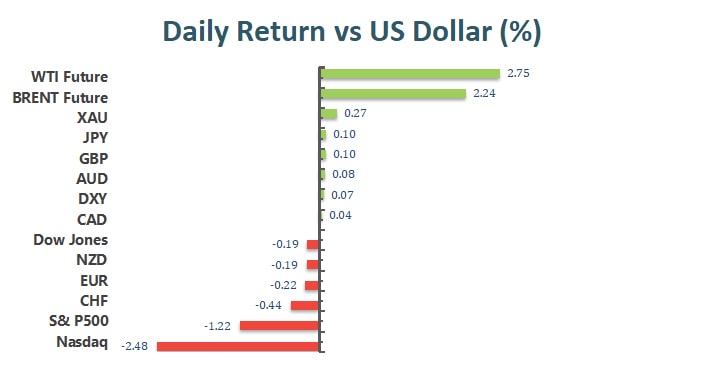
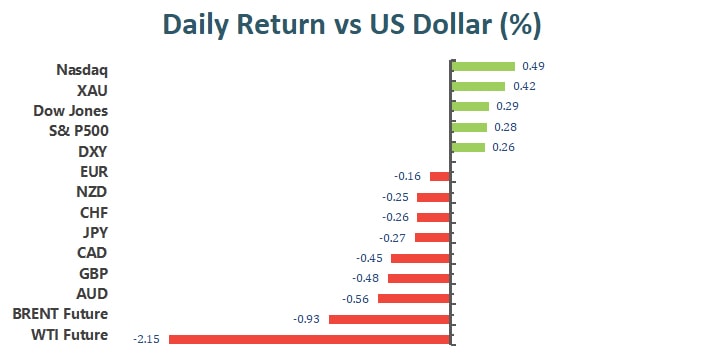
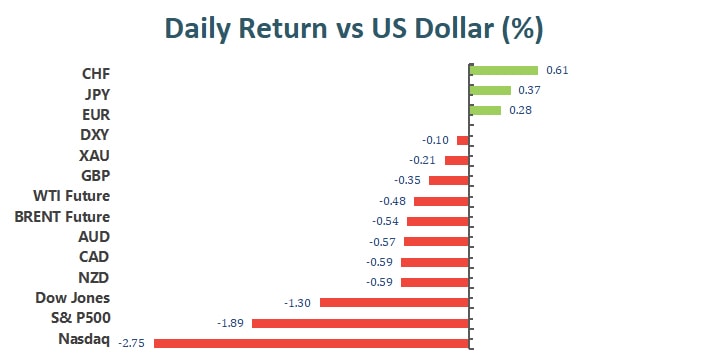
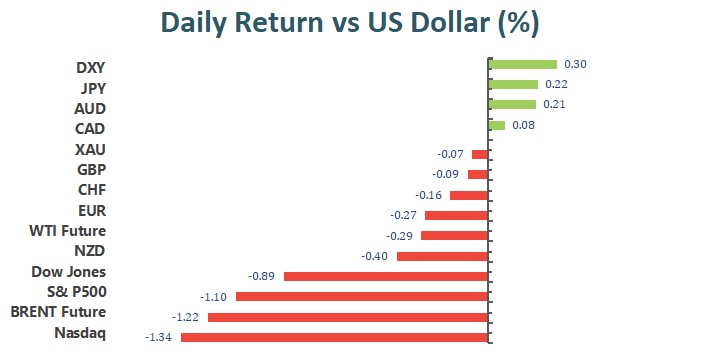
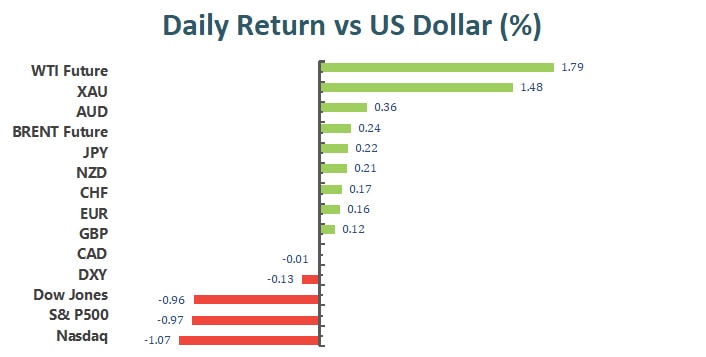
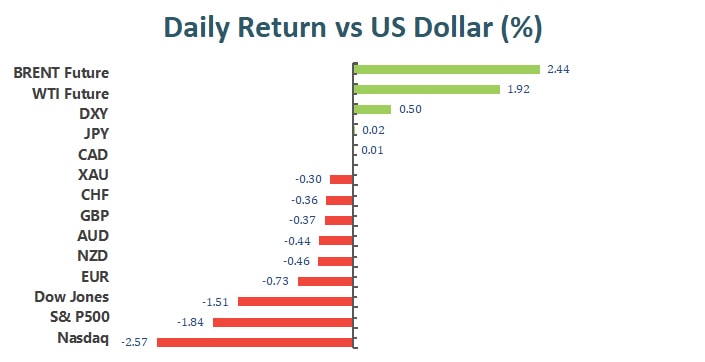
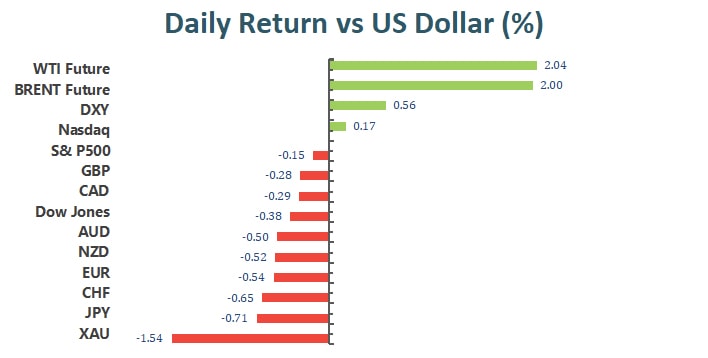
The U.S. dollar closed higher across the board on Wednesday and beat all rivals in the wake of the Federal Reserve’s monetary policy decision. As widely expected, interest rates and tapering remain unchanged, but Fed Chairman Jerome Powell boosted hawkish sentiment after suggesting there was plenty of room for rate hikes. In the end, the U.S. dollar index rose 0.54% and the U.S. 10-year Treasury yield rose 0.32%
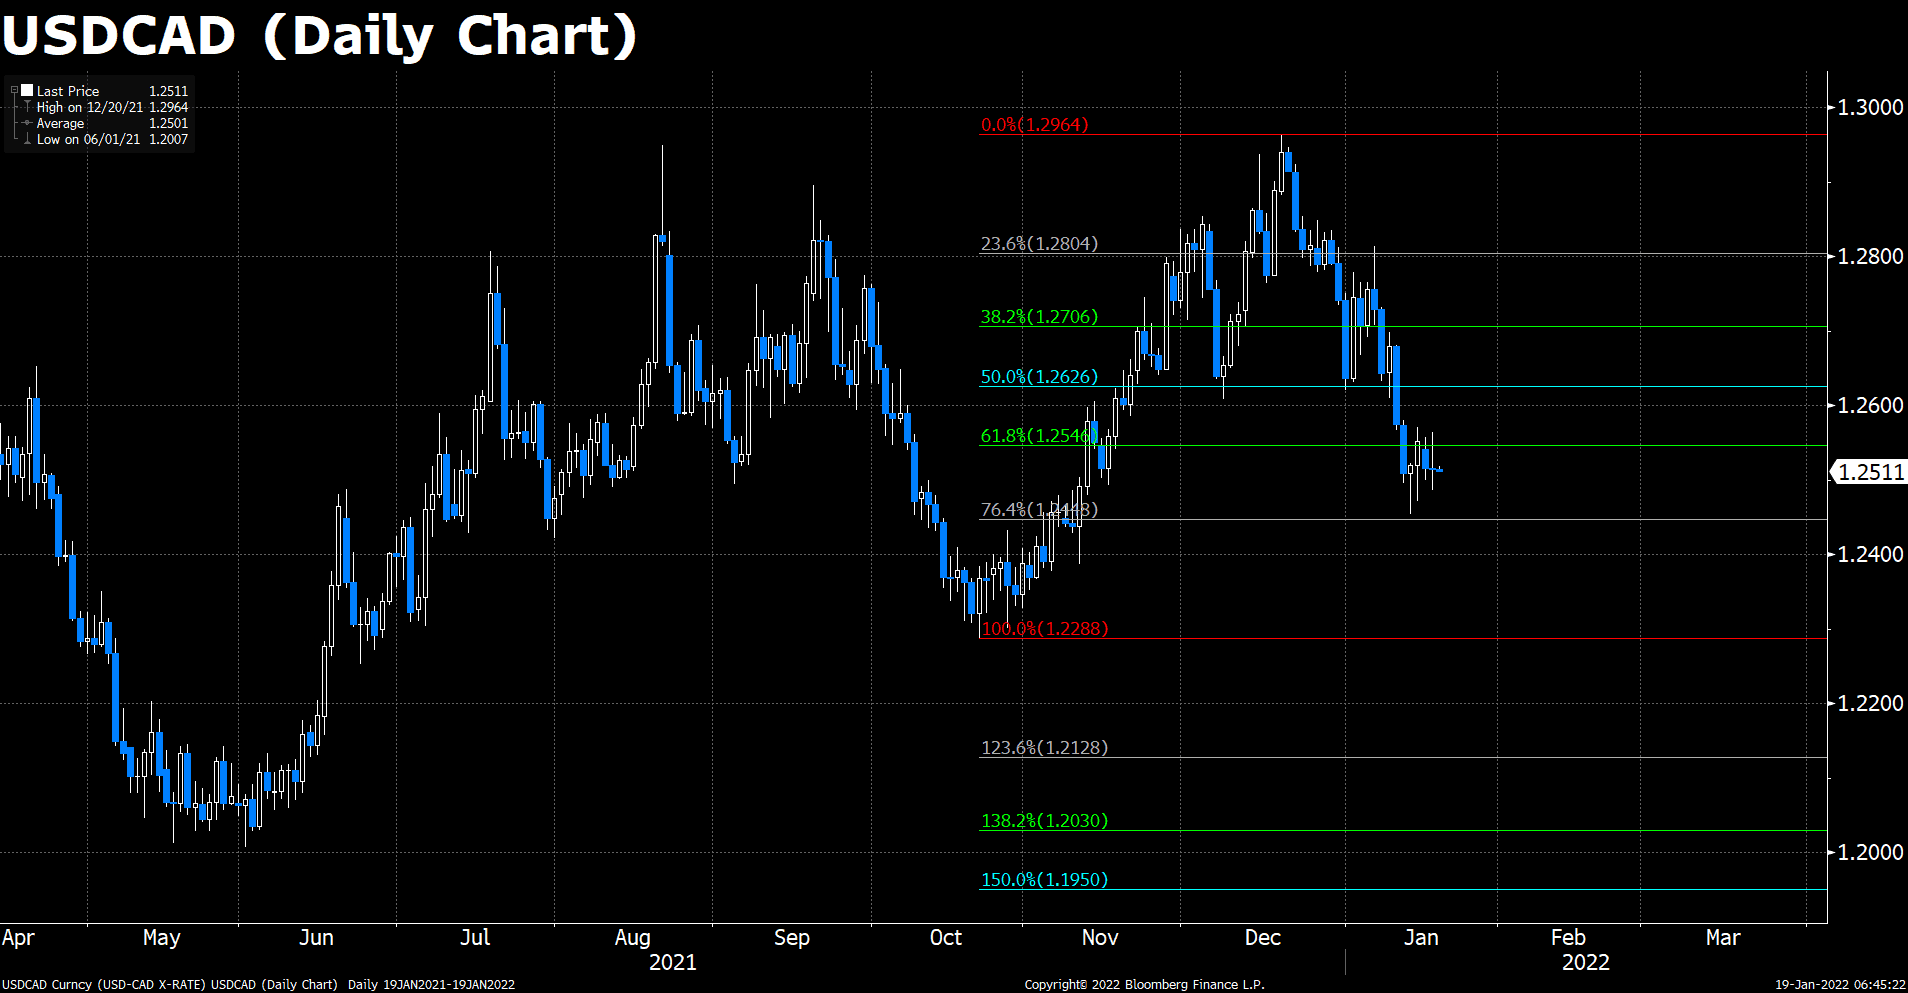
As the dollar strengthened, the pound and euro continued to weaken and head south, down 0.31% and 0.52%, respectively. AUD/USD is near a weekly low of 0.7089, while USD/CAD traded near 1.2670, and USD/JPY closed at 114.64.
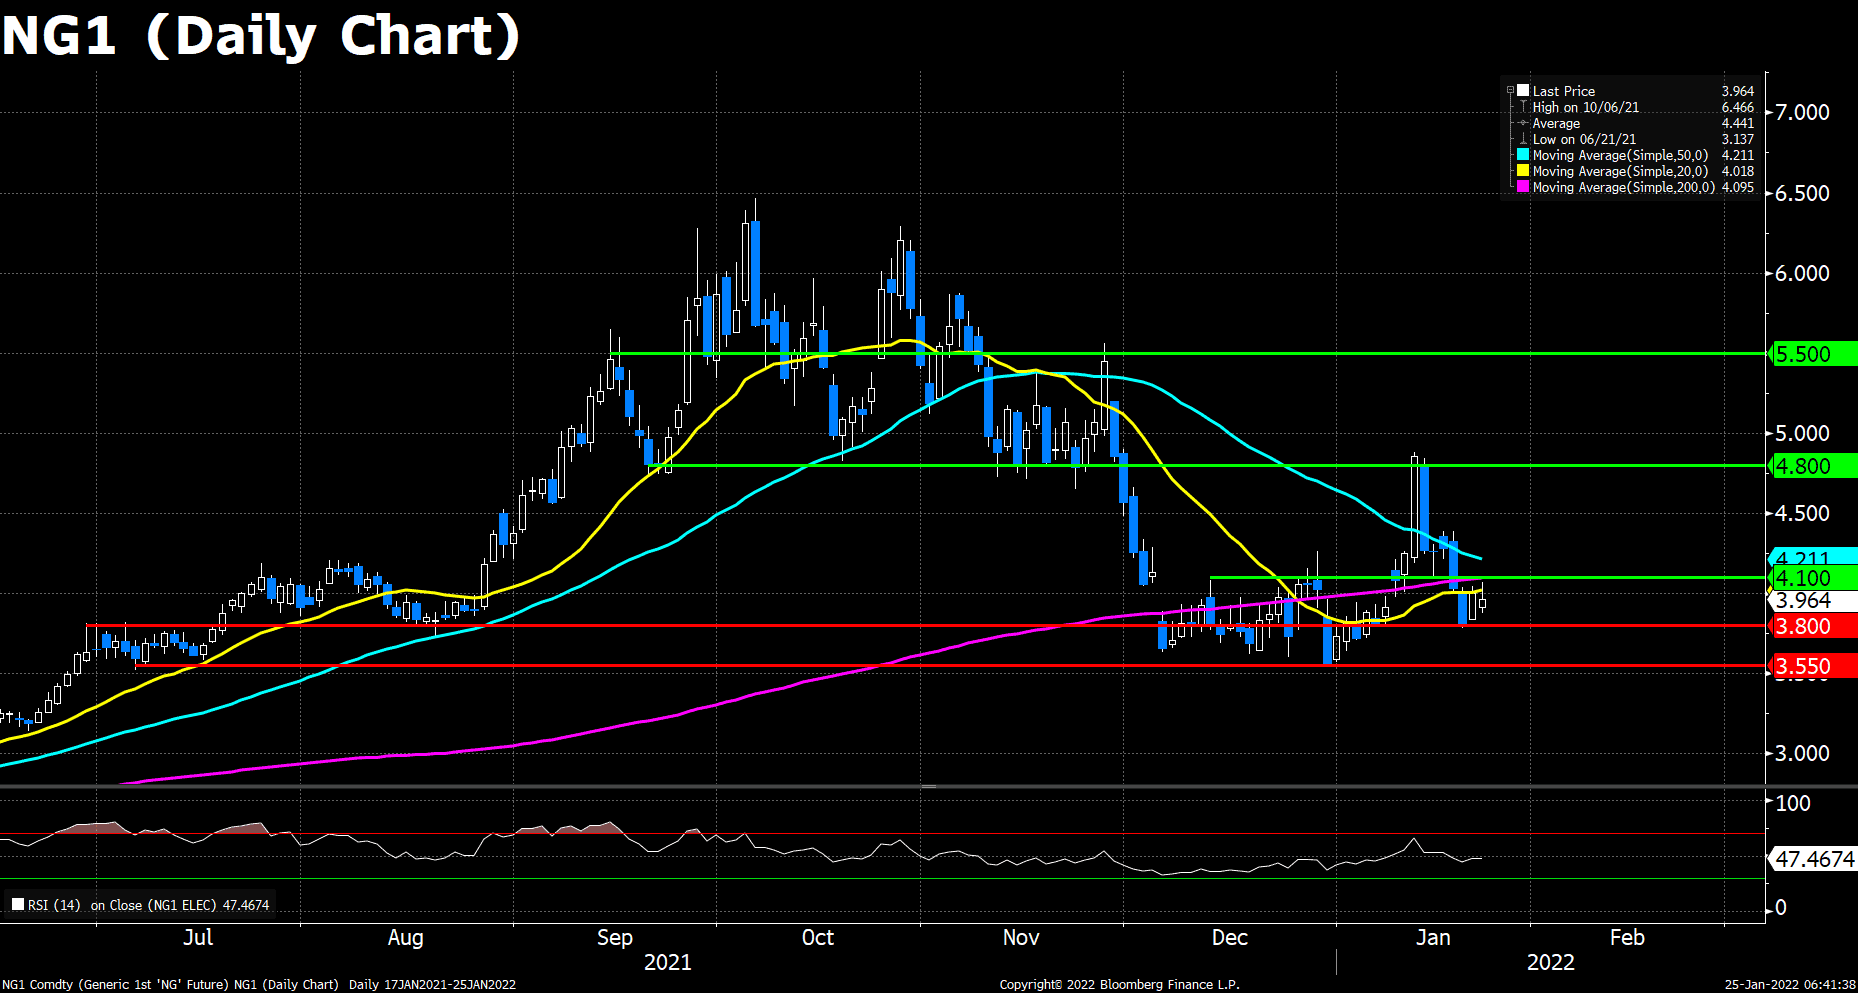
Gold was the worst performer, down around $30.00 and settled at $1,816 per ounce. Crude oil kept moving north, with WTI retreating from daily highs of $87.92 to around $86.50 per barrel.
Technical Analysis:

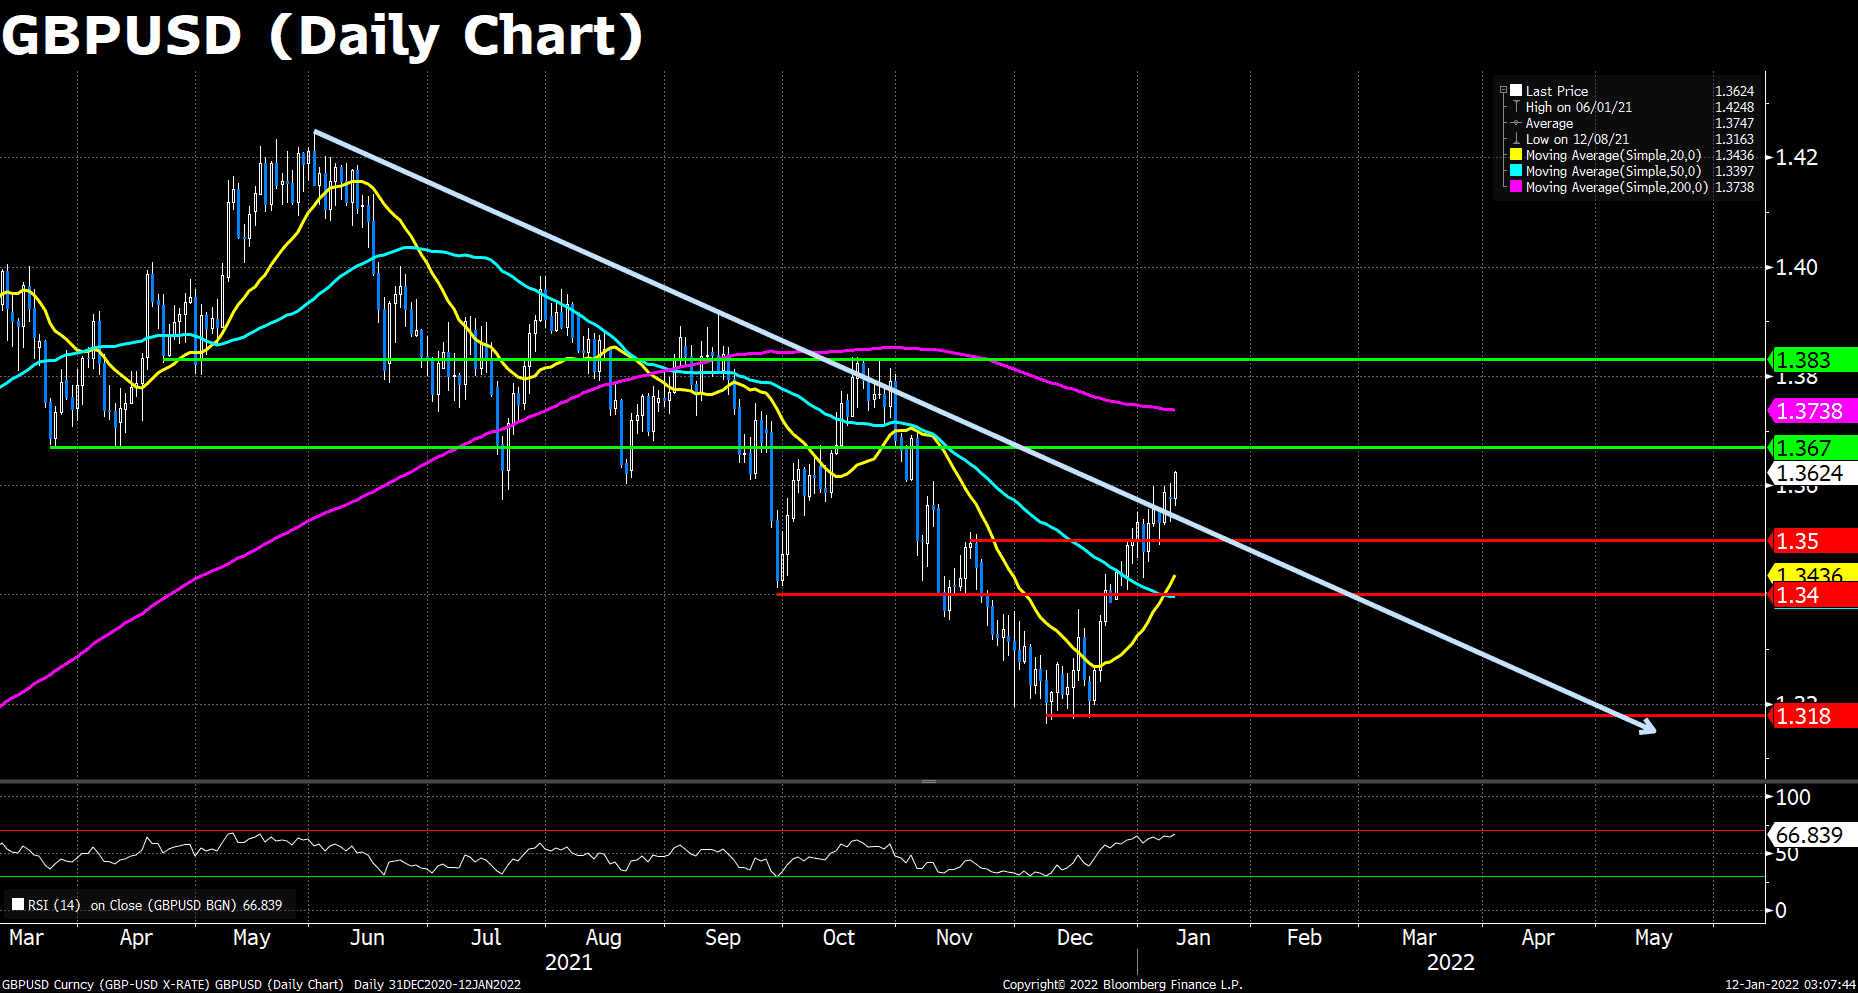
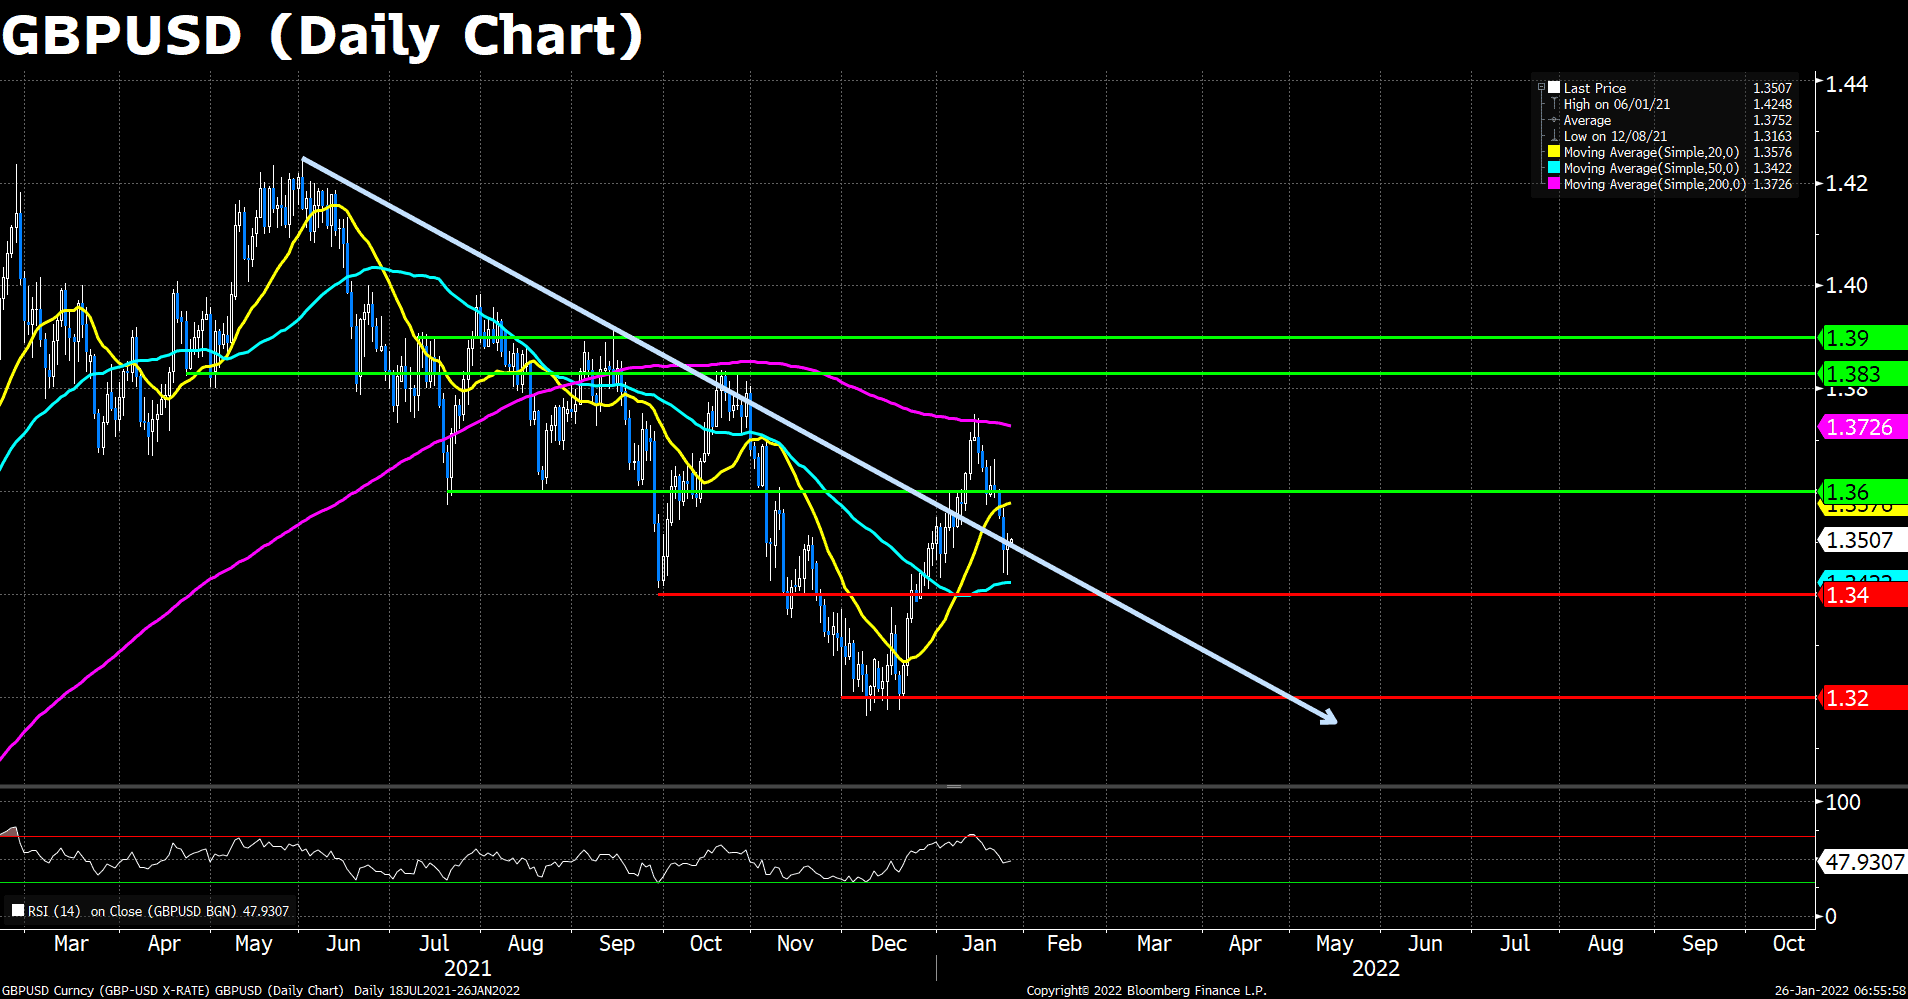
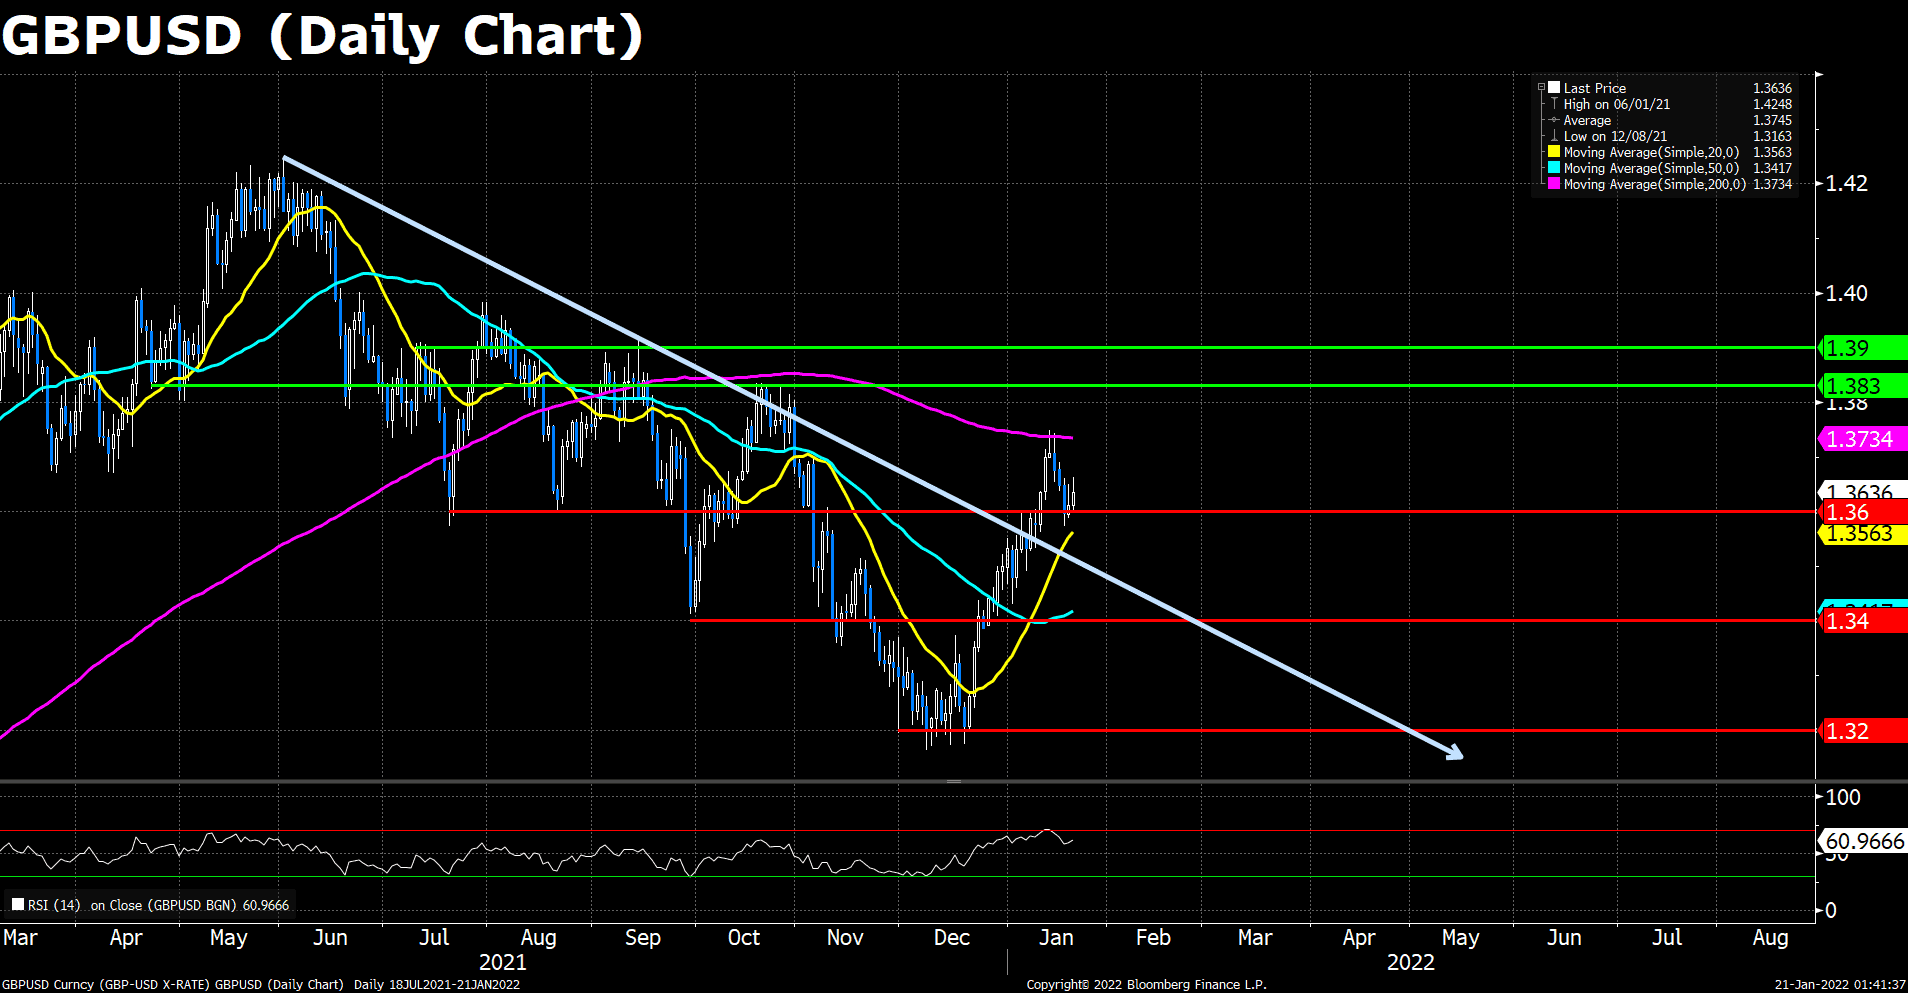
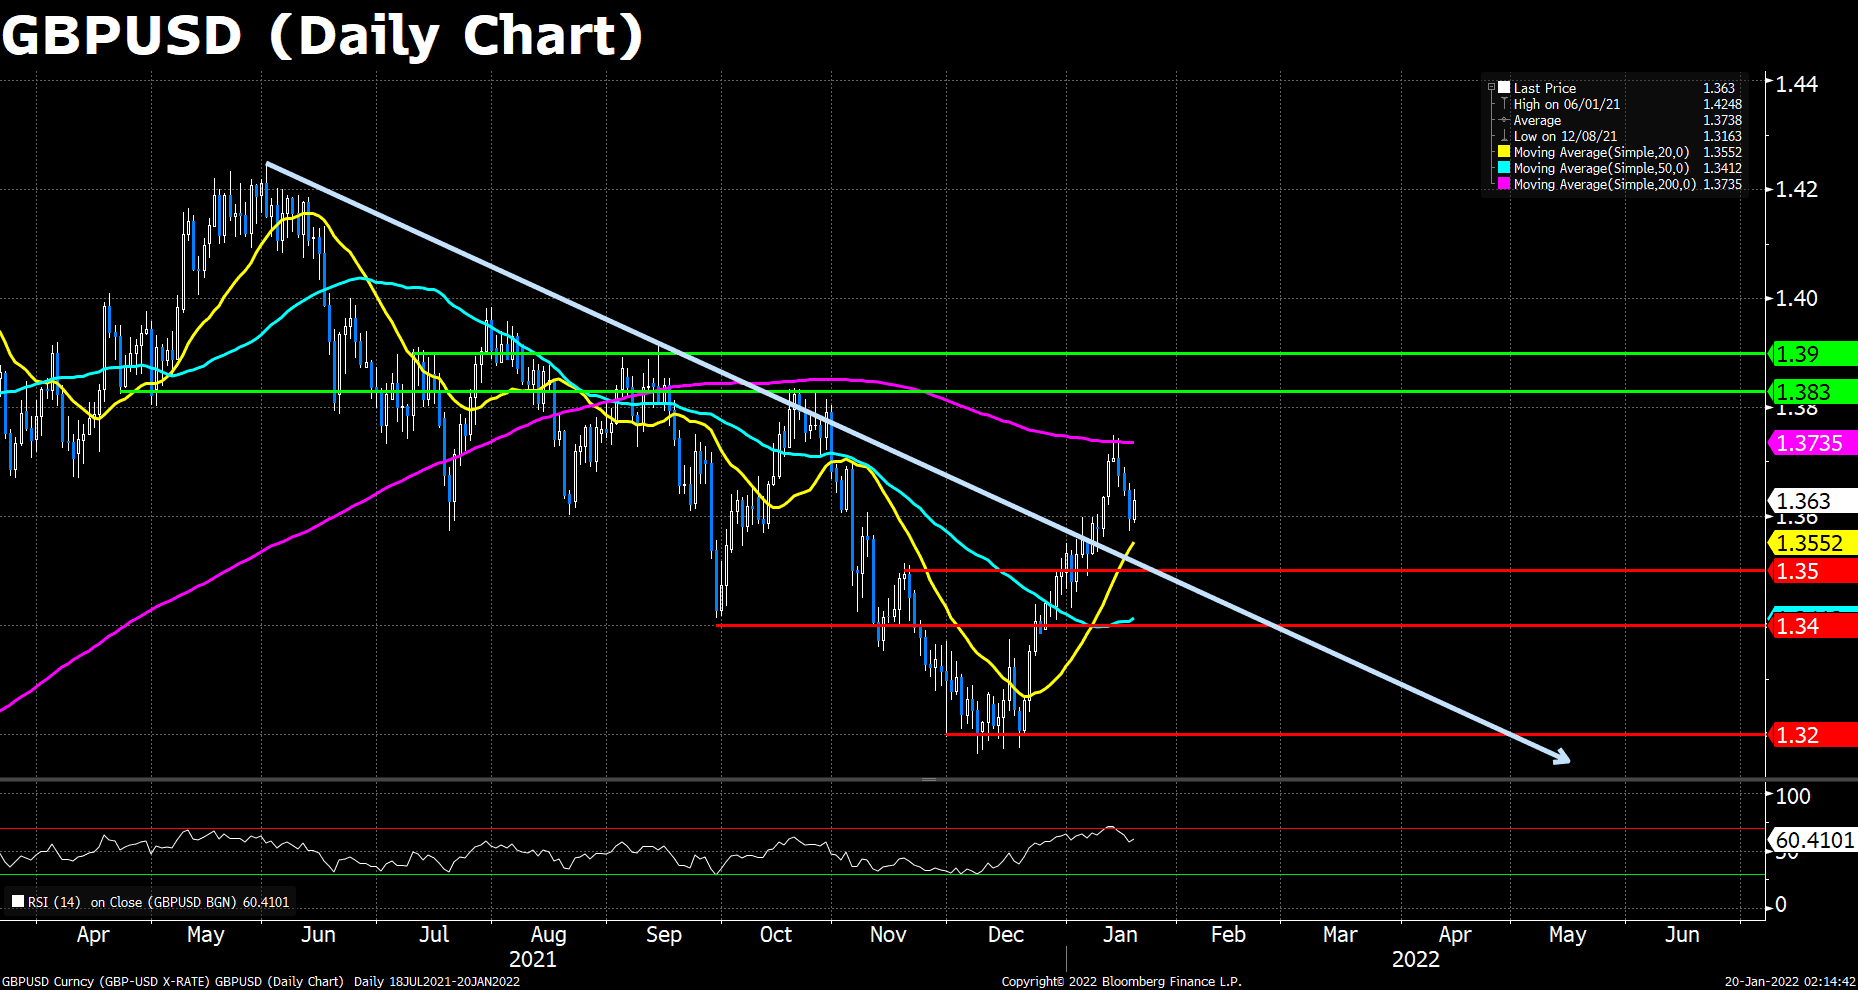
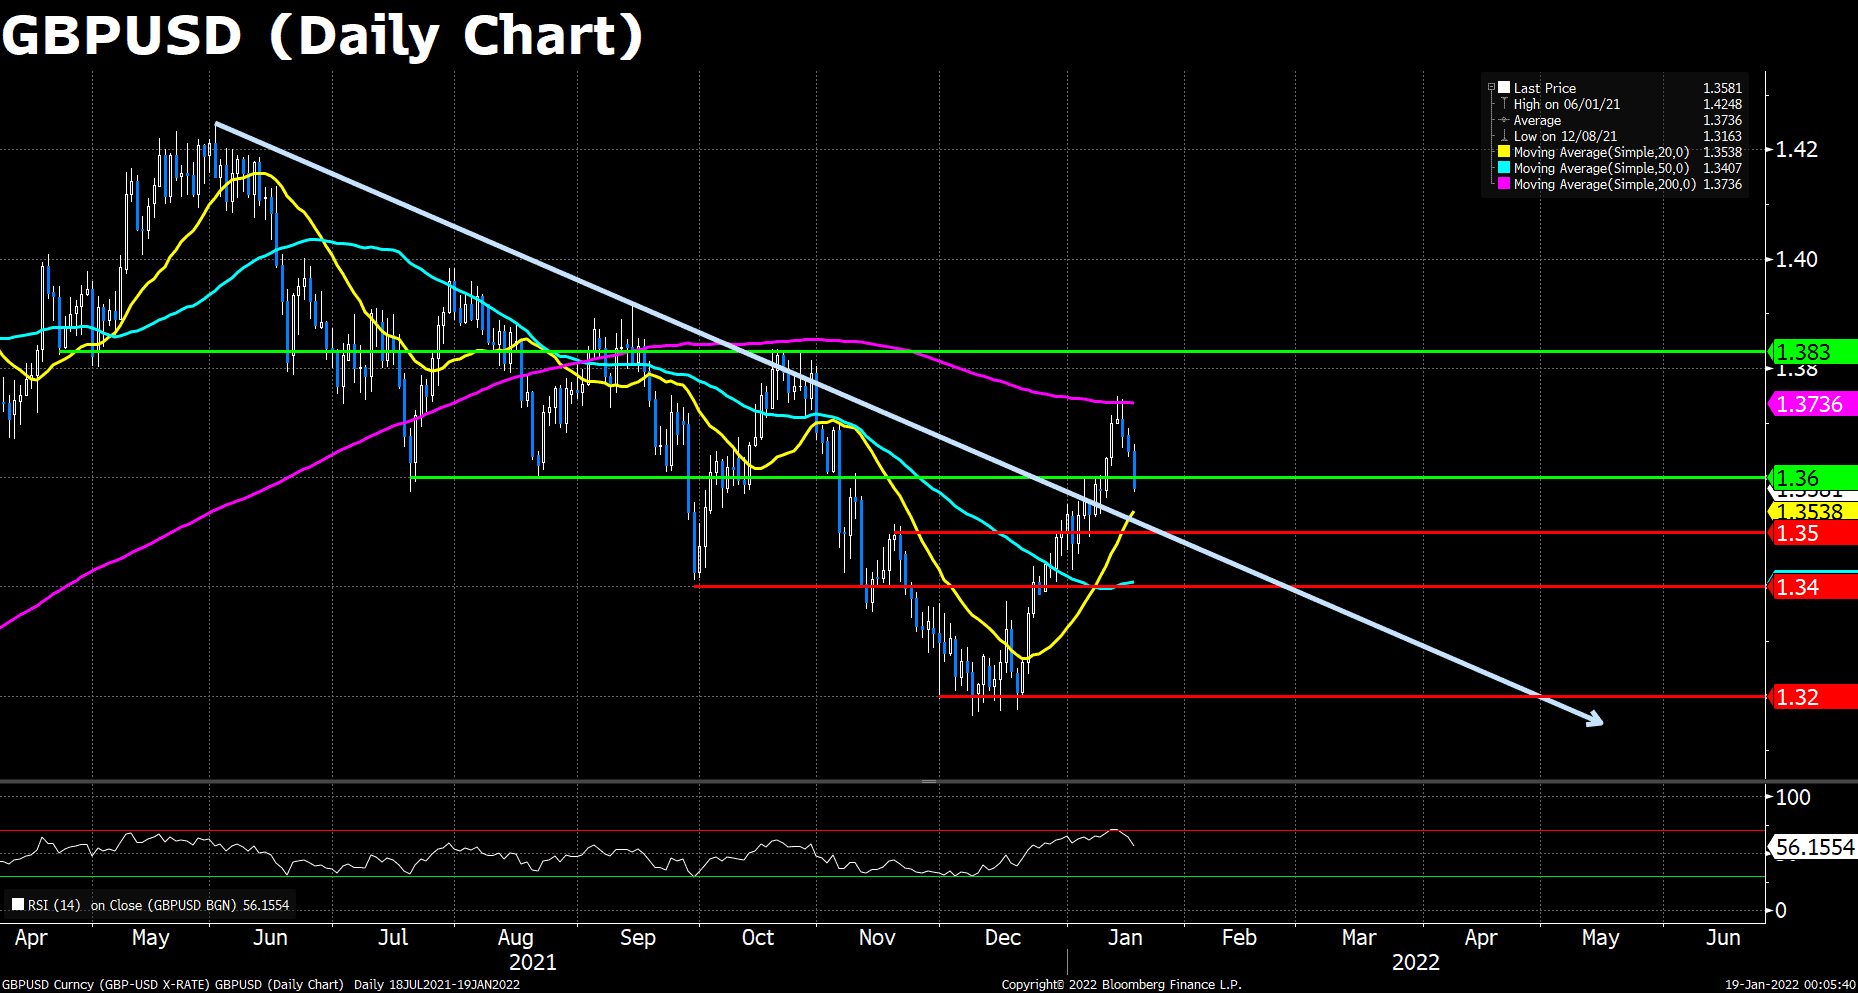
Cable traded sidelined on Wednesday ahead of the Fed monetary policy statement release. At the time of writing, the pair is settling at 1.3522. Overall risk sentiment is upbeat, as portrayed by European stock indices closed in the green, and US benchmarks opened higher earlier the day. However, despite market’s optimism, investors should be aware of geopolitical and central bank news crossing the wires, as we are now getting deeper into the Central Bank week, and the Ukraine – Russia conflict looms.
On the technical front, the GBP/USD pair is downward biased, with the RSI unable to regain 50 during today’s rally, and the long-term downtrend still tripping the pair’s steps to the upside. However, the fact that price action broke above the 50-DMA, which lies at 1.3423, suggests that the Pound might be subject to fresh demands in the near term. Nevertheless, unless the GBP/USD breaks firmly above the downtrend with a positive RSI figure, then that would open the door for further gains.
Resistance: 1..3600, 1.3830, 1.3900
Support: 1.3400, 1.3200
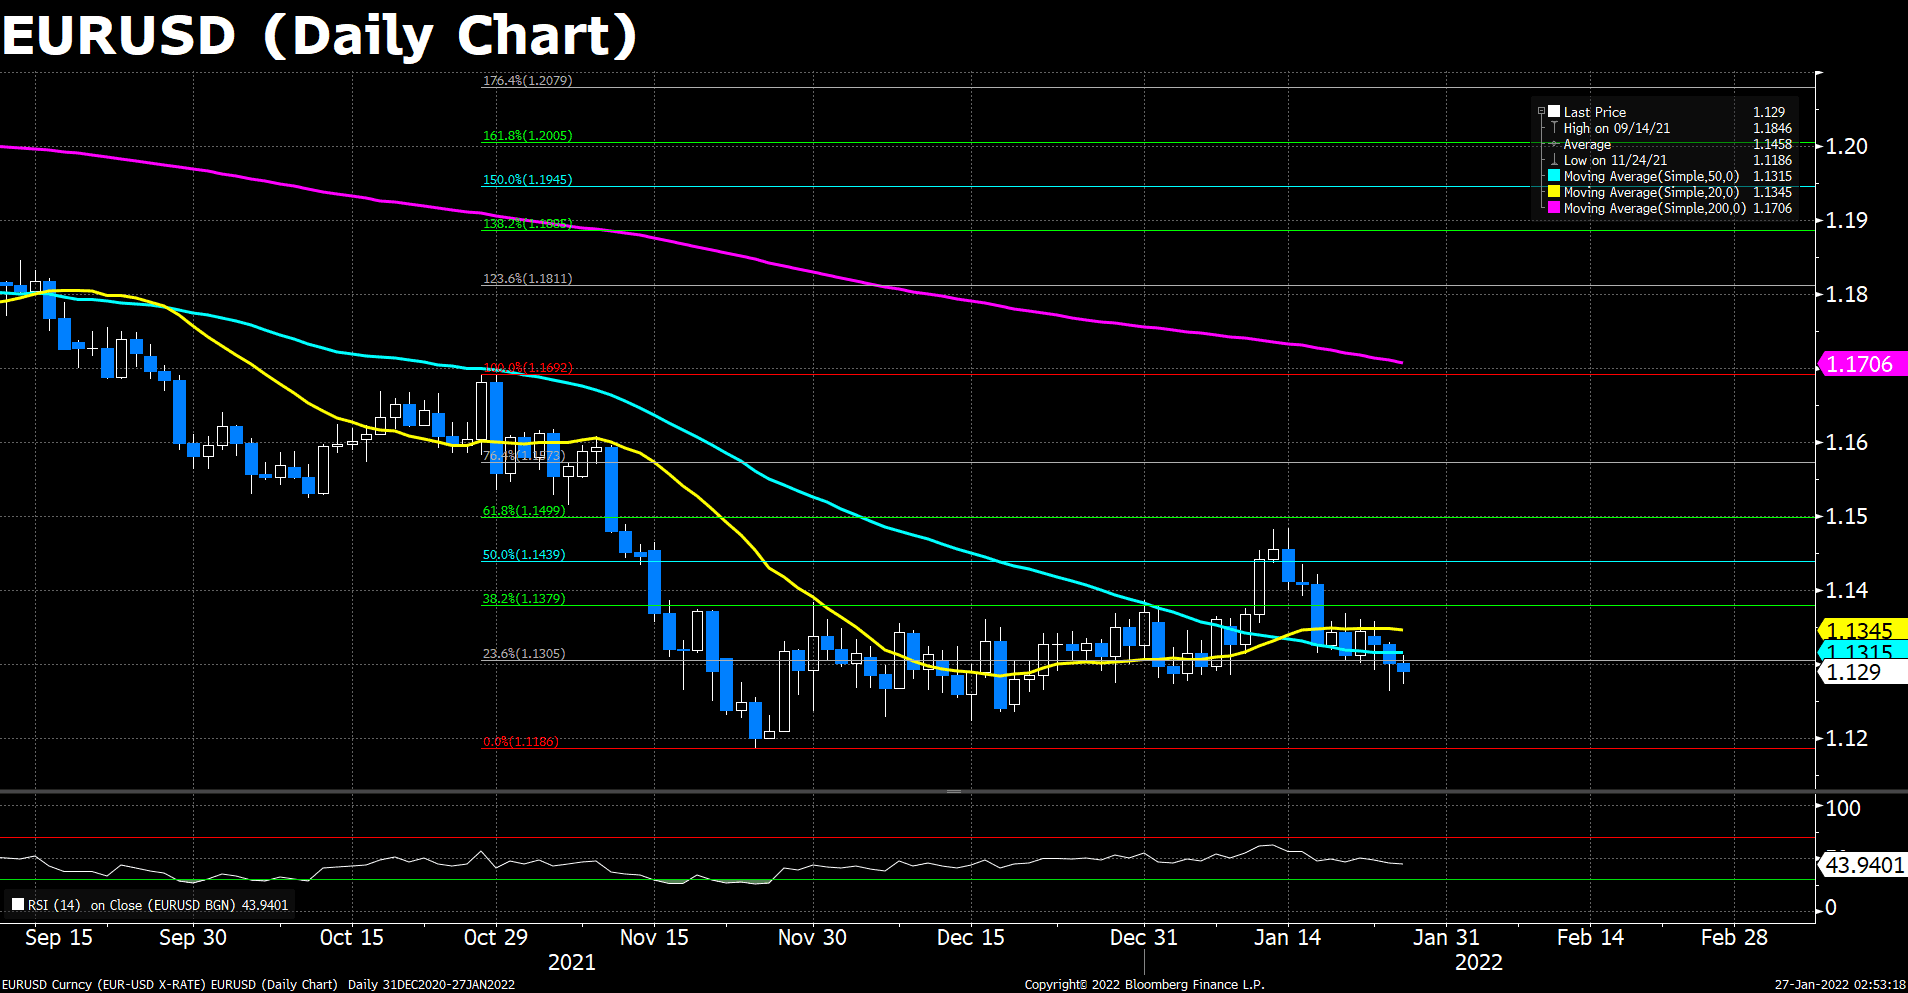
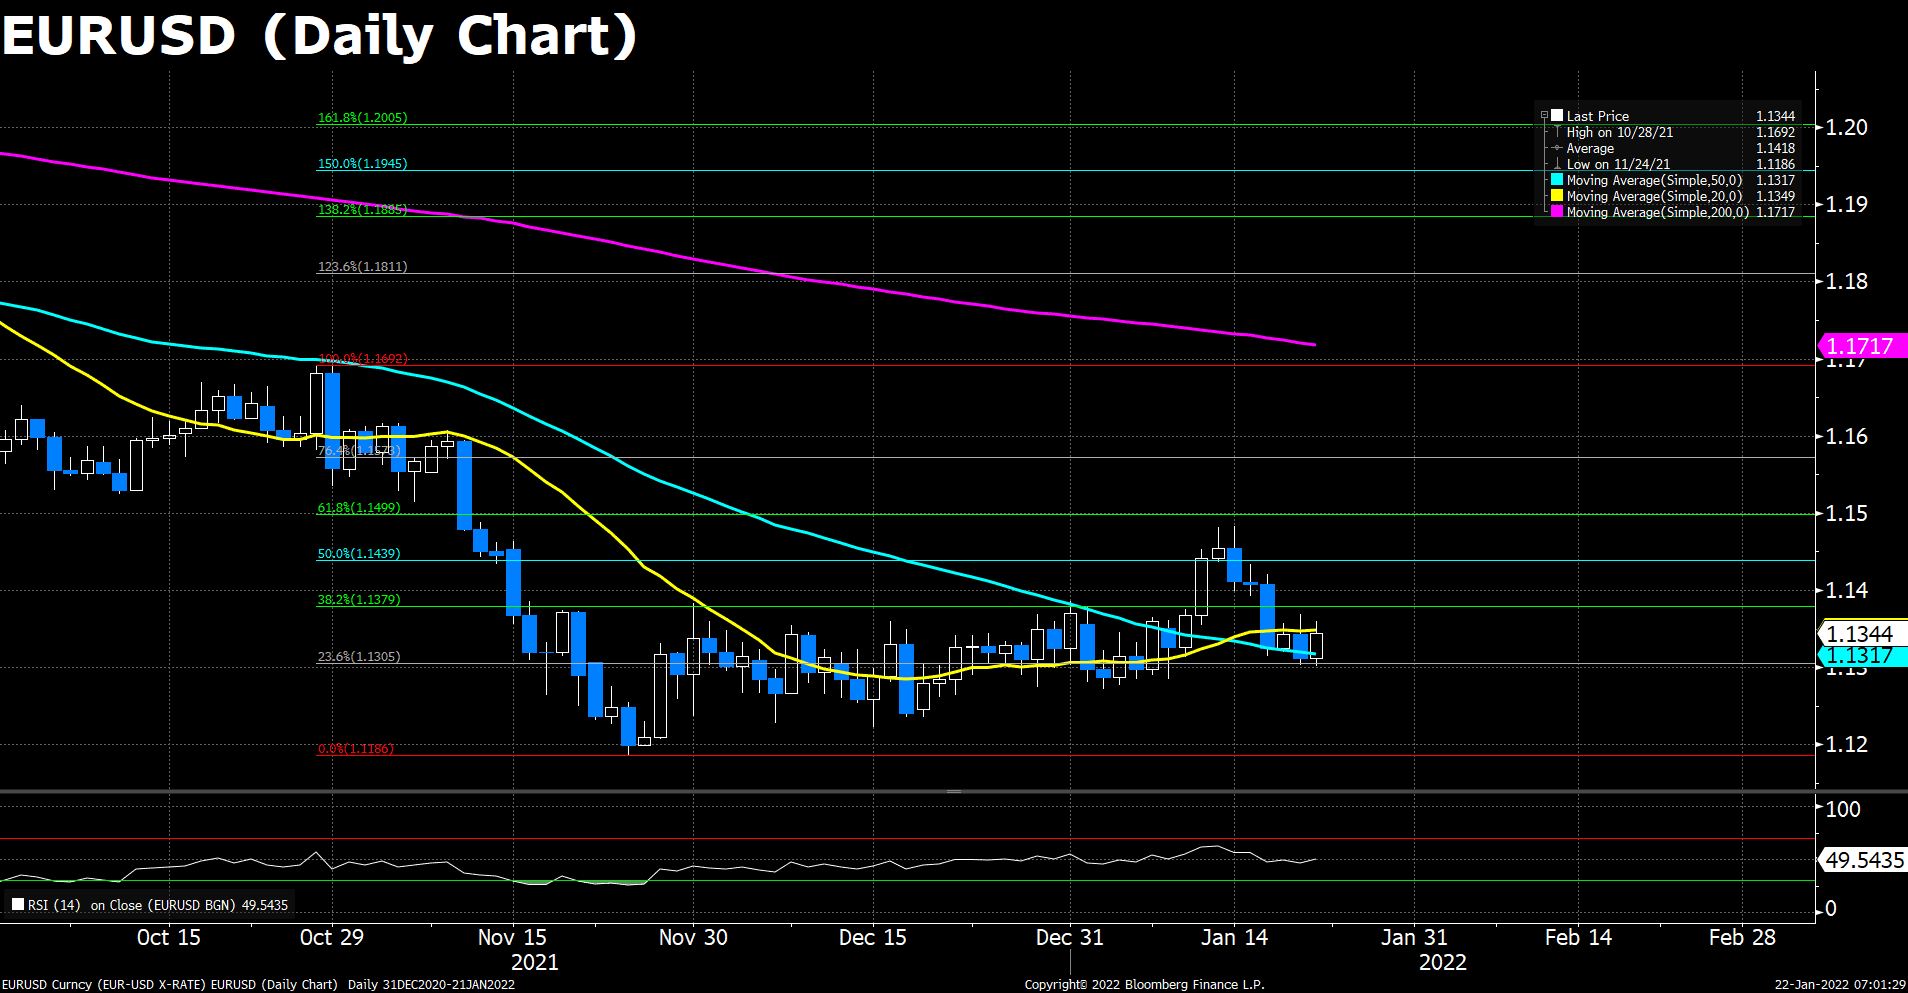
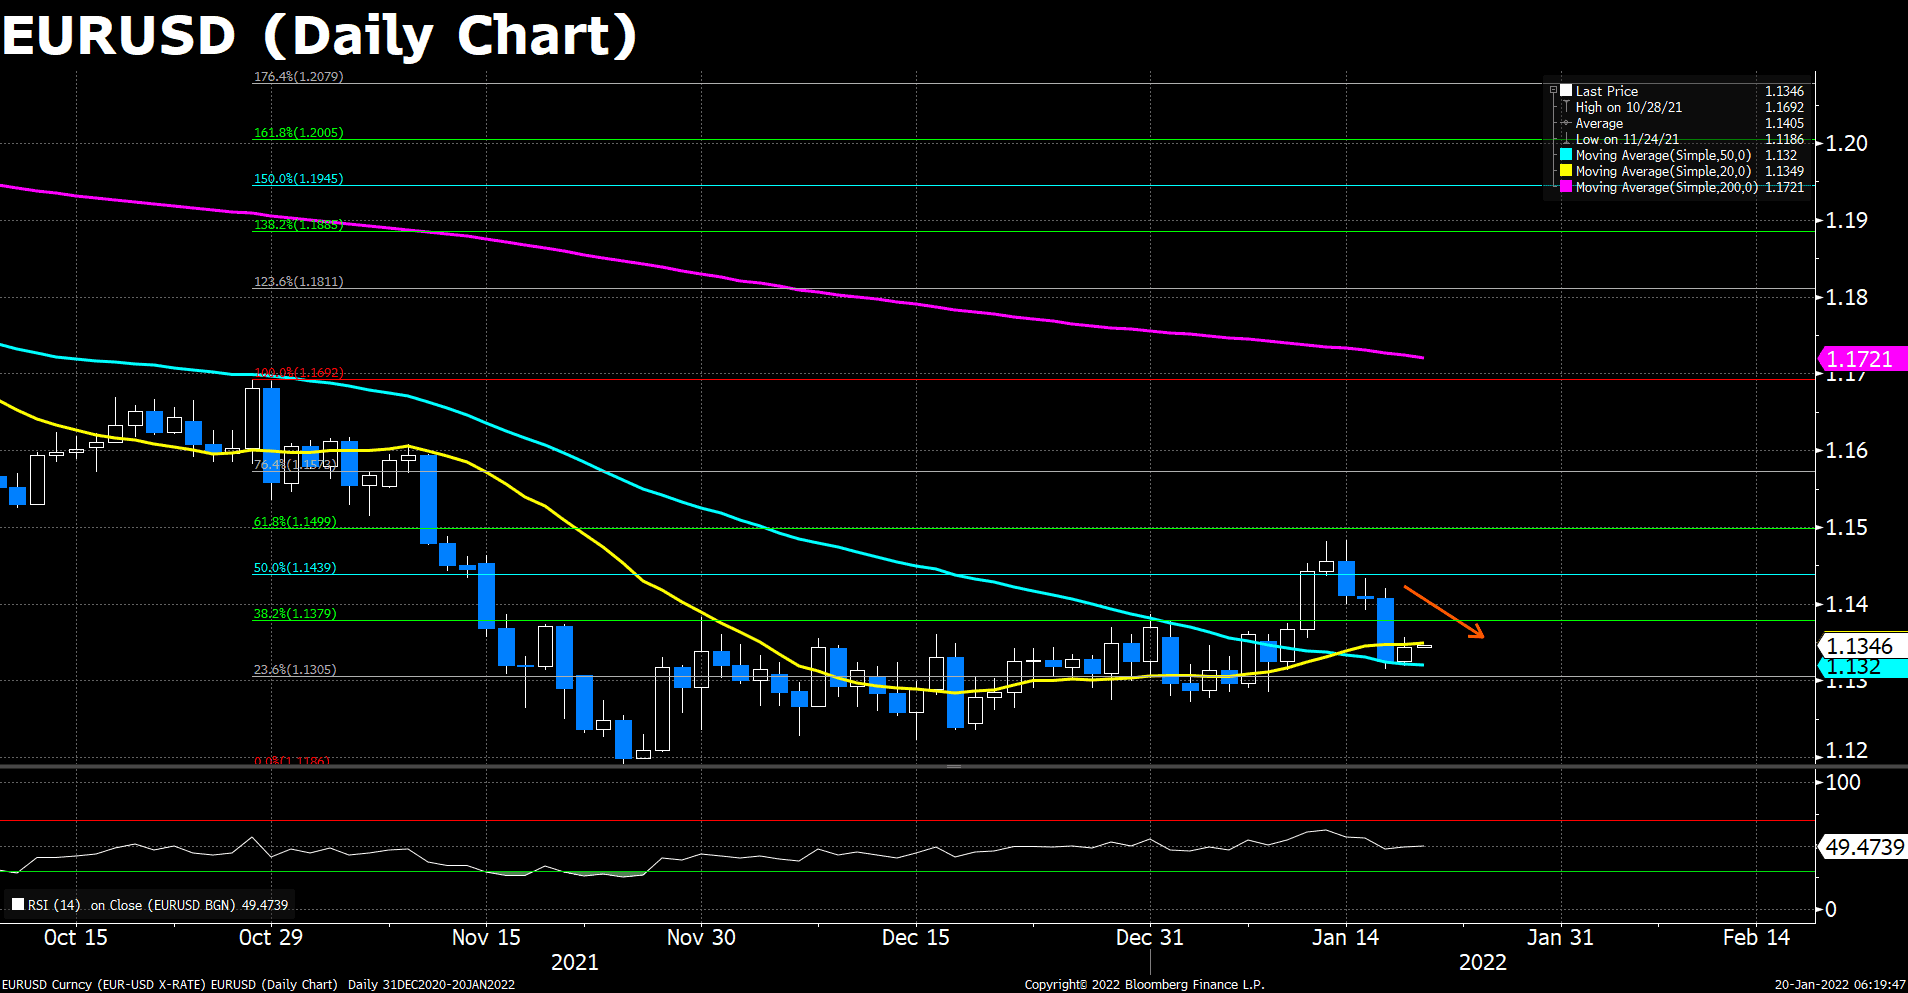
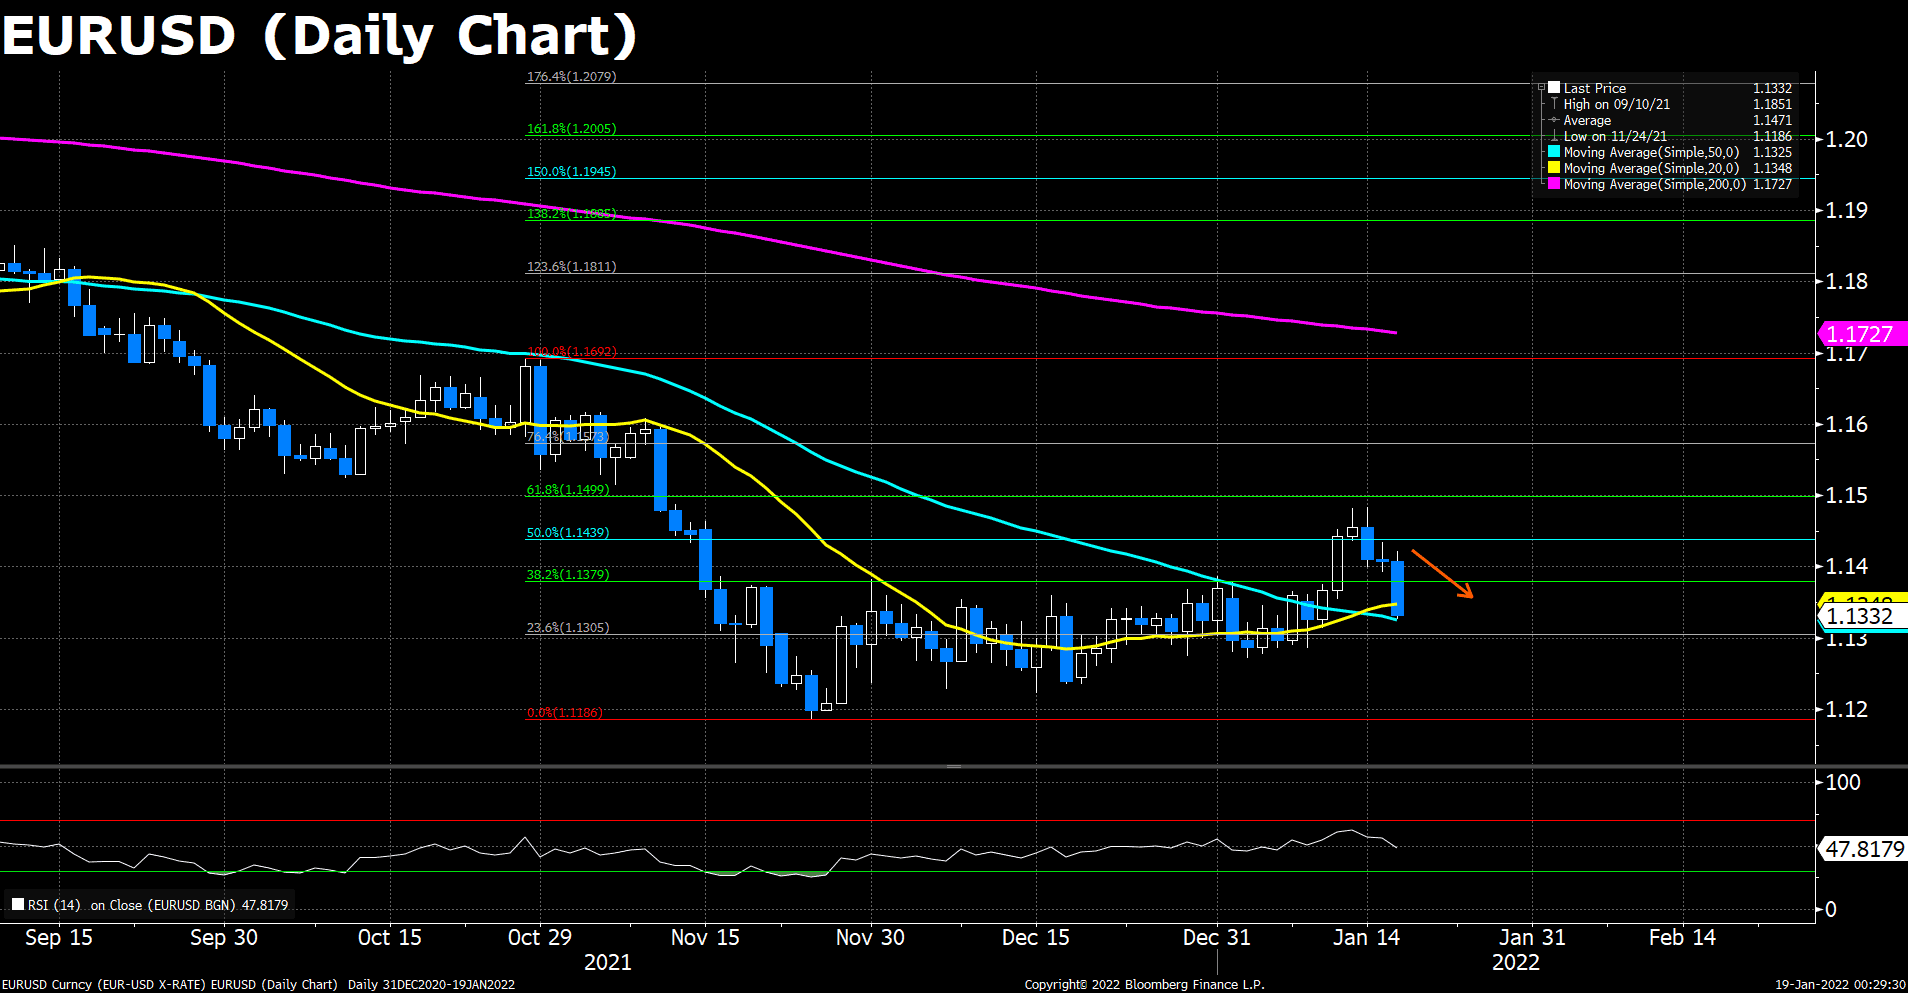
The Euro pair hovered around the familiar levels at the first half of the trading day and slid over 30 pips as the time passed into the European session. The pair now trades at 1.1294, 20 pips recovered from today’s dip owing to the optimistic sentiments during the New York trading session ahead of the Fed’s meeting. In the meantime, the Dollar Index advances some 0.12%, clings to 96.06, as the Fed looms. Furthermore, the US 10-year Treasury yield is flat, around 1.77%.
As to technical, the Euro pair is downward biased, with the RSI reads 43.94. The 50 DMA along with the 23.6% Fibonacci at around 1.1310 is the first resistance level and would be under pressure when the Fed releases its monetary policy statement. If that level is breached, the next resistance would be resistance at 1.1380, where the 38.2% Fibonacci sits. On the flip side, the pair is expected to get underpinned slightly around the 1.1230 area, followed by 2021 yearly low at around 1.1200.
Resistance: 1.1310, 1.1440, 1.1500
Support: 1.1230, 1.1200
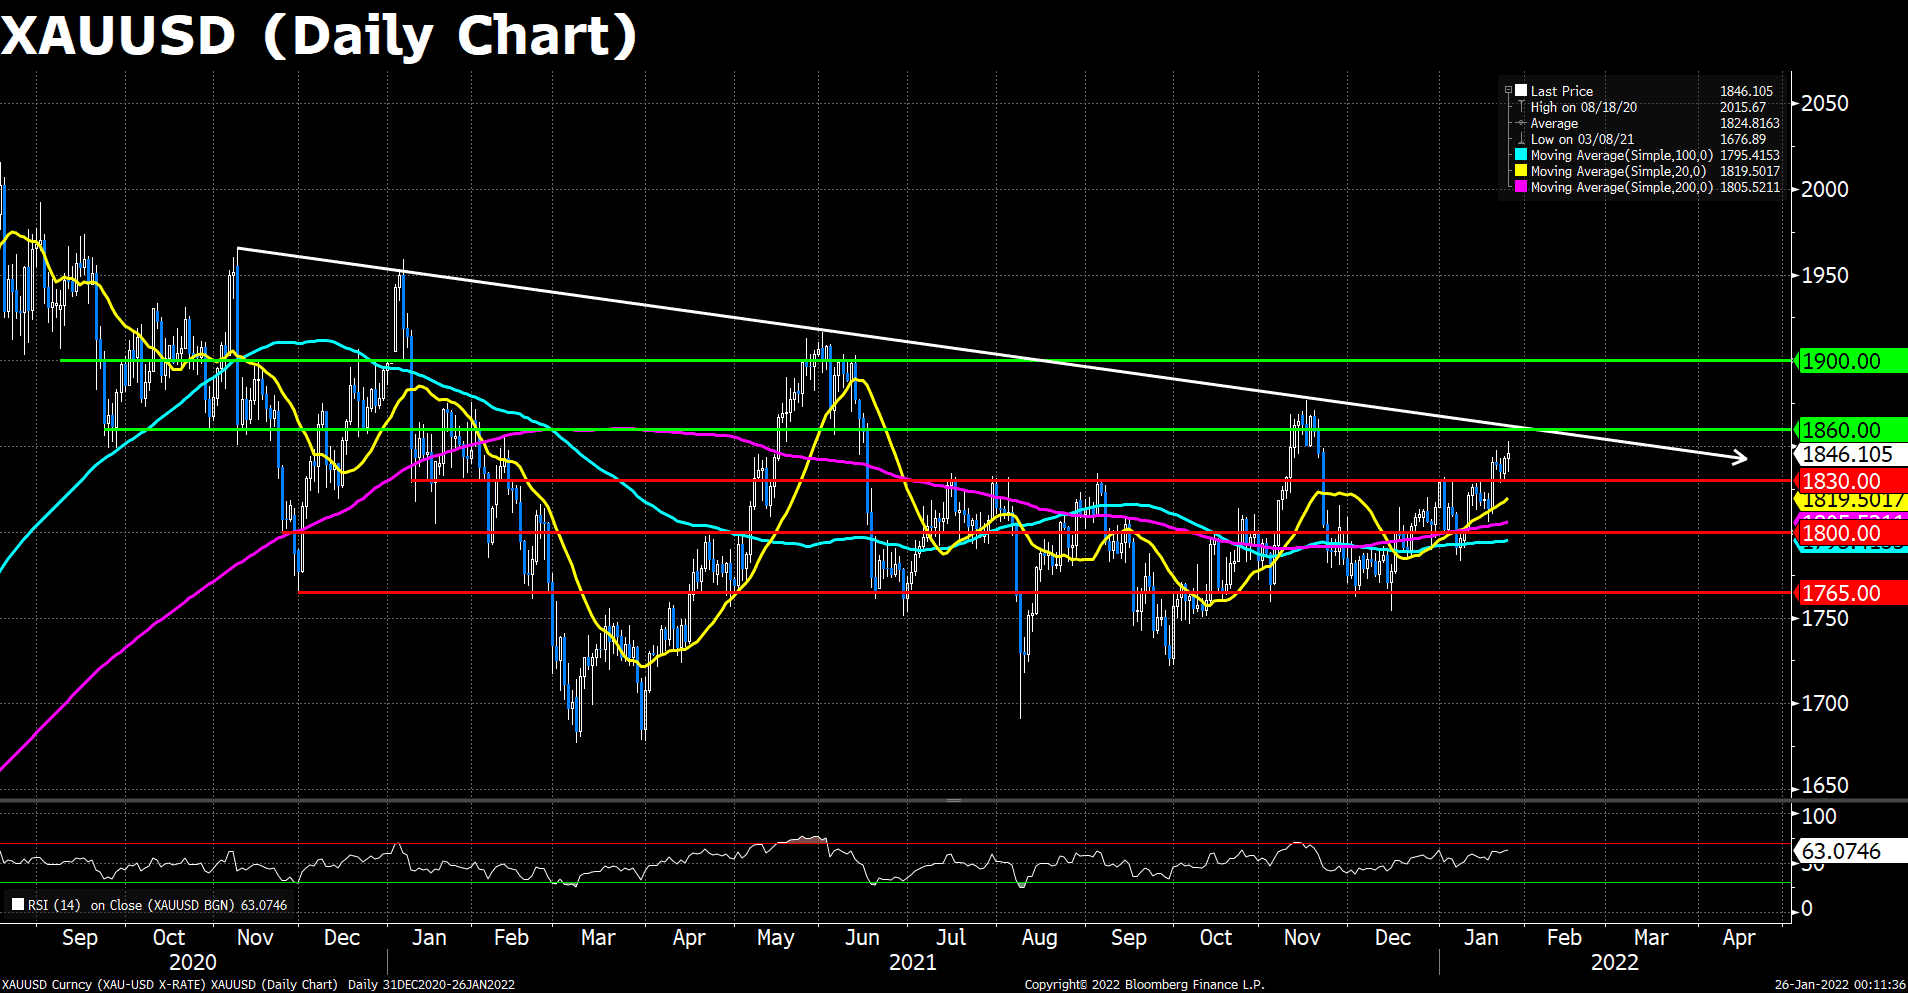
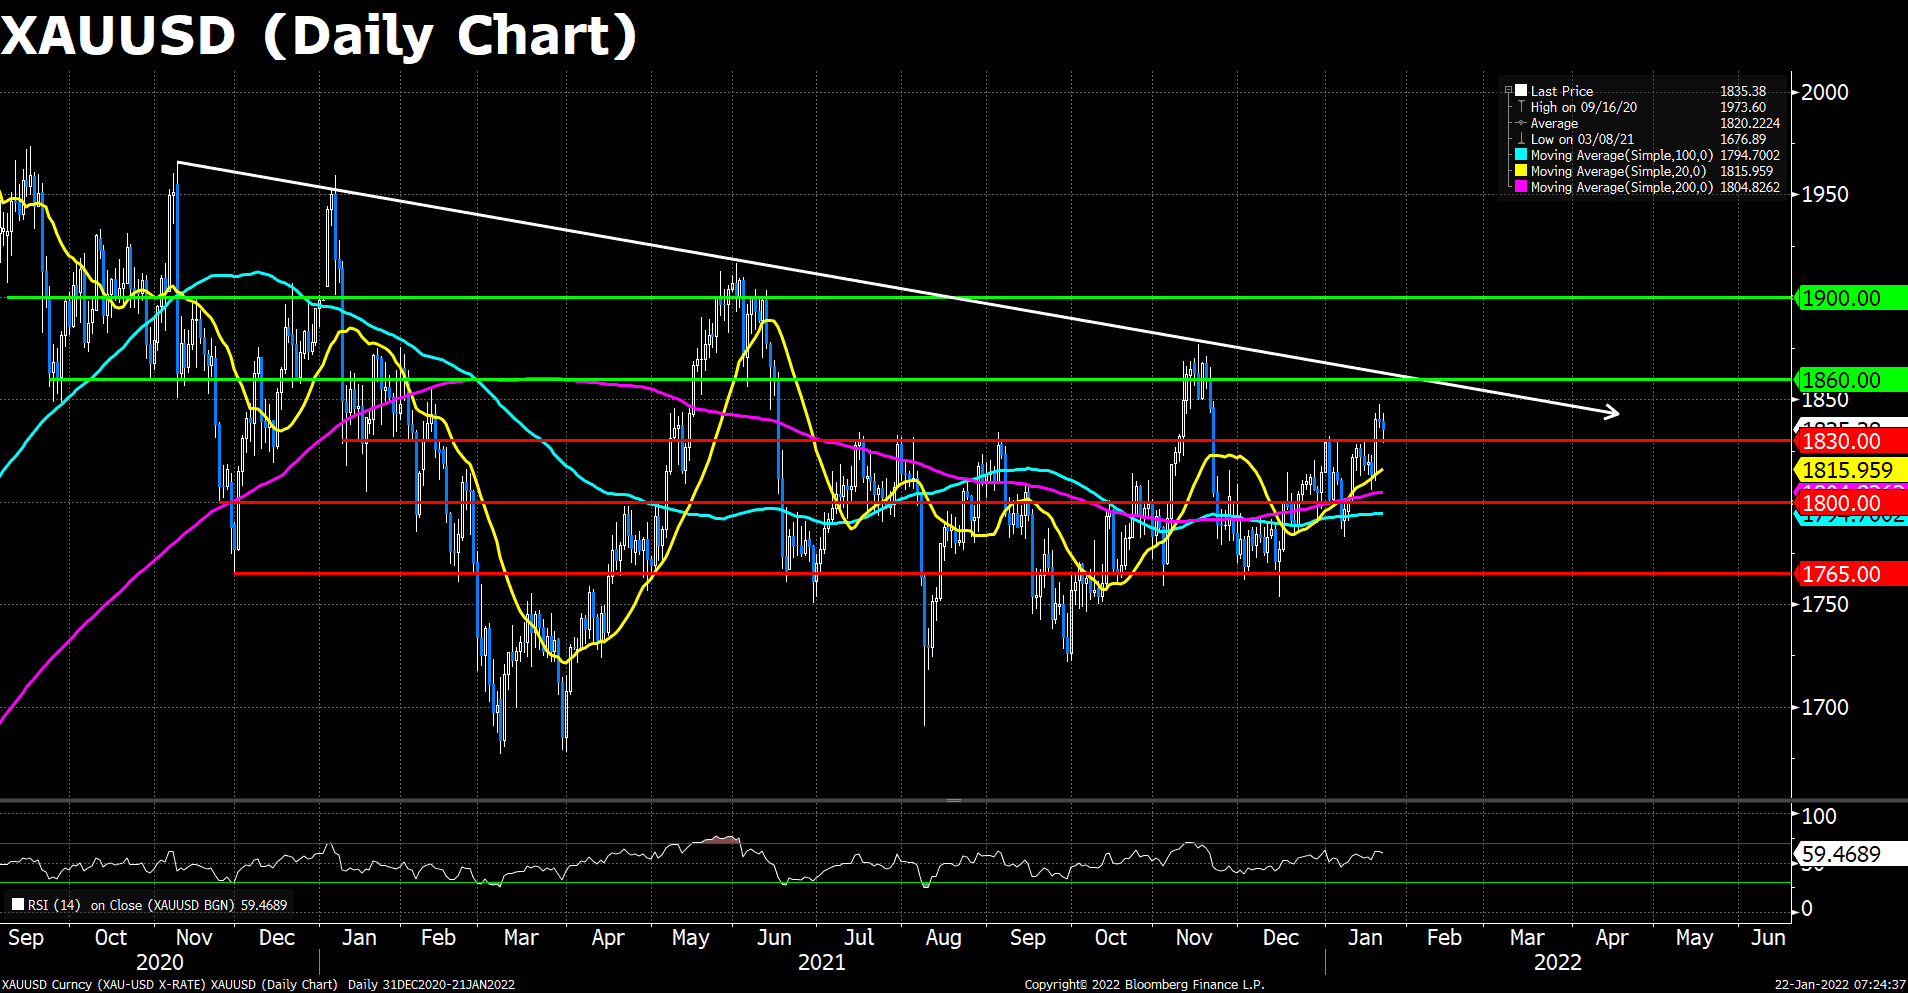
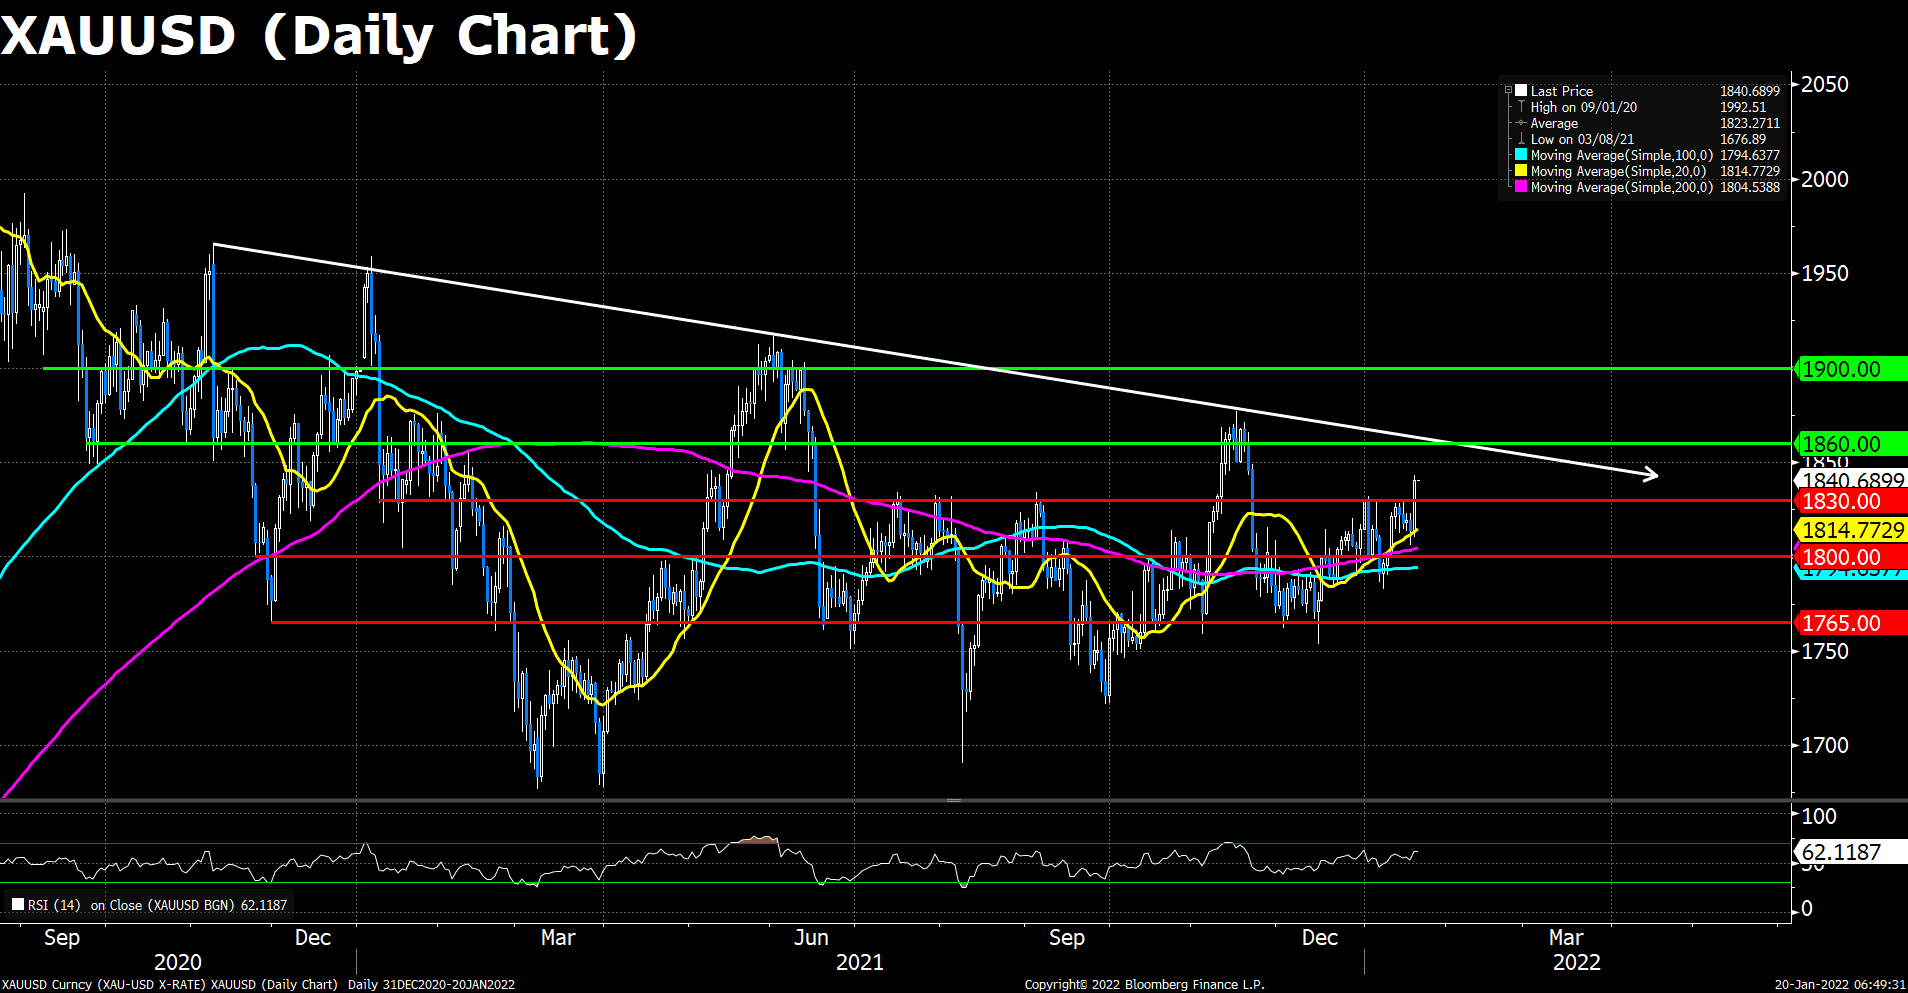
XAUUSD (Daily Chart)
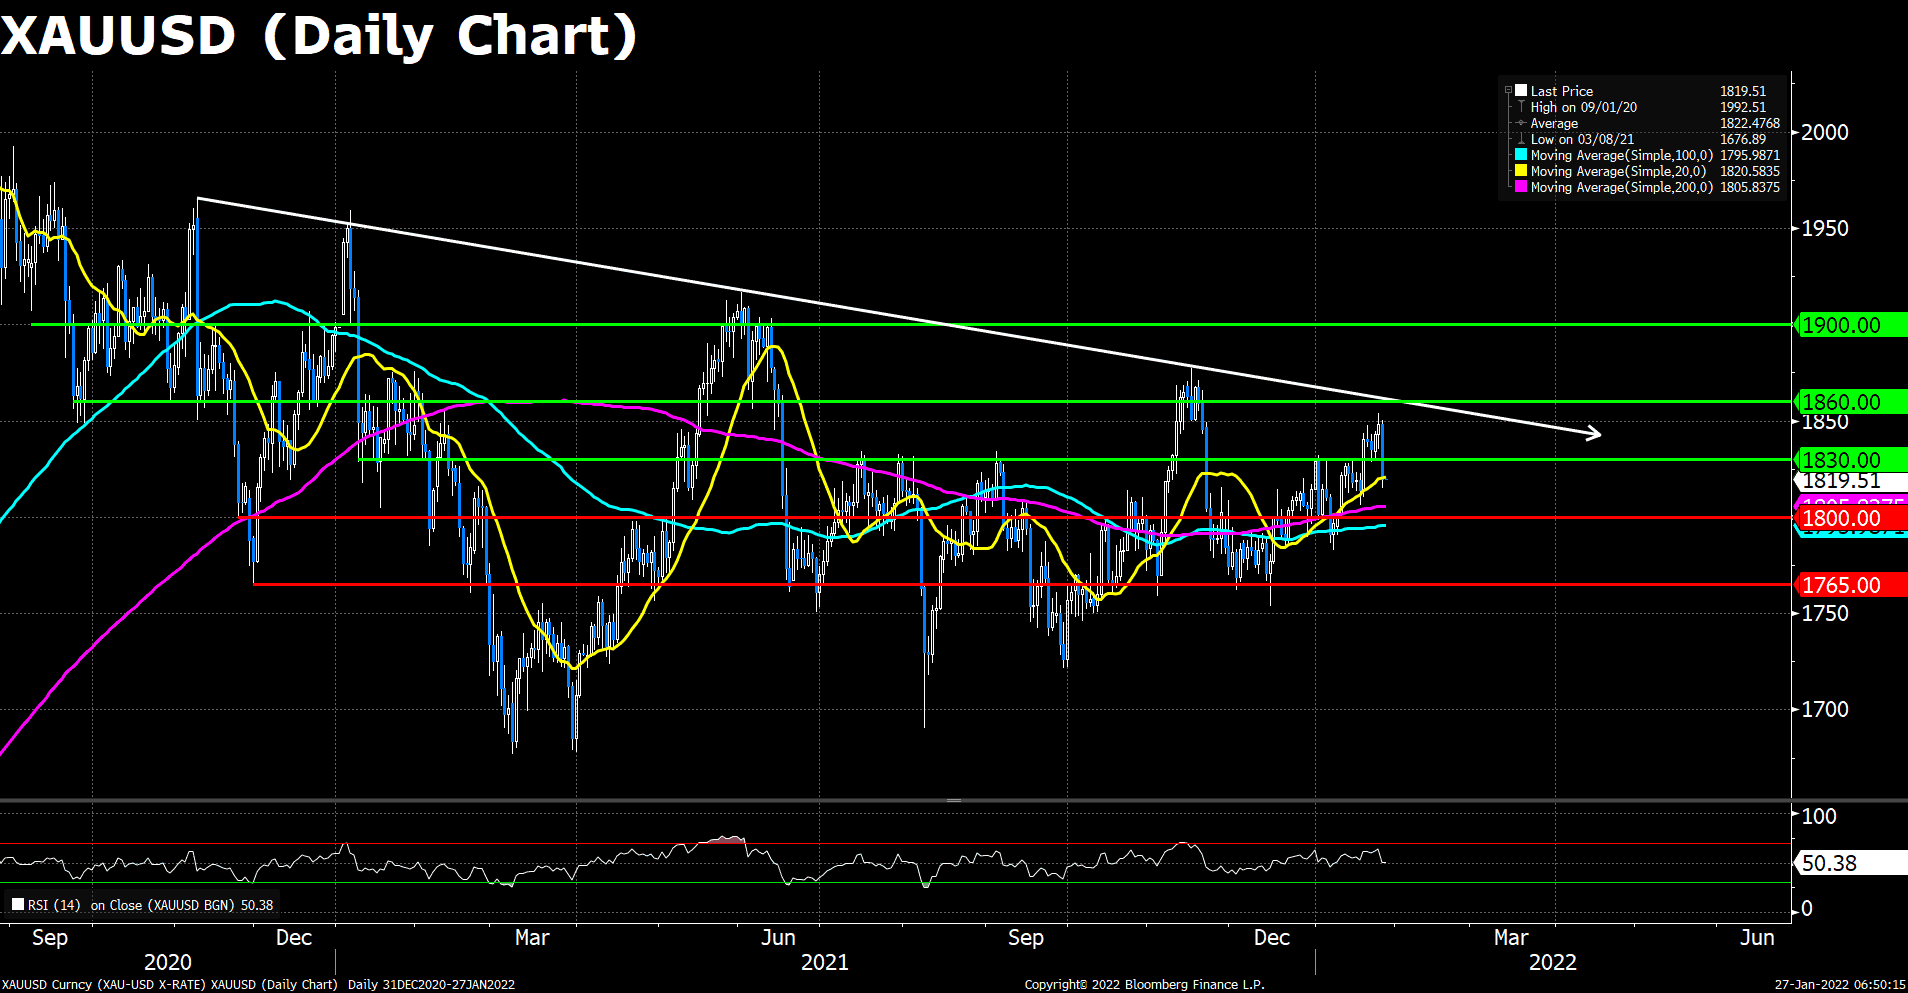
Gold is moving towards the close and down some 1.65% after falling from a $1,850.11 high to test a low of $1,814.98. The drop came on the back of a hawkish twist at the Federal Reserve event on Wednesday. Initially, the FOMC Statement offered little in the way of surprising truths with regards to the Fed’s path of the balance sheet runoff and rate increases and markets responded in kind with little enthusiasm. However, volatility kicked in just ahead of the Fed’s chair presser. Jerome Powell surprised markets with a hawkish pivot, commenting that the Fed could raise rates at every meeting if need be. Additionally, Powell said in the presser that the Fed could move faster and sooner than they did the last time which helped the US dollar to extend on pre presser gains
From the technical perspective, gold pared all of its gains this week and even dived further below the key $1,830 threshold. The pair’s outlook turned sour, as the price actions fell below the short term 20-DMA, and the RSI indicator retreated back to the average line. Moreover, the long-term downward trendline leaves the yellow metal under downside risk. To the upside, the previous support $1,830 would be a fresh resistance for the yellow metal, followed by $1,860; on the flip side, gold’s first support is at $1,800. A breach of the latter would expose the next support at around $1,765, where the November lows sit.
Resistance: 1830, 1860, 1900
Support: 1800, 1765
Economic Data:
|
Currency |
Data |
Time (GMT + 8) |
Forecast |
|
|
USD |
Core Durable Goods Orders (MoM) (Dec) |
21:30 |
0.4% |
|
|
USD |
GDP (QoQ) (Q4) |
21:30 |
5.5% |
|
|
USD |
Initial Jobless Claims |
21:30 |
260 K |
|
|
USD |
Pending Home Sales (MoM) (Dec) |
23:00 |
-0.2% |
|