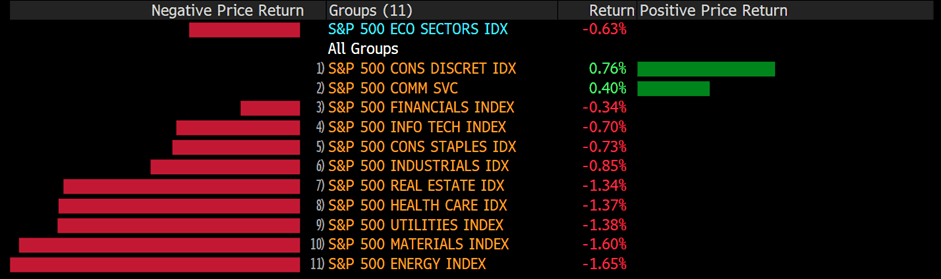
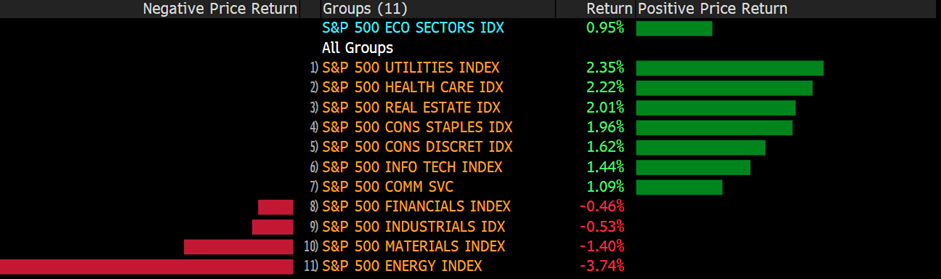
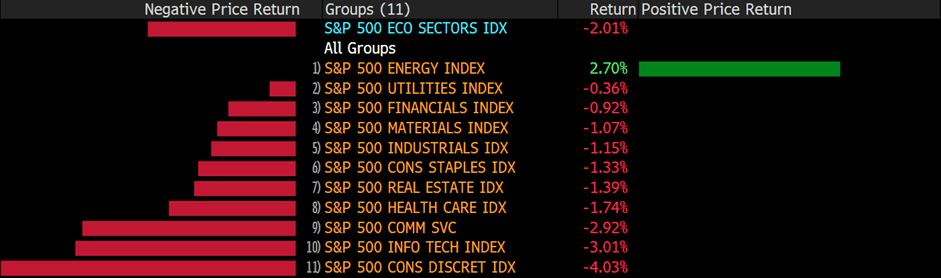
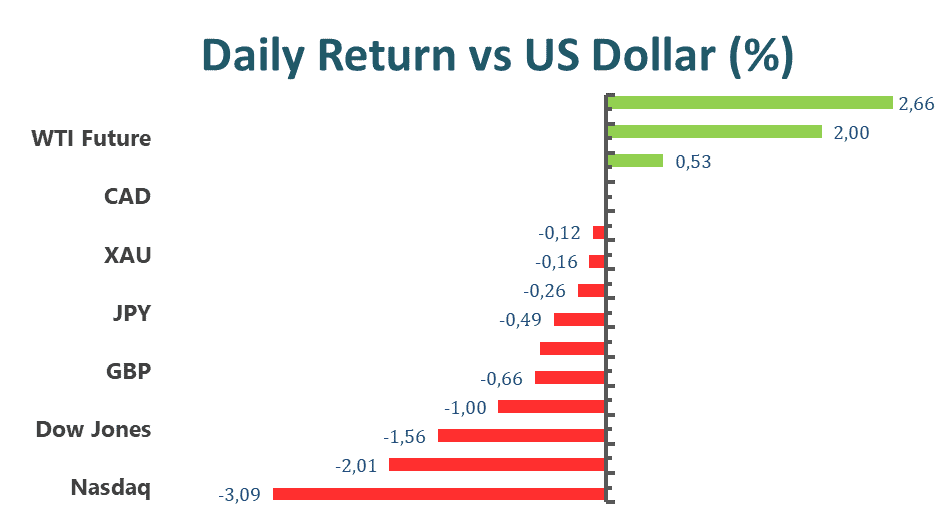
US shares fell heavily on Tuesday following the release of CB Consumer Confidence, worse- than- expected. In the meantime, markets and investors are worried about oil prices stably staying at the high price while the Fed is not interested in slowing down. The Dow Jones Industrial Average dropped 1.56%. The Nasdaq Composite slid 3%, to 11,181.54 while the S&P 500 declined 2.01%. All three major indices erased their gains from last Friday, back into the bear- market. US indices were once up more than 1% during the US session before the release of the economic data. However, as the consumer confidence fell to 98.7, it essentially indicated that investors feared a recession that might happen in the future. At the same time, the officials also mentioned that 12- month inflation expectations were 8% for June, the highest since 1987.
With the war between Russia and Ukraine remaining, NATO Secretary Jen Stoltenberg said that NATO, the most powerful military alliance, has reached a deal with Turkey to admit Finland and Sweden. Before that, Turkey was not interested in signing the agreement as the Turkish President said that he would support the Kurdish organization. The move to add both countries to members of NATO comes after Russia invades Ukraine. Countries fear becoming the next Ukraine.
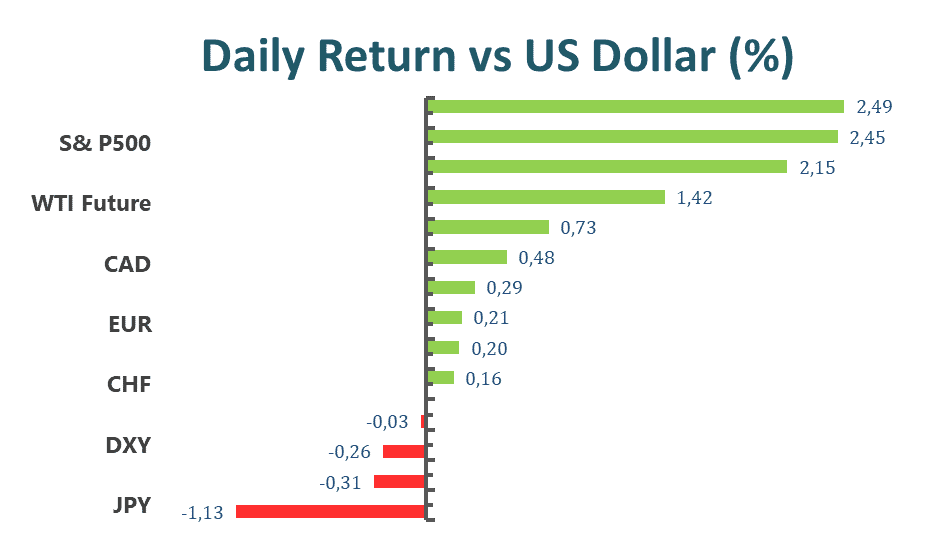
Main Pairs Movement
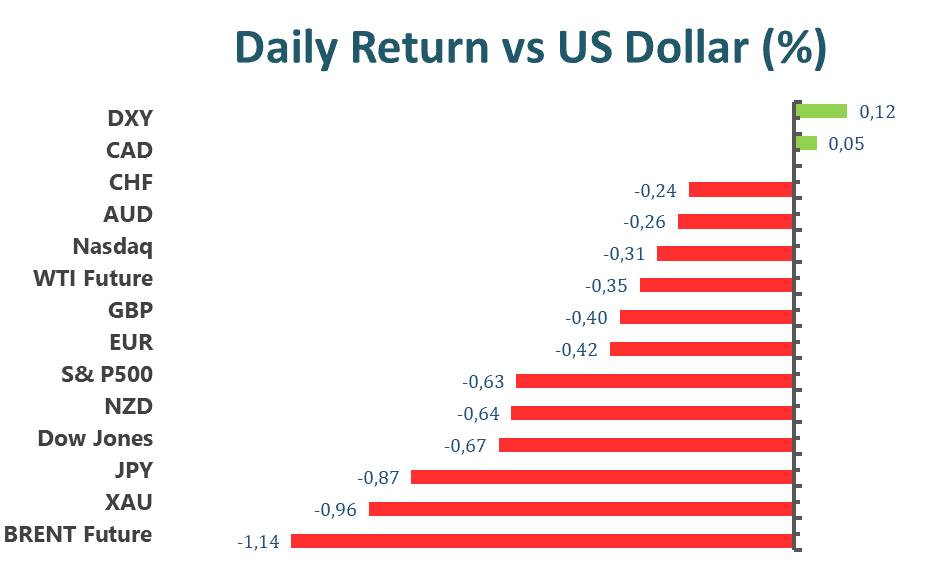
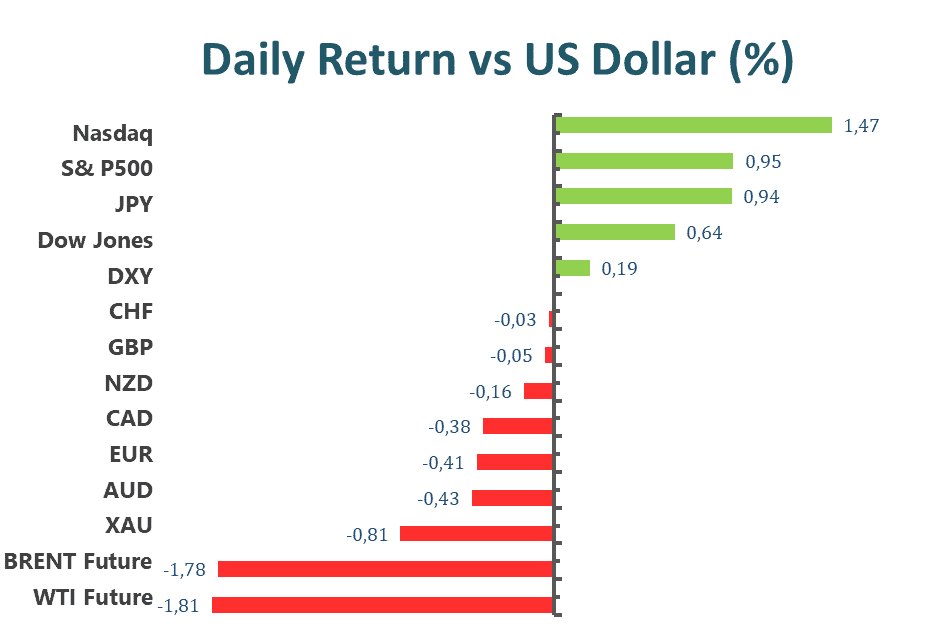
AUD/USD was down 0.23% to 0.69055 at the end of the day. The Australian dollar was relatively weak against the US dollar as the US shares fell sharply amid the risk sentiment, which came from the decline in Consumer Confidence that was released by the US.
USD/JPY advanced 0.49%, up for the third consecutive day. The Japanese Yen lost some interest from investors as the BOJ remains its monetary policy, continuously widening the gap between domestic and overseas’ yield rates. In the meantime, some news has said that the BOJ might have been saddled with as much as 600 million Yen in unrealized losses.
USD/CAD oscillated at 1.28727. The strength of the US dollar, boosted by the risk sentiment, was offset by the advance of oil prices, highly related to the Canadian dollar.
WTI was up 1.84%, bullish attacking for the third- consecutive day as the sanctions on Russia remain and the chatters surrounding OPEC+ forecasts for 2022 market surplus.
Technical Analysis
EURUSD (4-Hour Chart)
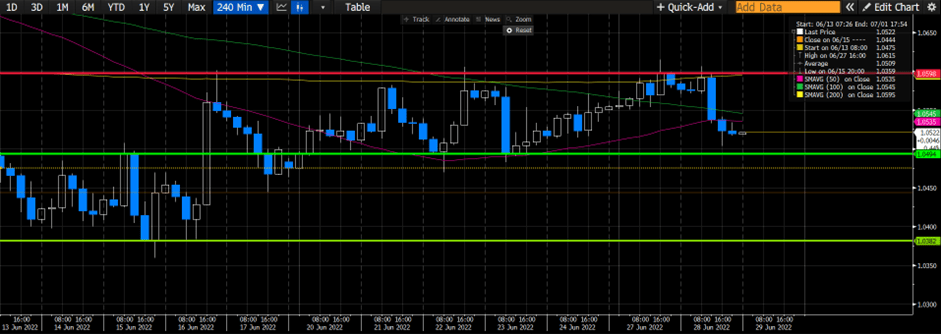
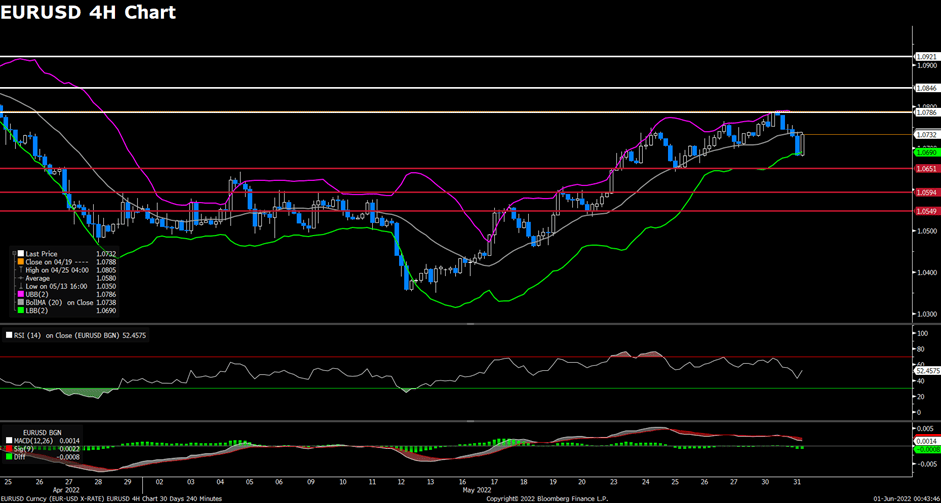
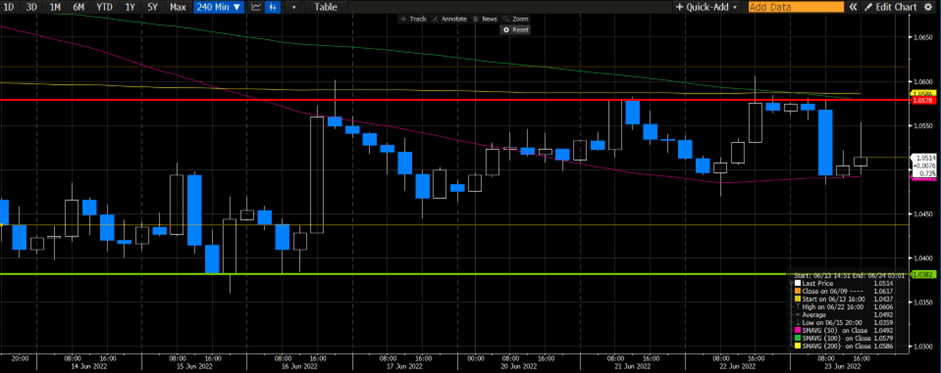
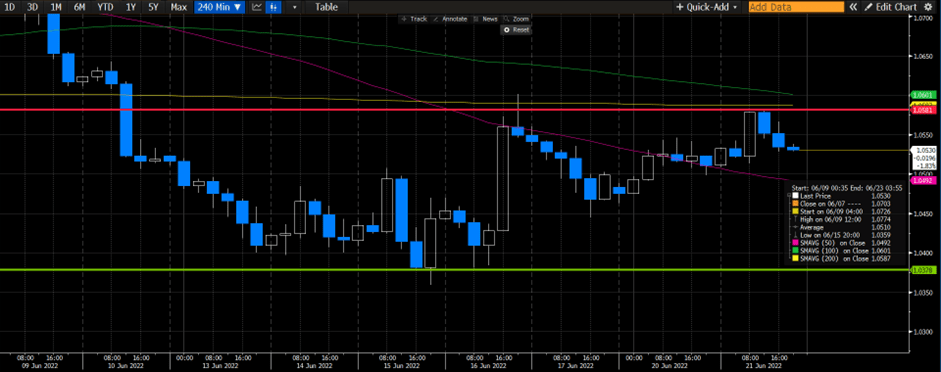
EURUSD lost 0.62% over the previous trading day. The Euro enjoyed a boost early during the European trading session as ECB president Lagarde reaffirms the central bank’s intent to raise interest rates by 25 basis points in July; furthermore, president Lagarde hints at more aggressive interest rate hikes if the central bank sees fit. On the economic docket, both ECB president Lagarde and Fed chair Jerome Powell are scheduled to speak on the 29th. U.S. GDP for Q1 is also scheduled to be released during the American trading session.
On the technical side, EURUSD retreated from our previously estimated resistance level of 1.0598 and is heading towards our projected support level of 1.0493. RSI for the pair sits at 45.7, as of writing. On the four-hour chart, EURUSD currently trades below its 50, 100, and 200-day SMA.
Resistance: 1.05754, 1.06315
Support: 1.0493
GBPUSD (4-Hour Chart)

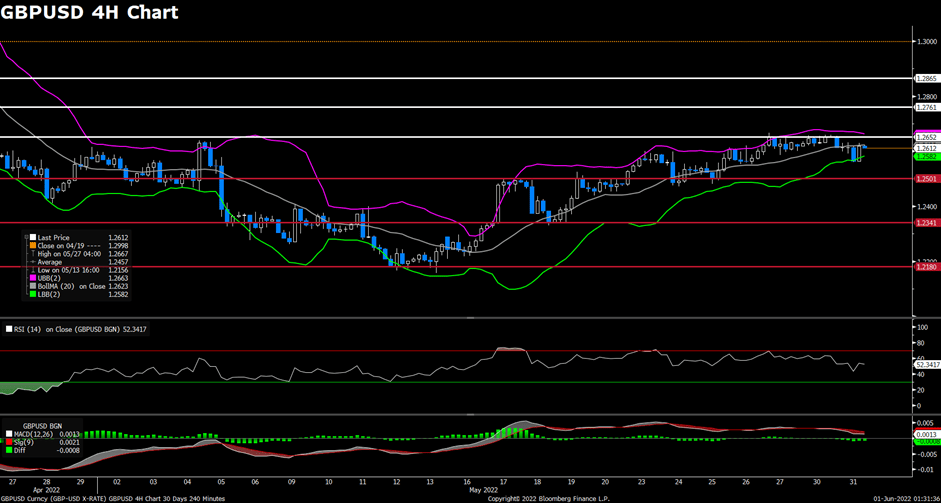
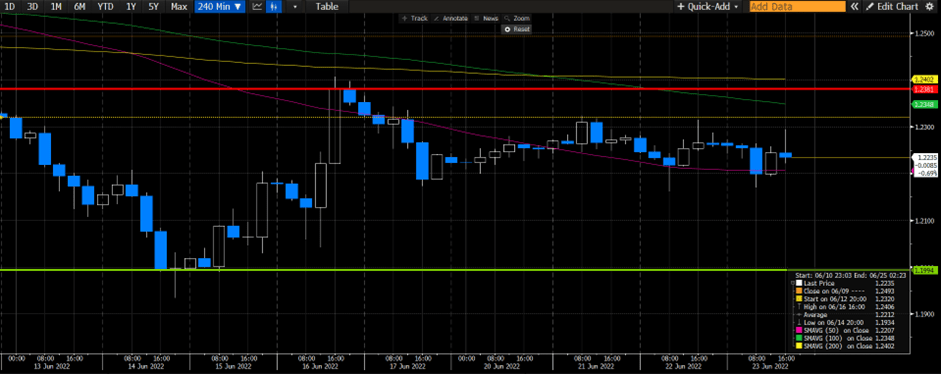
GBPUSD lost 0..68% over the previous trading day. Heightened demand for the U.S. Dollar and broader risk-averse market sentiment have sent the U.S. Greenback higher. Market participants will be closely watching the U.S. GDP release and Fed chair Jerome Powell’s speech on the 29th. On the other hand, members of parliament have voted in favour of overturning a previously agreed Brexit deal, the Northern Ireland Protocol.
On the technical side, GBPUSD is trading towards our previously estimated support level of around the 1.2173 price region. Resistance at 1.2381 remains firmly intact. RSI for the pair sits at 40.52, as of writing. On the four-hour chart, GBPUSD currently trades below its 50, 100, and 200-day SMA.
Resistance: 1.2381
Support: 1.2173, 1.20824
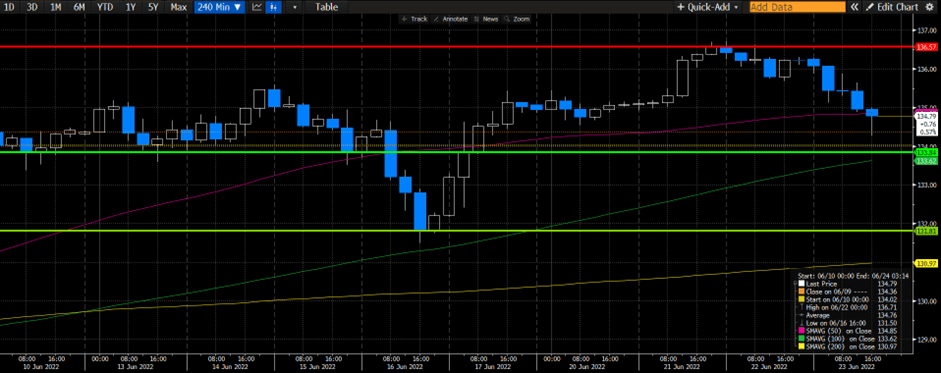
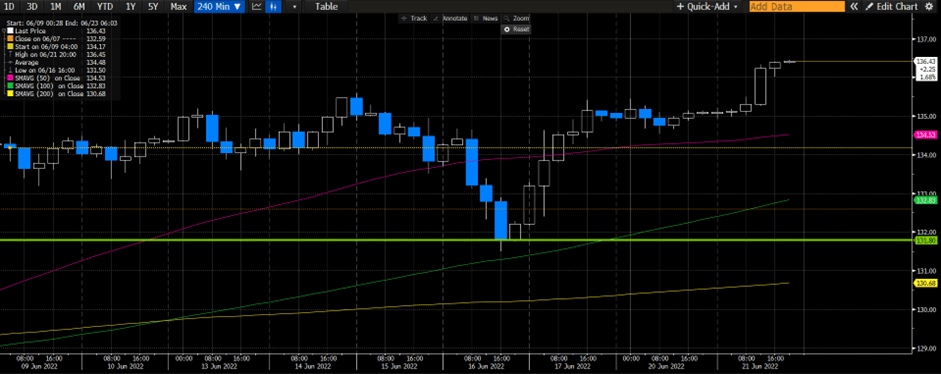
USDJPY (4-Hour Chart)

USDJPY rose 0.49% over the previous trading day. Demand for the U.S. Dollar returned as market participants remain risk-averse. The upbeat U.S. durable goods orders, unexpectedly rose 0.7% in May. This could lead to reduced chances of the Fed hiking rates at a more aggressive rate. U.S. GDP and Fed Chairman Jerome Powell’s speech tomorrow could provide price action for the pair as the short-term bullish movement of the pair remains well fueled.
On the technical side, USDJPY has once again begun its march upwards toward our previously estimated resistance level of 136.57. Our previously estimated support level of 134.6 was successfully defended. RSI for the pair sits at 64.94, as of writing. On the four-hour chart, USDJPY currently trades above its 50, 100, and 200-day SMA.
Resistance: 136.57
Support: 134.6
Economic Data
| Currency | Data | Time (GMT + 8) | Forecast |
| AUD | Retail Sales (May) | 09:30 | 0.4% |
| GBP | BoE Gov Bailey Speaks | 19:35 | – |
| USD | GDP (Q1) | 20:30 | -1.5% |
| USD | Fed Chair Powell Speaks | 21:00 | – |
| EUR | ECB President Lagarde Speaks | 21:00 | – |