Wall Street Weighs Debt Ceiling Deal and Fed Rate Hike Concerns Amidst Dow Jones Decline

On Tuesday, the Dow Jones Industrial Average experienced a decline as investors considered the prospects of Congress passing a tentative deal to raise the U.S. debt ceiling. The index closed down 50.56 points or 0.15% at 33,042.78. Meanwhile, the S&P 500 managed to eke out a minimal gain of 0.002%, closing at 4,205.52, and the Nasdaq Composite rose by 0.32% to finish at 13,017.43, albeit after paring back earlier gains.

Over the weekend, President Joe Biden and House Majority Leader Kevin McCarthy reached an agreement to raise the debt ceiling, aiming to avoid a default. The proposed bill will require support from both Republicans and Democrats to pass, with Congress scheduled to vote on it as early as Wednesday. Despite this progress, there are still hurdles to overcome in the House, as opposition within the GOP has been growing.

Investors also expressed concerns about the possibility of an interest rate hike by the Federal Reserve. According to the CME Group’s FedWatch tool, traders are currently pricing in a 68.8% chance of a rate increase next month. Richmond Fed President Tom Barkin maintained his rate forecast, stating that he hasn’t changed his position and that his forecast is among the higher ones within the central bank. The market is closely watching the Fed’s actions and how incoming inflation data will influence its decisions.

The Nasdaq received a boost from Nvidia, an artificial intelligence-related stock, which saw a nearly 3% rally. The stock reached a market capitalization of $1 trillion during Tuesday’s session, joining the elite group of companies that have achieved this milestone, following its strong earnings report from the previous week.
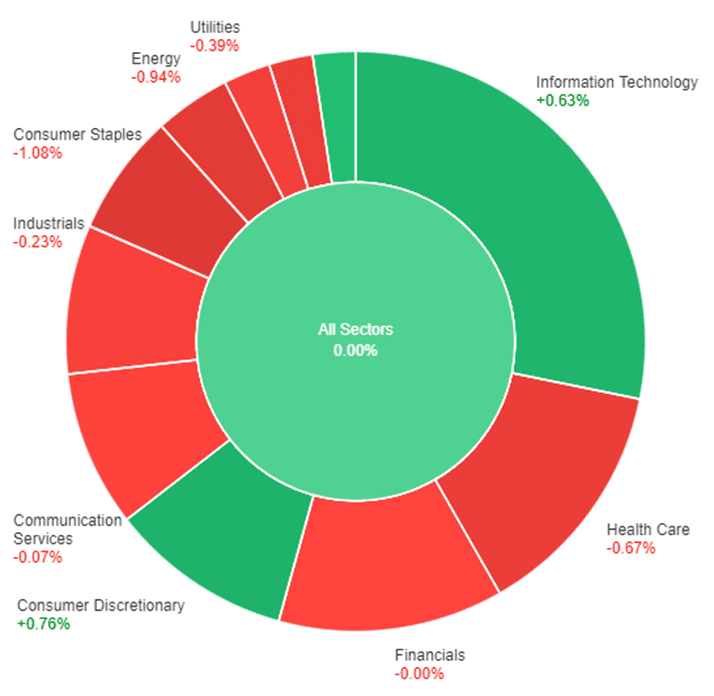
All sectors' performances amidst concerns of a potential raise to the US debt ceiling.

Data by Bloomberg

On Tuesday, the overall market performance was neutral, with all sectors collectively showing no change (+0.00%). Among the sectors that experienced gains, Consumer Discretionary had the highest increase of 0.76%, followed by Information Technology at 0.63%. Real Estate showed a modest increase of 0.27%. On the other hand, several sectors recorded losses. Consumer Staples had the largest decrease of 1.08%, followed by Energy with a decline of 0.94%. Health Care experienced a decrease of 0.67%, while Materials and Utilities both had losses of 0.59% and 0.39% respectively. Communication Services and Industrials also showed declines of 0.07% and 0.23% respectively. Financials remained unchanged at 0.00%.

Major Pair Movement

The EUR/USD currency pair showed signs of recovery from its 10-week lows on Tuesday, although there is a possibility that it may be influenced by the “sell in May and go away” stock market adage if U.S. data continue to outperform and investors continue to reduce their expectations of a Federal Reserve interest rate cut. These rate cut bets had increased during the U.S. regional banking crisis but have been diminishing and could decrease further if the debt limit deal is approved. The Federal Reserve’s cautious stance on rate hikes during the banking crisis and debt ceiling issue has eased, contributing to a 4.5% rebound in the dollar index since early May. However, it remains below the peak reached before the banking crisis.

The EUR/USD’s slight gain on Tuesday, despite a more bearish outlook, may only be a temporary bounce driven by month-end and pre-U.S. payroll book-squaring activities. The currency pair experienced a significant bearish reversal in May and is expected to retrace at least a portion of its recovery from 2022-23. The USD/JPY and EUR/JPY pairs both declined, with the yen gaining strength due to stable Japanese government bond yields compared to falling Treasury and bund yields following the debt ceiling deal. The USD/JPY also fell after reaching six-month highs as yen short positions became cautious following a meeting between the U.S. and Bank of Japan, which hinted at the possibility of FX intervention to support the yen if necessary. This intervention is viewed more seriously due to previous interventions in late 2023 that resulted in yen weakness and inflation surpassing the Bank of Japan’s 2% target. Sterling gained while the AUD/USD pair declined on concerns related to China.

Picks of the Day Analysis

EUR/USD (4 Hours)

EUR/USD Rebounds as USD Weakens, Debt Limit Drama Looms.

The EUR/USD experienced a slight increase, propelling the Euro to its best day in over a week. Despite the Eurozone’s Harmonized Index of Consumer Prices declining more than expected, the US dollar’s decline against European currencies and the yen provided support. However, the positive news for the European Central Bank regarding inflation may have negative implications for the common currency. Meanwhile, the US faces a potential debt default if Congress fails to pass a bill, adding to growing Republican opposition to the deal. Additionally, economic data shows a drop in the US Conference Board Consumer Confidence Index and the unexpected decline of the Dallas Fed Manufacturing Business Index. Important upcoming releases include the Chicago PMI, ADP Employment Report, and Nonfarm Payrolls report.

Chart of EURUSD performance amidst concerns of a potential raise to the US debt ceiling.

Chart EURUSD by TradingView

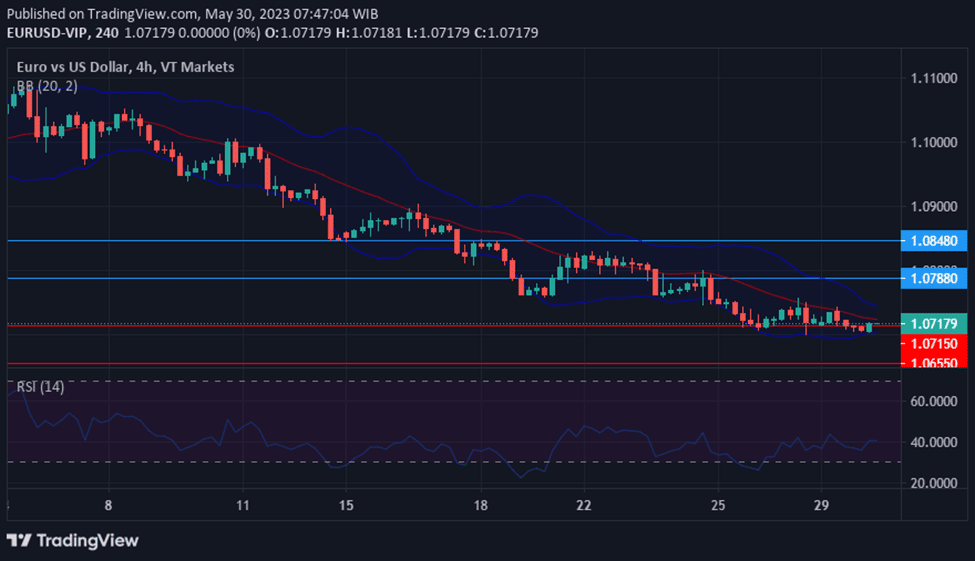
According to technical analysis, the EUR/USD pair is moving higher on Tuesday, rising above the 1.07 level and attempting to reach the upper band of the Bollinger Bands. It is anticipated that the EUR/USD will continue its upward movement today and strive to surpass the upper band of the Bollinger Bands. The Relative Strength Index (RSI) is currently at 48, indicating that the EUR/USD has returned to a neutral position.

Resistance: 1.0788, 1.0848

Support: 1.0715, 1.0655

XAU/USD (4 Hours)

Gold (XAU/USD) Rebounds as Debt Ceiling Optimism Fades and Market Concerns Mount

Gold prices (XAU/USD) experienced a rebound after hitting a low point for the day, trading near a daily high as optimism in financial markets wavered following news of a debt ceiling agreement to prevent a default in the US. However, sentiment deteriorated after a slow start to the week and concerns about lawmakers from both major parties being reluctant to pass the deal, reigniting fears of a default. Asian and European indexes traded mixed, influencing Wall Street, with the Dow Jones Industrial Average declining around 120 points and the S&P 500 and Nasdaq Composite struggling to maintain stability. Additionally, US CB Consumer Confidence decreased less than expected in May, indicating a somewhat less positive view of current conditions while expectations remained pessimistic.

Chart XAUUSD performance amidst concerns of a potential raise to the US debt ceiling.

Chart XAUUSD by TradingView

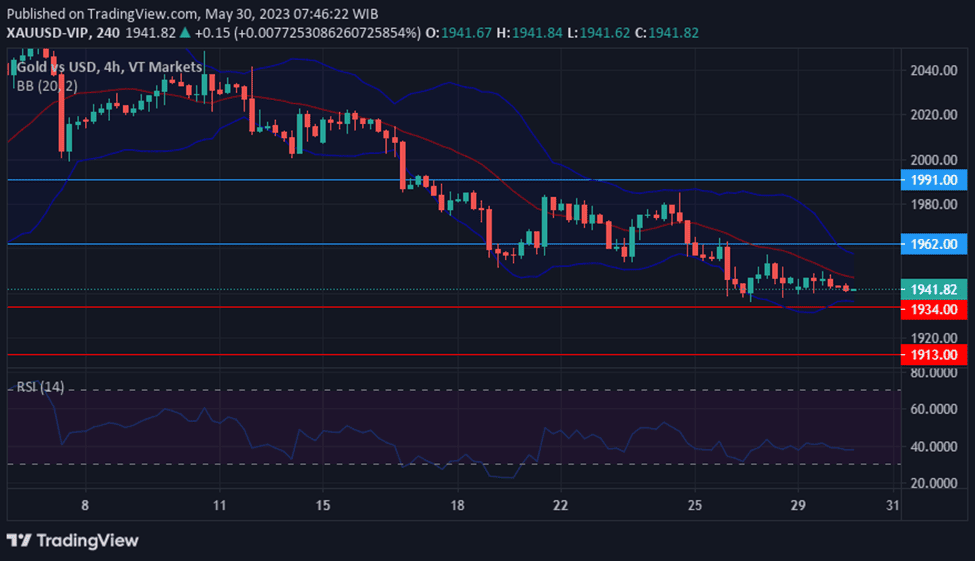
According to technical analysis, the XAU/USD is moving higher on Tuesday, reaching the upper band of the Bollinger Bands and touching the resistance level at $1,962. There is a possibility that the XAU/USD will make a slight downward movement and return to the middle of the Bollinger Bands before moving higher again today. Currently, the Relative Strength Index (RSI) stands at 55, indicating that the XAU/USD is in a neutral position but slightly bullish.

Resistance: $1,962, $1,991

Support: $1,934, $1,913

Economic Data

CurrencyDataTime (GMT + 8)Forecast
AUDConsumer Price Index09:306.4%
EURGerman Prelim CPITentative0.2%
CADGross Domestic Product20:30-0.1%
USDJOLTS Job Openings22:009.41M

CFD trading strategies

Contracts for difference, or CFDs, have become increasingly popular among traders in recent years thanks to their flexibility, accessibility and potentially profitable returns. However, having a sound CFD trading strategy is crucial to measurable success. A CFD trading strategy helps traders manage risk exposure and optimise potential returns.

As CFD brokers, we understand how important it is to have access to simple and digestible information when developing your trading strategy. In this blog, you’ll learn what CFD trading involves, the types of assets you can trade with and the common CFD trading strategies practised by seasoned traders worldwide.

What is CFD trading? 

CFD stands for “contracts for difference”, a contract between a trader and broker that tracks spot market movements. Unlike regular stock trading, where a trader must purchase an asset, CFD trading involves speculating on an asset’s underlying value without having to take ownership of it — traders only pay the difference from when they open a trading position to when it is closed.

What are the benefits of CFD trading?

CFD trading can provide traders with greater market exposure and increase their profit potential without holding an asset. Aside from this, there are other benefits traders can expect from this style of trading, including: 

  • Stretch your capital further — CFD trading utilises leverage, where traders can increase their position size, even if they don’t have the upfront capital to do so. For instance, if you wanted to buy 100 shares, you would not need to front the full cost immediately. This opens up a trader’s profit potential but can also bring on great losses. 
  • Low-cost — CFD trades have a significantly lower cost than traditional shares. For instance, CFDs often have tighter spreads — the difference between the buy and sell price — allowing traders to get more value from their trades.
  • Ability to go long or short — The freedom to easily go long or short can drastically increase the number of trading opportunities for traders who would otherwise only be able to go long with other assets. 

What kind of assets can you trade with CFDs?

Now that we understand how CFD trading works, you can move on to researching asset classes. When developing your CFD strategies, one of the things you will need to consider is the kind of asset you will be trading in. CFDs track many asset classes, giving you greater flexibility in choice. Some of the assets you can trade with via CFDs include:

  • Forex — CFDs can track currency pairs to trade forex. These involve two different currencies, with the value of one currency quoted against the other. For instance, EUR/USD is a currency pair involving the Euro and the US dollar. 
  • Metals Trading precious metals via CFDs refers to spot markets involving metals, such as gold and silver. Gold is often viewed as a ‘safe haven’ asset, as the price of gold is not impacted by movements experienced in other assets and, therefore, is not as volatile.
  • Energies Trading energies via CFDs involves tracking the price of energy from organisations focused on producing and supplying energy products — such as oil — to the rest of the economy.
  • Shares — Share CFDs track major stocks, such as Tesla, Apple, Meta, Microsoft and more. These CFDs give traders greater exposure to various stocks, improving profit prospects.
  • Cryptocurrency — Many traders are interested in the unusual nature of cryptocurrency but are often hesitant to invest due to its unpredictable nature. Cryptocurrency CFDs allow traders to dip their toes in the crypto market without having to hold the digital currency.
  • Indices Index CFDs refer to major global indices, such as the S&P/ASX 200 in Australia or the S&P 500 in the US. 

CFD trading strategies

Once you’ve determined the type of assets you want to trade via CFDs, the next step is to find your CFD trading strategy. There are many CFD trading strategies, which means traders must research to determine which trading method is right for them and aligns with their trading goals and skill level. CFD trading strategies can be short-term or long-term — let’s explore some common tactics below.

Short-term CFD trading strategies

Traders use short-term CFD trading strategies to make quick profits from the price movements of financial instruments such as stocks, currencies and commodities. Short-term CFD trading strategies offer more flexibility as traders can quickly react to market events and adjust their positions accordingly. 

CFD day trading 

As the name suggests, the day trading CFD strategy involves buying and selling assets within the same trading day to profit from intraday price movements. Day traders can use technical indicators such as the Average Directional Index (ADX) or the Stochastic Oscillator to identify short-term trends and momentum. 

Due to its demanding nature, CFD day trading strategies may be better suited to traders who can make and manage multiple trades.

Scalping 

Scalping is another short-term CFD strategy that involves making multiple trades quickly, usually within a day or even a few minutes. This strategy requires a high level of discipline and quick decision-making skills, ideal for experienced traders with a deep understanding of the market. 

Scalp trading positions don’t generate much profit individually. However, as scalpers try to engage in many daily trades, the high volume of trades is anticipated to increase profits during a trading session. Scalping is best used for assets with high volatility and tight spreads, so it may be worth learning more about forex trading.

Traders can use the Relative Strength Index (RSI) or stochastic indicator to identify scalping opportunities. 

Swing trading

Similar to scalping, swing trading involves holding positions for a few days or even a few weeks. This strategy is based on identifying swings in the market and taking advantage of them. Swing traders can use technical indicators such as the Moving Average Convergence Divergence (MACD) or the Bollinger Bands to identify trends and swings.

Long-term CFD trading strategies

There are many reasons why a trader may choose to engage with a long-term CFD trading strategy. From reduced time commitments to improved stability and lower transaction costs, with long-term trading strategies, traders can potentially generate greater profits by holding positions for longer periods. 

Buy and hold 

Simply put, the buy and hold strategy, or position trading, involves purchasing an asset to hold it for an extended period, like a few months or years. It’s believed that the asset will steadily increase in value. While the buy and hold method is a popular long-term strategy in traditional trading, the tactic can be adapted to CFD trading.

To implement the buy and hold strategy in CFD trading, a trader can look for assets with a strong fundamental outlook and potential for long-term growth using technical and fundamental analysis tools.

Diversification

As the name suggests, diversification involves spreading investments across multiple asset classes and markets to manage risk. These can include stocks of companies with strong financials, commodities with increasing demand, currencies of countries with improving economic indicators or trading in different markets, such as Asia, Europe and the United States.

Incorporating fundamental and technical analysis into your CFD trading strategy

No matter how long they’ve been trading, every trader will tell you that technical and fundamental analysis is integral to developing their trading strategy. Both can be useful in CFD trading, as they provide traders with valuable insights into market conditions and help them make more informed trading decisions. 

Fundamental analysis 

Fundamental analysis involves analysing economic and financial data and company reports to determine the value of an asset. This can include company financial statements and economic indicators, among others.

Economic data can refer to statistics that provide insight into the health of an economy. Meanwhile, company reports offer insight into a company’s financial performance, such as financial statements, earning reports and annual reports. 

Technical analysis 

Technical analysis uses charts and technical indicators to reference past price movements and trading volume to predict future movements.

Technical indicators are mathematical calculations based on price and volume data. Popular technical indicators include Moving Averages, Relative Strength Index (RSI) and Fibonacci retracements. Meanwhile, chart patterns are visual representations of price movement that indicate future trends, such as bar or line charts.

CFD trading tip — risk management 

As part of your CFD trading strategy, you will also need to ensure you have appropriate risk management in place to minimise losses and protect profits. Depending on your preferred trading method, this may involve implementing stop-loss orders, limiting leverage and diversifying your trading portfolio.

Stop-loss orders

As the market moves rapidly, sudden and unexpected movements can cost you if you don’t have corrective measures already in place. Market gaps, either trending upward or downward, can occur overnight or due to an unforeseen economic event. To prevent significant losses, stop-loss orders can be placed to automatically close a position when the market price hits a certain level.

Start small with leverage trading 

If you are new to leveraged CFD trading, it’s recommended that you start small and gradually increase your position over time until you fully understand the mechanics of this style of trading. 

VT Markets — trading made easy 

Whether you’re new to trading or a seasoned professional, having a reliable and dedicated platform that works for you is essential. VT Markets is a leading global multi-asset CFD broker, providing a superior trading environment for traders worldwide. 

We give you all the tools, resources and information you need to help you along your training journey, including the favoured trading platforms MetaTrader 4 and MetaTrader 5. With lightning-speed trade executions and spreads from 0.0 pips, VT Markets can support your trading goals. 

New to trading? Get comfortable with your CFD day trading strategies, test long-term methods by opening a VT Markets demo account to start trading with zero risk or kickstart your trading journey by opening a forex trading account. If you would like more information about our CFD brokerage service, contact us today.

FAQs

What are some of the common strategies when trading CFDs?

Common CFD strategies are either short or long-term, suitable for a wide range of traders. If you are interested in faster, more frequent trades, scalping and swing trading are popular strategies you can try. On the other hand, if you prefer to hold positions for a long period to maximise an asset’s value, the buy and hold technique may suit your trading needs.

Are some CFD trading strategies better than others?

There is no easy way to determine whether certain CFD strategies are ‘better’ than others, as no two traders have the same needs and goals. It will also come down to skill level, as beginner trades may be better suited to strategies that aren’t as intensive or require as much time commitment, compared to traders with more experience.

How do I start trading CFDs?

You can start trading CFDs by opening an account with VT Markets. We are a licensed and professional CFD broker with over 10 years of experience. We give traders access to free trading tools, analysis and top-tier market research, and have exposure to over 1,000 trading instruments.

CFDs vs. share dealing

Both CFDs and shares, or stocks, have advantages and disadvantages when it comes to trading. The two products are vastly different, so before deciding which is right for you, you’ll need to understand both the differences in the debate over CFDs vs. stocks, and also learn how the two are intertwined with and related to each other. 

In this article, we’ll break down the advantages both CFDs and shares have, their downsides and the difference between CFDs and share trading. 

CFDs vs. shares

The main difference between CFDs and shares is that CFDs – contracts for difference – are leveraged financial products, while shares are not. This one difference has huge ramifications for how each can be used within an investment portfolio, the knowledge you’ll need to trade them and the fundamental and technical analysis you’ll be required to perform in order to manage them successfully. 

Let’s get into more detail about each of these options for traders. 

What are shares?

Shares are probably familiar to most people, and even if you haven’t started trading or investing directly, you may be exposed to share trading through your superannuation fund. Shares are a unit of equity in a company or an ETF (exchange traded fund); owning them entitles you to certain voting rights and a share of that company’s profits.

The worth of your shares is derived from the value of the company on a stock exchange. This value, or share price, can move up and down, and you may also receive payouts, known as dividends, from your shares.

Leverage isn’t available when investing in shares; this means that your profits will likely be more modest, but also that your losses can not be more than your initial investment. If you invest £1,000 and the price of your shares drops to zero, the most you will lose is all £1,000, but will not exceed this amount.  

What are CFDs?

CFDs, or contracts for difference, do not represent ownership of a particular asset in the same way shares do. They are a financial instrument that works by allowing you to speculate on the movement of an asset or an index’s price. When trading CFDs, the trader does not take ownership of that underlying asset – any profit or loss is derived from the movement of the spot price itself. 

CFDs are often used for trading based on shorter term price movements, or to hedge your existing positions to mitigate against loss. Hedging is possible with CFDs, because they are a product which allows you to both go long or short (i.e. buy or sell), depending on how you think the market will move. 

As we’ve mentioned, CFDs are leveraged financial products. Trading with leverage means that only a percentage of the total trade’s value is needed to open a position. This is also known as the margin, and it is calculated by a company to produce a margin rate. 

If a CFD has a margin rate of 20%, for example, opening a £1,000 position would require a £200 deposit. Leveraged trading opens up the opportunity for larger profits, but also carries the risk of larger losses, because any outcome is based on the total value, not just your capital deposit.  

Learn the difference between CFDs and share trading

Another way of thinking about CFDs vs. shares is that trading shares is buying into a company’s equity, whereas CFDs are betting on an outcome of the market. This major difference means that there are lots of ways where trading shares or trading CFDs offer very different options: 

  • Leverage and cost of position — The fact that CFDs are leveraged means that they offer a lower barrier to entry; you only need to put up a margin in order to gain full market exposure. Shares require you to put down a larger cost of position by comparison; you’ll need to pay for the full amount that the stock is worth upfront.
     
  • Risk — Leverage amplifies everything: your potential profit and your risk. Shares can move to £0 value, but you will only ever stand to lose the value of your initial investment. If you open a position on a CFD and the market moves in the wrong way – against the position you were betting – you have the risk of absolute loss, with all of your CFD positions moving to zero. Your loss could also outstrip your initial outlay, just as your profits could be magnified if the market moves your way. 
  • Flexibility — CFDs are generally considered to offer more flexibility than shares, because you can bet on the success or failure of the market, you can go long or short and you can offset your trades relatively quickly and with less money required to gain full market exposure. This is why they’re a popular product for advanced traders looking to speculate on intraday market movements, a strategy known as day trading. 
  • Trading hours — CFDs can be traded outside of traditional market trading hours, however, there may be charges or extra fees associated with out-of-hours trading. With CFDs, you have the freedom to potentially trade 24 hours a day, while shares are normally constrained to local stock exchange trading hours.
  • Available markets — Both CFDs and shares have large available markets in which you can begin trading. Shares can be bought and sold on global markets, as can ETFs.

    CFDs are available in many international markets, and you can use CFD trading strategies to gain exposure to commodities, bonds, shares, indices, cryptocurrency, currency pairs, ETFs and more. 
  • Opportunities for short selling — If you’re looking to go short on a position, CFDs will likely be the right choice for you. Stocks do not offer short selling on all platforms, and the opportunities for shorting stocks are not as dramatic and therefore as attractive as with CFDs.
  • Privileges and dividends — When investing with the aim of receiving dividends and shareholder privileges, you’ll need to take ownership of stocks, rather than CFDs. CFDs are never connected to ownership of the underlying asset, whereas holding shares will pay out dividends and in some cases give you company voting rights.
  • Complexity — Shares are an abstract concept to a certain extent, but they are a tried and tested financial instrument with a fairly straightforward system of trading and of value fluctuation.

    CFDs, by comparison, are more complex by orders of magnitude. They also can quickly fluctuate in price, which increases the risk of suffering a rapid loss. Risk management strategies like stop orders and limit orders are helpful when controlling this level of complexity and protecting against loss. 
  • Diversity — Both stocks and CFDs are options for diversifying your portfolio, depending on how they are used. CFDs could be added to a portfolio to hedge your current positions, and for giving you full market exposure to an asset you may not already have open positions with.

    Because CFDs are traded purely on the movement of the market, it is more likely that a portfolio of exclusively CFDs would drop to absolute zero. Trading a combination of stocks and CFDs is one approach which would give you both long positions, short positions, opportunities for large profits and less volatility.  

What CFD markets are there?

CFDs are available to trade in a number of markets; soft commodities, energies, precious metals, bonds, stocks, indices and more. At VT Markets, we offer CFDs in markets around the world, including:

Because CFDs offer out-of-hours trading, it’s possible to open up an assertive suite of positions with share CFDs in an international market, even if it’s not within the same time zone as you. 

Now that you know which CFD markets are available, you’re ready to learn more about how to trade CFDs with our detailed guide. 

Trade your way with VT Markets

Whether you want to start trading stocks, CFDs or you’d like to diversify your portfolio with a range of both, VT Markets can help you. We’ve built our brokerage services around powerful trading platforms, MetaTrader 4 and MetaTrader 5, in order to give our clients an easy and flexible trading tool that’s transparent, competitively priced and completely reliable.   

Creating an account with us only takes a few minutes – simply fill out a few details and you’ll be ready to fund your account and start operating in a live trading environment. You’ll also gain access to state-of-the-art trading tools, daily market analysis, investor insights, guides to the fundamentals of trading, detailed economic calendars and so much more. 

If you’d like to practise opening and closing positions before you move into the markets, take advantage of our free demo account. When you sign up for a demo account, you’ll receive a free 90-day trial where you can get comfortable operating in a live trading environment, without any risk or obligation. Activate your live or demo account today, or talk to our team for all the help you need in building your trade portfolio. 

FAQs

Is it better to trade CFD or shares?

Both shares and CFDs have their own advantages and disadvantages that may or may not suit your goals and your style of trading.

Shares are considered to be a more straightforward financial instrument that are good for taking long positions, and grant you certain privileges as a shareholder in a company or ETF.

CFDs, on the other hand, are good for presenting short term opportunities, are easier to buy into with full market exposure and give you the flexibility to hedge your existing positions or go against a market if you so choose. 

Is trading CFDs better than investing?

Because CFDs require you to trade on the margin, it costs less upfront to get the same level of exposure to the equivalent value of shares. CFDs can also be used to offset other investments, and both CFD trades and share investments can be used together for a more diverse and protected portfolio.   

Are CFDs riskier than stocks?
Because CFDs are leveraged financial products, they amplify both your profit and loss margin. It’s important to have a good understanding of these complex financial instruments and how they work before you start trading with them. As with many financial products, their potential for high profits comes with an increased potential risk, and even small movements in the markets can be amplified as losses.

For this reason, risk management tools like stop loss orders and limit orders are useful when managing CFD positions.

How to trade CFDs

Trading CFDs is a way to buy or sell units in shares, commodities, indices, currency pairs and more. They allow traders to take a variety of positions, gain exposure to a range of markets and trade on price movements without taking ownership of the underlying asset. Because of this, you may want to learn how to trade CFDs for yourself.  

CFDs can undergo rapid changes, which require careful monitoring and a good foundational knowledge in order to make the right strategic trades. 

In this article, we’ll explain how to trade CFDs, what skills you need to develop to make successful trades and how to manage risk with the right management tools, insights and market analysis. 

How to trade CFDs

Learning how to trade a contract for difference can be more complex than other financial instruments because it is a speculative product that uses leverage.  

Leveraged trades require you to have a good understanding of how CFDs work, what strategy you want to implement and a powerful trading platform to help you navigate the live trading environment. 

In our six-step guide to trading CFDs, we’ll cover all these bases, from creating your account to choosing a position to open.

1. Understand what CFD trading is

CFD trading refers to the buying and selling contracts for difference; these units are financial instruments that give you exposure to various markets without the need to take ownership of the underlying asset or index. Instead, traders speculate on the movement of that asset, predicting whether the spot price will rise or fall within a given time frame. 

If you don’t want to trade a leveraged financial instrument, another option is share dealing, which, unlike CFD trading, requires traders to put down the full value of the asset in order to make a trade.   

Trading a CFD, by comparison, only requires a margin of the full value to be put down in order to make a trade. This means that if you correctly predict the market’s movement, your profits will be magnified in comparison to the capital you put in as a deposit. However, if the market moves against your prediction, your losses will also be amplified and can exceed your initial outlay amount. 

You can learn more about how CFD trading works, including examples of CFD trading, in our in-depth guide. 

2. Create and fund a CFD trading account

It doesn’t take long to set up a CFD trading account and begin to speculate in live markets. However, before you start speculating, you may want to practise with a demo account first. At VT Markets, we offer clients a 90-day, obligation-free trial period so you can learn to apply trading strategies in a risk-free trading environment. 

Then, once you’re ready to open a live account, you just need to fill in a few details and then start funding your account. At this time, you’ll also want to download a platform to your PC or mobile device so you can monitor your trade positions. VT Markets uses the power of MetaTrader 4 and next-generation MetaTrader 5, which gives our clients a convenient and flexible way to make trades on a schedule that suits them.

3. Choose your market and timeframe

There are a number of different markets you can choose to trade CFDs in. 

Just some of these include: 

  • ForexForex, or foreign exchanges, are the markets by which you can trade all the major, minor and exotic currency pairs via CFDs. You can also learn more about Forex markets and trading with our detailed guide.
  • Indices Indices are baskets of shares from major companies on various stock exchanges around the world. With CFDs, you can choose to speculate on the movement of an index like the S&P 500, the ASX 200, the Dow Jones or the Nasdaq.
  • EnergiesAmongst the markets that make up hard commodities, energies are some of the most valuable and potentially volatile, offering extra opportunities for experienced traders. Energies CFDs include crude oil, natural gas, solar and wind power. 
  • Precious metals — You may also choose to trade CFDs in other hard commodity markets, those of precious metals. This includes gold, silver and copper.
  • Soft commodities Soft commodities are defined as raw natural materials which must be cultivated by human effort to produce a yield. They include many highly liquid markets like soy, lumber, wheat, livestock, coffee, cocoa, hogs, sugar and rice.
     
  • Other markets — CFD trading is also possible in a number of other markets, for example, bonds, exchange-traded funds (ETF) and options. 

As well as these markets, CFD trading can take the form of trading on spot prices, which is a popular option for short-term trading, and on futures, which suit medium and longer-term positions.  

4. Decide whether to go long or short

In trading, a long position refers to buying with the expectation that prices will rise and going short to selling when you expect the market price to fall. CFDs offer traders the opportunity to go both long or short on a trade, depending on what your market prediction is. 

The amount you put down to open a position on a CFD trade is called a margin, and it is a percentage of the total asset value. So, for example, if you want to gain exposure to £1,000 worth of a company’s CFD units — and the margin rate was 20% — you will pay a margin of £200. Remember, although your outlay is £200, your profit or loss will be calculated on the full value of your position — in this example, £1,000. 

Then, you’ll wait to see how the market moves. The spread — the difference between the buying and selling price of your trade, will define the magnitude of your profit or loss. 

Brokers will also charge a commission each time to take a position; that is, open or close a trade on the market. When assessing your performance in a trade, you’ll need to take these commission fees into account, as well as the performance of the asset’s full value.   

Beyond taking a short, medium or long-term position, there are various more detailed CFD trading strategies you can pursue, especially as you become a more experienced trader. VT Markets offers in-depth guides for these strategies, so you can refine a more sophisticated approach to trading CFDs in live markets.   

5. Set your stops and limits

An essential part of a good CFD trading strategy is making use of the appropriate risk management strategies in order to make sure you don’t lose more money than you can afford if a trade doesn’t go your way. 

One of these tools is a stop-loss order. This is an automatic order you as a trader set up, which ensures your position will automatically close if it drops below a certain threshold you’ve set up. 

A limit order can be used for situations where the market has moved to a more favourable position for you. It automatically closes your position at this more favourable level so you can cash out on your advantageous position.  

6. Monitor your CFD trade and close your position

With your strategy in place, it’s time to monitor your open position in real-time and close it at a point when you’re happy with the performance or when you want to mitigate any further losses. 

VT Markets offers a range of trading tools, real-time updates, market signals, investor insights and daily market analysis in order to help you decide when the best time to close out your position will be. Our lightning-fast trading platforms quickly execute orders, so you can make your move exactly when you mean to. 

VT Markets — your online trading broker partners

AT VT Markets, we aim to give our clients the most transparent, fast and reliable live trading environment to make trading on whatever market you choose easy. We offer access to over a thousand instruments across all asset classes, from CFDs to commodities trading and more. Our superior trading platforms, expert analysis and insightful tools give you the resources you need to develop your knowledge and skill as a trader.  

Looking for more advice or need a hand setting up your live trading account? Our customer service can help. Contact us today and take advantage of our client services.   

FAQs

How does a contract for different CFDs work?

If you’ve been wondering how to trade a contract for difference, the complexity of this financial derivative product may have confused you. In order to understand and use CFDs to diversify your portfolio, there are a few essentials about how they work you’ll need to know. 

  • CFDs allow traders to speculate on whether the price of an underlying asset or index will rise or fall. You can profit from price movements in both directions if you correctly predict what the market will do. 
  • CFDs are traded using leverage, which means sales are made by putting down a marginal deposit rather than the full value of the asset. This makes them more affordable than other trades. 
  • Profits and losses from CFDs are always calculated based on the entire value of the trade, not from the marginal deposit.
  • You can trade many asset classes with CFDs, and you can trade out of hours too. 

How do I start trading CFDs?

To start trading CFDs, you’ll need to create a live trading account, deposit your initial funds and use a powerful trading platform in order to monitor the price movements of your underlying asset. 

CFDs mimic the movement of their assets and rise and fall with them. You can choose from thousands of live markets and different asset classes. Once you’ve chosen which market is right for you, you can decide on a CFD trading strategy, like swing trading or day trading. 

After you have your chosen market and trading strategy, you can open your first position, monitor your trade and choose to close your position when it’s most beneficial to you.

Is it better to invest or trade CFDs?

Both investing and trading CFDs can offer unique opportunities for experienced traders to make a profit. At VT Markets, we offer traders a wide range of options so they can build up a diverse and risk-averse portfolio that suits them.

VT Markets Makes LATAM Breakthrough With Record Number of New Trading Accounts

Sydney, Australia, 29 May 2023 – VT Markets, a leading online broker, today announced a record number of new trading accounts secured within the LATAM region. Following its formal entry into Latin America last year, the company has seen a rapid growth in regional clients, reflecting both the LATAM market’s burgeoning potential and the success of ongoing outreach efforts.

Of these efforts, a notable highlight has been VT Market’s recent participation at Money Expo Mexico 2023. Held from 24–25 May 2023, the much-anticipated event saw VT Markets gain thousands of new account sign-ups, consolidating its growing influence both in and around the country.

Responding to the promising trajectory evident thus far, a VT Markets representative stated: “We are delighted to be making such clear inroads into one of our key strategic markets. With the numerous developments taking place in the region, Latin America is uniquely poised for explosive growth, and we want to be at the forefront of the new financial landscape when it emerges.”

Moving forward, VT Markets looks set to continue its expansion throughout LATAM and beyond. With offices already established across Europe, Asia, and the Middle East, the company’s initiatives in the upcoming quarter are expected to amplify its international presence, further reinforcing its status as a truly global broker.

About the Company:

VT Markets is a regulated multi-asset broker with a presence in over 160 countries. Since its inception in 2015, the company has set out to make trading a simple and more accessible experience for everyone. As of today, VT Markets has emerged as one of the world’s top brokers, recently adding a haul of seven awards to its growing list of accolades.

For more information, please visit the official VT Markets website. Alternatively, follow VT Markets on Meta, Instagram, or LinkedIn.

US Debt Ceiling Agreement Reached, Earnings Reports Awaited

On Monday, the U.K. markets were closed for a bank holiday, while U.S. markets were closed for Memorial Day. European stocks had a turbulent week, with the Stoxx 600 index hitting an eight-week low but recovering some losses on Friday due to a rally in tech stocks, driven by Nvidia’s impressive results.


In the U.S., political leaders are working to secure bipartisan support for the debt ceiling bill in Congress before the June 5 deadline to prevent a federal default. The U.S. House of Representatives could vote on the bill as early as Wednesday, followed by the Senate later in the week. Market concerns are expected to ease if the debt ceiling deal is approved, allowing investors to shift their focus to the economic outlook and interest rates.


The Federal Reserve, European Central Bank, and Bank of England were anticipated to pause rate hikes and assess when to change direction, but recent data has complicated the situation for all three institutions. In Asia-Pacific markets, there was a mixed performance, with Japan’s Nikkei 225 reaching its highest levels since July 1990.


Over the weekend, President Joe Biden and House Majority Leader Kevin McCarthy reached an agreement to raise the debt ceiling and avoid a default. The legislation will be voted on by Congress as early as Wednesday. Both Republican and Democratic support is crucial for the bill to pass. The agreement came just before the “X date” on June 5, which was the earliest potential default date signalled by the Treasury Department. The prolonged negotiations between the White House and congressional leaders had concerned investors, who were already dealing with inflation and a banking crisis.


Investors will also focus on May jobs data to be released on Friday, as well as the April Job Openings and Labor Turnover Survey from the Bureau of Labor Statistics on Wednesday. Additionally, corporate earnings from HP Inc. and Salesforce are expected on Tuesday and Wednesday, respectively.

Major Pair Movement

On Monday, the US markets remained closed in observance of Memorial Day, resulting in a subdued atmosphere in the currency market. With limited trading activity, volatility was relatively low. The Dollar Index managed to register a slight rise of 0.05%, indicating a modest strengthening of the US dollar compared to a basket of other major currencies.

Among the currency pairs, the EURUSD experienced a slight decrease of 0.08%, reflecting a slight weakening of the euro against the US dollar. Surprisingly, the GBPUSD pair showed a rise of 0.13%, despite the closure of the UK market. This suggests that market participants may have responded to other factors, such as economic news or geopolitical developments. Meanwhile, the USDJPY pair saw a minor decline of 0.10%, signaling a marginal decrease in the value of the US dollar compared to the Japanese yen. Conversely, the AUDUSD pair demonstrated an upward movement, rising by 0.26%, indicating a relative strengthening of the Australian dollar against its US counterpart.

In terms of commodities, gold remained relatively stable, exhibiting a marginal increase of 0.05%. The price of gold often serves as a safe-haven asset during uncertain times, and its modest rise may reflect investors seeking stability amid the subdued market conditions. On the other hand, USOUSD (WTI), which represents the price of West Texas Intermediate crude oil, experienced a decline of 0.16%. This dip could be attributed to various factors, including global supply and demand dynamics, geopolitical tensions, or market sentiment regarding the energy sector. Overall, with the closure of US markets and limited trading activity, the currency and commodity markets displayed muted movements on Memorial Day.

Picks of the Day Analysis

EUR/USD (4 Hours)

EUR/USD weakens against US Dollar amidst data anticipation and market focus on Debt limit suspension.

The EUR/USD pair maintained its position above the previous week’s lows but experienced another daily loss, closing at its lowest level since March 17. Despite staying above 1.0700 and avoiding new monthly lows, the euro weakened against the US dollar during the European session and declined against the pound. The currency lagged other major currencies on Monday, failing to break its negative trend against the greenback. The focus shifted to Spain’s upcoming release of the preliminary Consumer Price Index (CPI) report for May, which holds significance for European Central Bank (ECB) officials and market expectations. Meanwhile, the US dollar posted mixed results, with a slight gain of less than 0.1% against a basket of currencies, reaching its highest close in two months above 104.20.

As market expectations shift from a pause to a potential 25-basis-point increase at the next Federal Open Market Committee (FOMC) meeting, any decline in the US dollar is expected to be limited. With US markets closed for Memorial Day, Monday saw subdued trading activity, as market participants analyzed the weekend’s agreement in Washington to suspend the debt limit, while awaiting Congressional approval.

Attention also turned to Friday’s US consumer inflation data and the upcoming release of key economic reports throughout the week, including housing data and consumer confidence on Tuesday, as well as the ADP employment report on Thursday and Nonfarm Payrolls on Friday.

EUR/USD weakens against US Dollar amidst data anticipation and market focus on Debt limit suspension.

Chart EURUSD by TradingView

According to technical analysis, the EUR/USD pair is experiencing a slow movement on Monday due to holidays in the UK and US markets. This has resulted in a narrower range between the upper and lower bands of the Bollinger Bands.

It is anticipated that the EUR/USD will make a modest upward move today, aiming to reach the middle and upper bands of the Bollinger Bands. The Relative Strength Index (RSI) is currently at 40, suggesting that the bearish sentiment for the EUR/USD may be easing for today.

Resistance: 1.0788, 1.0848

Support: 1.0715, 1.0655

XAU/USD (4 Hours)

Gold (XAU/USD) holds steady amid optimism over US Debt Ceiling agreement.

Gold prices (XAU/USD) remained steady at $1,943 per troy ounce on Monday, unaffected by holidays in Europe and the United States. Investor optimism prevailed at the start of the week following an agreement on the debt ceiling reached between US President Joe Biden and House Speaker Kevin McCarthy. However, the deal still requires approval from Congress, and concerns persist due to the limited time remaining before the deadline set by Treasury Secretary Janet Yellen on June 1.

Despite the holiday-induced low trading volumes, stock futures rose, reflecting the positive market sentiment and dampening the appeal of safe-haven assets like gold. With no significant events to monitor at the beginning of the week, the macroeconomic calendar lacks substantial releases, although noteworthy data is expected in the coming days.

On Tuesday, the US will publish the CB Consumer Confidence report, while Germany and the Eurozone will release preliminary estimates of their May Harmonized Index of Consumer Prices (HICP) in the following days. Furthermore, the US will unveil the ADP Survey on private job creation ahead of the Nonfarm Payrolls report scheduled for Friday. These figures hold significance for policymakers and could fuel speculation about future decisions by central banks.

Gold (XAU/USD) holds steady amid optimism over US Debt Ceiling agreement.

Chart XAUUSD by TradingView

According to technical analysis, the XAU/USD is moving slower on Monday due to the US market holiday. There is a possibility that the XAU/USD will attempt to move higher and reach the middle and upper bands of the Bollinger Bands today. Currently, the Relative Strength Index (RSI) stands at 38, indicating that the XAU/USD is in a neutral position.

Resistance: $1,962, $1,991

Support: $1,934, $1,913

Economic Data

CurrencyDataTime (GMT + 8)Forecast
USDCB Consumer Confidence22:0099.1

June Futures Rollover Announcement – May 30, 2023

Dear Client,

New contracts will automatically be rolled over as follows:

Please note:

• The rollover will be automatic, and any existing open positions will remain open.

• Positions that are open on the expiration date will be adjusted via a rollover charge or credit to reflect the price difference between the expiring and new contracts.

• To avoid CFD rollovers, clients can choose to close any open CFD positions prior to the expiration date.

• Please ensure that all take-profit and stop-loss settings are adjusted before the rollover occurs.

• All internal transfers for accounts under the same name will be prohibited during the first and last 30 minutes of the trading hours on the rollover dates

If you’d like more information, please don’t hesitate to contact [email protected].

What is CFD trading and how does it work

Increasingly popular amongst traders, contracts for difference are a way to speculate on a variety of asset classes without actually owning these assets.  

In this article, we’ll break down what CFDs are, how they can offer traders opportunities, the risks associated with them and the CFD trading strategies you can use to manage CFD positions. 

What is the meaning of CFDs?

CFD stands for contract for difference, and the ‘difference’ it refers to is the difference in an asset’s current price and its price at the nominated contract date. The difference can also be referred to as a ‘spread’. Whether the difference occurs through a rise or fall in prices is less important to a trader when using contracts for difference, as it is the movement itself that you are speculating on. Whether the underlying asset incurs a profit or a loss, you can still profit from holding a CFD position, either by holding onto that position for the long term or unloading it through short day trading.   

What are CFDs?

CFDs are a financial derivative product, meaning they derive their value from another underlying asset or index. They can be used to both go short (i.e. sell) or go long (i.e. buy) in a position, and they can be used to hedge an existing physical portfolio, in order to shield you from potential losses. 

They are generally considered to be a less costly and more flexible way to give traders access to a number of asset classes they wouldn’t otherwise be able to get exposure to. Traders will choose to hold long or short positions with CFDs, depending on where they think the market is headed.  

How do CFDs work?

CFDs work by establishing a contract in which both buyer and seller agree to a date in the future, with the buyer being obligated to pay the seller the difference in the current price of the asset and its price at contract time. 

Contracts for difference do not involve anyone taking possession of the underlying asset. Instead, they speculate whether the value of that asset will rise or fall, with options for traders to profit from both upward and downward movements in this price. Because of this, CFDs are an attractive trading option, allowing for profitable gains even when an asset is not performing well within the market.  

What is CFD trading?

There are numerous ways a trader can approach taking positions within live markets. You may choose to learn about the foreign exchange and trade forex, or you may opt to trade indices and trade soft commodities and hard commodities. In all these cases, you probably think of trading and dealing directly with the asset, either through spot price or futures trading. However, CFD trading offers a different way to gain exposure to certain markets. 

Rather than directly trading precious metals, for example, CFD trading lets traders speculate on the price movements in these markets, aiming to correctly predict these movements and take a long or short position accordingly. 

In general, there are three principles of CFD trading you need to understand: 

  • You choose to go long or short Going long indicates you think the price of an asset will rise, and so you choose to buy it. Inversely, going short requires you to sell CFDs, on the basis of a prediction that the price will fall.
     
  • You deal with leverage and margin CFDs are leveraged financial products. This means that they only require traders to put down a percentage margin of the asset’s true value, but that this marginal buy-in will grant you exposure to the asset’s full value. That means the full value of any loss or profit needs to be calculated according to the total asset value, not your initial deposit.
  • CFDs move with the market Contracts for difference are designed to move in line with the price movements of an underlying asset on open markets. This isn’t an exact mirror of the market itself, but it is a good mimic. 

Examples of CFD trades

In any CFD trade, there are two broad possible outcomes: a profitable trade or a losing trade. Let’s look at one example of these two outcomes, based on taking a long position. Remember, going long means buying in with the expectation that the asset’s price will rise. 

Imagine commodity A is expected to increase in price, according to your analysis. You decide to buy 1,000 CFDs, also known as units, at $10 apiece. You may also need to pay a separate commission charge on these units, calculated as a fractional percentage of their price. The total value of the position is $10,000, plus any commission paid. 

However, as CFDs are leveraged, the amount you will outlay in your deposit is based on the company or commodity’s margin rate. In our example, we’ll say that the rate is 20%, so rather than paying $10,000, your trade position margin that you will pay is $2,000. Whether you profit or lose from your position, the full value of the trade will be used to determine the difference. 

  • Outcome 1: a profitable trade

    In this scenario, you correctly predicted the price of commodity A would rise, and it is now selling at $11 a unit. You decide to sell your units at this price, and each unit you sell is now $1 higher in your favour. You may also be charged an exit commission at this point, so your profit will be $1,000, minus the entry and exit commission fees from the trade.
  • Outcome 2: a losing trade

    You made a bet, and it didn’t go off — commodity A’s stock dropped to $9.30. Wanting to minimise your losses, you sell off your CFDs at this price. In this scenario, the unit price has moved 70 cents against you, so although your initial buy-in was $2,000, your loss in real terms is $700. Again, entry and exit commission fees need to be added to this to determine the full amount. 

Deciding if CFD trading is right for you

In order to decide whether you want to start trading CFDs, you need to understand the reasons why people choose to do so. Some of these include: 

  • More flexibility Unlike some financial products, contracts for difference allow you to both buy and sell, so you still trade no matter which direction the market is headed in.
     
  • Less initial outlay The capital required to buy into a CFD is less than other financial instruments, giving you a cost-efficient way to trade a wide variety of different asset classes.
  • Longer hours In some markets, CFD trading continues for longer than the trading times of asset markets. For some traders, this gives them a tactical advantage, although it can also affect prices during out-of-hours trading.
  • Less potential loss While CFDs can magnify both profit and loss because of leveraging, they are also useful for hedging your existing portfolio against loss. For example, a trader might open a position based on the expected loss on an underlying asset they are also invested in, in order to mitigate any loss that might occur from a fall in the market price.  

You’ve probably noticed that all of these reasons involve putting much of the decision-making squarely in the hands of the investor. CFDs offer a lot of freedom to traders, but with increased options come increased risk and complexity with any decision. In deciding whether CFD trading is right for you, you need to consider how this complexity will affect your ability to make strategic trades and whether you feel experienced enough to jump into this financial instrument.  

VT Markets — your broker partner for CFD trading and more

AT VT Markets, we aim to provide a transparent trading environment and a plethora of trading tools and insights to help you manage your trading portfolio, no matter what your exposure or strategy. 

Whether you want to develop your skills and knowledge as a trader by using contracts for difference, learn more about trading energies or hone your ability to read market trends, our team can help you get started with a powerful platform and the tools you require. Contact us today to learn more. 

FAQs

Is trading CFDs safe?

Trading using any kind of financial product or instrument involves a degree of risk and requires research and knowledge in order to read the market and make the right strategic moves. No trade is completely ‘safe’, and there is always a chance that you may lose money rather than make a profit. 

Unlike share dealing, trading CFDs involves trading financial derivative products that require leverage. This means traders require less capital to gain full exposure to the product than they might with other assets. Leverage can amplify the amount of profit you make, but it can also magnify the loss. For this reason, it’s important to establish appropriate risk management tools to control potential losses.

If you want to practise opening and closing positions, watching for market trends and coming to grips with the complex financial instrument that is contracts for difference, a great way to do this is with a VT Markets demo account. This account will give you access to all the trading tools and insights you need to start practising trades in a no-risk and obligation-free 90-day trial. You can also become familiar with VT Markets’ powerful trading platforms and live trading environment before you start trading with your own money.  

Are CFDs traded in all international markets? 

Currently, CFD trading is not permitted within the US market, because they are a type of over-the-counter product (or OTC) that bypasses regulated exchanges. CFDs are legal to trade in the UK; however, they do attract taxation, unlike spread betting.  

How can I get started trading CFDs?

AT VT Markets, it only takes a few minutes to get started with a live account and begin trading CFDs. Along with powerful platforms MetaTrader 4 and MetaTrader 5, we offer all of our clients access to state-of-the-art trading tools, expert advice, market analysis and investor insights. Create your account today and start operating in a secure trade environment. 

What are corporate bonds

Corporate bonds are an alternative to company stocks that offer your portfolio diversity, enable you to receive income and earn higher yields than government bonds. 

If you’ve been wondering how to trade corporate bonds, what they are or how they work, learn all about this financial instrument in this in-depth guide. 

What are corporate bonds?

Corporate bonds are a simple debt instrument; a way for corporate entities to raise capital. By purchasing a bond, you become a creditor of that company, or bondholder. The company, or bond issuer, agrees to make interest payments to the bondholder, known as coupons. The coupon rate is calculated as a percentage rate of the loan amount. This coupon rate is paid on specific dates nominated within the bond documents, on coupon dates. At the expiration of the bond, known as maturity, the issuer agrees to repay the full loan amount. This amount is called the principal, or face value. 

How do corporate bonds work?

Corporate bonds, unlike government bonds, are issued by private institutions, and they are generally known to offer a slightly higher risk/reward threshold than government issued debt bonds. Company bonds can be secured, which means that corporations will put up certain assets as collateral for the bond. In some cases, the coupon rates of company bonds are fixed, and in other cases, they may be floating and tied to market interest rates.  

Corporate bonds are considered a negotiable security, which means they can be bought and sold on a secondary market. Within this market, company bonds are sold for an issue price, which is a value related to, but not the same as, the principal. Reselling company bonds offers chances for traders to take on a bond with a better yield. This means that the sale price of the bond is less than the principal, and in turn the coupon rates give the new buyer a better overall yield on their investment than the original bond’s terms. 

For example, say a £10,000 corporate bond is issued with annual coupon rates of £500. The yield of this bond is 5%. If that corporate bond was to be sold for £9,500, the coupon rates would remain £500 per annum, but the yield for the new bondholder will have increased.  

As well as buying and selling company bonds on secondary markets, another way to gain from this debt instrument is by learning how to trade bonds through OTCs.   

How to trade corporate bonds

Investing in corporate bonds can take the form of buying company bonds when they are issued by the corporate institution, or buying and selling them on a secondary market. Both of these methods are good ways to gain exposure to company bonds. Another way is by trading on company bonds.  

For traders who want to gain exposure to corporate bonds but not take possession of the underlying asset, one option is to hedge an existing position you have in the market, mitigating against potential losses. Bond CFD trading is one way to short sell the bond futures market. CFD trading works through leverage, and it’s important that you understand the risks associated with this type of trading.   

Leverage is a type of trading which means an initial deposit, calculated as a percentage margin of the full asset face value, is all you need to put down to gain full exposure to the total value of the company bond. This means that if you make a profit, the win will be magnified. However, losses can also be increased, and may exceed your initial deposit amount. 

No matter what kind of trading strategy you use to trade corporate bonds, you’ll also need a powerful platform to help you monitor your open positions and watch the market to identify trends and relevant developments. At VT Markets, we offer our clients MetaTrader 4 and its newest generation successor, MetaTrader 5, to trade in open markets.  

Why do people buy corporate bonds?

Investing in corporate bonds is an attractive option for a number of reasons:

  • They can help you diversify your portfolio
  • They allow you to speculate on the movement of interest rates
  • They provide income through coupon rates
  • They can earn you higher yields than government bonds if you’re willing to take on more risk
  • They’re a highly liquid asset, able to be sold at any time on a secondary market that tends to have a healthy appetite for reselling 

What are the risks?

As we’ve mentioned, corporate bonds are considered less risky than other kinds of financial assets and instruments, but no trading is completely risk-free. Here are some of the risks you’ll need to be aware of when learning how to trade corporate bonds.   

  • Credit risk — This is the term used to describe the risk of a corporate issuer defaulting on either the coupons or principal of a bond. Credit ratings help traders assess this risk through investment rating grades. The best rating corporate bonds can receive AAA rating, with riskier bonds falling into BB grades and lower.

    It’s important to be aware that a company bond’s credit rating can change over the active life span of the bond. In particular, adverse business conditions could affect a corporation’s risk of default. 
  • Interest rate risk — All bonds have a close relationship to interest rates, because how attractive a corporate bond is to investors depends on how its coupon rates compare to current interest rates.

    When interest rates rise, investors may lose interest in company bonds, favouring investments that may produce a better yield for them. In times of depressed interest rates, demand for corporate bonds can be expected to increase.
  • Inflation risk — Inflation will also impact the value of corporate bonds. In times of high inflation, these bonds will command less purchasing power, making the coupon rates less attractive.

    Interest rate increases are also used as a financial tool for controlling inflation, which means that inflation rates could cause an interest rate rise that makes your corporate bonds less attractive. If the inflation rate increases above the coupon rate of a bond, it could also lose money in real terms. 
  • Liquidity risk — Liquidity risk refers to situations where there may not be enough buyers in the market to quickly offload your company bonds. This lack of demand means that traders may have to sell their bonds for a lower issue price than its coupon price and face value. 
  • Currency risk — This risk refers specifically to company bonds which were issued in and paid out in a different currency to your reference currency. In a situation like this, currency exchange rates can become an issue that affects the overall value of your investment. 
  • Call risk — A call risk is produced when a company has the right, but not the obligation, to repay the principal before the maturity date of a corporate bond. This is undesirable for investors because it means you’ll miss out on coupon rates that you would have otherwise been paid during the active lifespan of the bond. 

Start trading corporate bonds with VT Markets today

If you want to start trading corporate bonds, VT Markets makes it easy to gain access to open markets, learn how to implement trading strategies, open positions and monitor them using our state-of-the-art trading tools, daily market analysis, expert advice and investor insights.

You can practise your corporate bond trading strategies using a demo account, which gives you access to a live trading environment with a risk-free, no obligation 90 day trial period. Then, when you’re ready to go live in an open market, create a live account and start opening and monitoring positions. Wondering how to set up your online trading platform? Ask our team for help to get started.

FAQs

How risky are corporate bonds?

All trading and investment comes with a certain degree of risk, however, the bond market is considered to be lower risk than other types of trading. Both government and corporate bonds are rated by external agencies like Standard & Poor’s, Fitch and Moody’s, who provide an investment grade that indicates how risky any given corporate bond is considered to be. 

Are corporate bonds safer than stocks?

Corporate bonds offer investors a very different product to stocks. Stocks are shares in a company; owning them entitles you to certain voting rights and makes you a stakeholder in the company. Owning corporate stocks allows you to benefit from increased share prices, but it also means that you could lose money if the value of the company takes a dive. 

In contrast, company bonds establish you as a bondholder, or creditor of a corporation. You loan that company an amount of money for the duration of the loan, until the maturation date. During this period, the corporation will make interest payments in the form of coupons, and then repay the principal at the expiration date of the bond.

Unlike with shareholders, bondholders won’t gain voting rights or a slice of the company’s profits, but they also expose themselves to less risk. Corporate bonds can be guaranteed by company assets as collateral, and if the company becomes insolvent, bondholders will be paid out their principal before shareholders, a concept known as liquidation preference.

How do I start trading corporate bonds?

One of the options for starting to trade bonds is to deal with over the counter products, also known as OTCs, which are traded through institutional broker-dealers. Bond CFDs are one such product. Contracts for difference, or CFDs, allow traders to speculate on the price movement of corporate bonds, rather than the value of the underlying asset itself. This means that traders have an opportunity to benefit from both profits and losses within the market, because they are speculating on where the price will move, rather than betting on a price increase only.

Bond CFDs are complex financial instruments, and they require traders to thoroughly research the market and understand different CFD trading strategies. They are leveraged financial products, which means that you gain full exposure to the asset based on just a marginal deposit. Your profits can be amplified with CFDs, but you can also potentially lose more than your initial deposit amount. For these reasons, learning how to trade CFDs requires time, education and appropriate risk management tools.

What are government bonds

Since they’re considered a low-risk investment, government bonds are an attractive option for traders to diversify their portfolios by taking a position on this government-backed debt instrument. 

If you’ve ever wondered about buying government bonds, how they can be traded or what the risks associated with them are, here’s our in-depth guide on everything you need to know about them. 

What are government bonds?

Government bonds, like all bonds, are straightforward debt instruments. They are used by federal, state, municipal and local governments to raise capital in the form of a loan from an individual, known as the bondholder. The government issues a bond for the amount of the loan, which details both the maturation point of the loan — that is, when the full repayment of the original amount is due — as well as interest repayments that will take place. These interest rates are known as coupon rates, and the bond will detail how much these repayments will be and when they are due — on a monthly, quarterly, semi-annual or annual basis. 

Both the US and UK governments offer bonds. In the US, they are known as Treasuries, and in the UK, they are known as gilts. Both governments offer a debt instrument that works in very similar ways.  

How do government bonds work?

When a government issues a bond for a fixed amount, you loan them this amount for an agreed period of time. The amount is known as the principal or face value of the bond. During the agreed period, the government will give you a return on your loan by making scheduled interest payments known as coupons. This means that government bonds are a fixed-income asset. 

When the bond reaches maturation and expires, the government will return the full principal amount back to you. The maturation period could be anywhere from a year to 30 years, and the maturation length of a bond can affect its value on secondary markets. 

Bonds can be traded and sold before their maturation date to other investors at an amount that’s known as the issue price or bond price. In theory, a bond’s price is equal to its face value, and this is usually true at the point of issue and right before a government bond expires. However, various factors can cause the issue price of a bond to fluctuate dramatically during its active period. 

The interest payments on a government bond are its coupon rates, and the agreed dates on which these payments are made are called coupon dates. The coupon rate is always calculated as a percentage of the bond’s principal — for example, 5% per annum.  

Types of government bonds

Although there might be a lot of specific, seemingly complex terminology around trading and investing in government bonds, they are actually simple. Once you’ve mastered the terminology associated with government bonds, you can learn the distinctions between the different types of bonds offered by a country’s government. 

  • In the UK Bonds issued by the UK government are known as gilts, and they all contain their maturation date in the title. So, a bond that will expire in three years is simply called a three-year gilt.
  • In the US The US has three distinct types of government bonds they will issue: Treasury bills, Treasury notes and Treasury Bonds. They are often shortened to simply T-bills, T-notes and T-bonds. T-bills expire within one year, T-notes expire between one and 10 years and T-bonds expire in more than 10 years, often within 30 years. 

Other countries’ governments also issue bonds that have their own distinct types and naming conventions. If you’re interested in government bonds issued by another country, it’s worth taking the time to understand how their government bonds are structured before you make an investment.  

Index-linked bonds

As well as traditional fixed-income asset bonds, it’s possible to buy bonds that don’t have a fixed coupon price and instead offer repayments that are calculated in line with inflation rates. 

  • In the UK Index-linked bonds issued by the UK government are known as index-linked gilts.
  • In the US The US government calls index-linked bonds ​​Treasury Inflation-Protected Securities or TIPS for short.

Buying government bonds

It’s possible to become involved in both trading and investing in government bonds. The first way to invest is to buy bonds directly from the government when they are being newly issued, in an auction. Usually, it’s large financial institutions and banks that will purchase bonds in these auctions. It’s also common for these institutions to onsell government bonds to other banks, pension and retirement funds, and individual investors. 

Buying government bonds is also possible on the stock exchange, where many types of bonds are listed. However, the most common way of investing in government bonds is through OTCs (over-the-counter products) that are traded with institutional broker-dealers. 

One such way of doing this is with speculation on the bond futures market through bond CFDs or contracts for difference. Because government bond issue prices are closely related to interest rates and inflation, the choice to trade bonds CFDs can be a good way to hedge against risks associated with these factors. 

To take a position with bond CFDs, a trader puts down a deposit known as a margin in order to open a larger position. This is a method known as leveraged trading, and it’s how all CFD trading works. All leverage financial products are inherently risky because they are so complex, which means they require a careful approach. While your profits will be maximised by successfully speculating on a bond CFD, the inverse is also true. Your losses will be calculated on the total asset value, not the percentage margin you used as capital for a deposit. Accordingly, your losses could outstrip your initial investment amount significantly.

To help you manage this increased risk, it’s important to understand what can affect the price of government bonds. 

What moves the prices of government bonds?

Government bonds can be affected by several factors and are often a reflection of larger trends within a country’s economy. 

  • Supply and demand Just like any asset, supply and demand will affect the price of government bonds on open markets. The government controls a large portion of this supply, as it chooses when it will offer bonds at auction.

    Governments may choose to curb this supply in order to better balance out demand, which is less when government bonds are seen as less attractive investments. 
  • Interest rates One of the big reasons government bonds may lose their attractiveness is because interest rates are up. If interest rates are higher than the coupon rate for a bond, it’s likely investors will look for a more rewarding asset. However, if interest rates drop below the coupon rate, bond demand can go up.
  • The distance to bond maturity When a government bond is first issued, it’s simply a reflection of current interest rates, and so its price is at or close to a 1:1 ratio with its principal. The closer a bond is to its maturation, the more aligned its issue price will be with its principal or face value. This is because the bond’s price adjusts to reflect that it is now essentially just a payout of the principal.

    In between these two points though, the price may fluctuate especially when taking into account the amount of interest rate payments it has to pay out. 
  • Credit ratings Third-party ratings agencies determine the investment grade of all corporate bonds and government bonds, giving them a rating from AAA downwards. This rating aims to assess risk, and while the default rate for established economies’ government bonds is low, there’s still an element of risk involved. If bonds have a similar interest rate, the lower-rated one will likely trade at a lower price.
     
  • Inflation Increased inflation rates are usually not a good sign for bondholders — they signal that a bond’s fixed coupon price may become a lot less attractive, and they often occur in line with interest rate increases.

    Because national reserve banks will often use an interest rate rise as a tool for curbing inflation, a rise in the inflation rate could see your government bond coupon rate drop below current interest rates, therefore making trading bonds less attractive.  

Why do people trade government bonds?

Government bonds, despite having some associated risks, represent a strong, stable way to diversify your portfolio. They can help traders hedge against interest rate fluctuations, and they can also offer regular income via coupon payments. 

If you’re ready to start trading government bonds, the team at VT Markets is here to help. Download the powerful MT4 or MT5 trading platform today and create an account to begin building up your portfolio.
 

FAQs

How risky are government bonds?

All investments and trades are associated with some level of risk. However, when it comes to government bonds from stable countries with powerful economies like the US and the UK, these assets are considered relatively low risk and a good way of calming volatility within your portfolio. 

Government bonds are technically classed as ‘unsecured’ by the US treasury — i.e. government assets are not offered as collateral to guarantee the principal of the bond. However, bonds have been a historically very safe asset, with a low risk of the government defaulting and not returning the full face value of the bond.

Government bonds do carry with them some credit risk. That is, the risk that the issuer — in this case the federal, local or municipal government — will not be able to make their repayments in full and on time. Credit agency ratings for bonds help traders to assess the level of this risk. AAA-rated loans are considered to be the safest and the most likely to be repaid in full. At the other end of the spectrum, a BB+ loan may offer higher rewards, because it also carries a higher risk of defaulting. 

If a national economy faces very high interest rate hikes for prolonged periods, this will also affect the value of a government bond and could make it harder to offload the asset, as investors seek more attractive options within the inflated interest rate market.  

What are the ways to trade government bonds?

When it comes to trading, government bonds can be bought and sold directly, or traders can get exposure to this low-risk asset via the secondary market through the use of over-the-counter products (OTCs) like bond CFDs. To trade bond CFDs, traders speculate about the movement of a bond’s issue price on the market, profiting from both price spikes and drops. 

By trading government bonds in this way, traders are essentially using an instrument that allows them to speculate on a country’s interest rates. The value of a government-issued bond is inversely related to interest rates — when rates rise, the price of bonds fall. To successfully trade bond CFDs on the secondary market, you’ll need to correctly predict the rise or fall of interest rates and back the price of government bonds to do the opposite. 

It’s important to remember that managing CFDs requires a lot of research on and familiarity with these complex financial instruments. Before deciding if trading government bond CFDs is right for you, it’s recommended you thoroughly understand how to trade CFDs and the various CFD trading strategies you can practise in order to maximise your chances of making a profit.

Back To Top
server

Hello there 👋

How can I help you?

Chat with our team instantly

Live Chat

Start a live conversation through...

  • Telegram
    hold On hold
  • Coming Soon...

Hello there 👋

How can I help you?

telegram

Scan the QR code with your smartphone to start a chat with us, or click here.

Don’t have the Telegram App or Desktop installed? Use Web Telegram instead.

QR code