ECB President Christine Lagarde said the level of uncertainty and volatility is very surprising. She said the ECB will take the necessary measures to control inflation.
Lagarde said the current situation is very different from 2022 and that the ECB has a better capacity to absorb shocks. She said the degree of volatility makes the situation hard to manage.
Uncertainty And Policy Signals
She said she cannot say precisely what will be decided on interest rates. She said Europe will not be allowed to face the same inflation as in 2022/2023, and she said the euro area is not in stagflation.
At the time of writing, EUR/USD was down 0.22% at 1.1610. The ECB is the Eurozone’s reserve bank, based in Frankfurt, and aims to keep inflation at around 2% mainly by raising or lowering interest rates.
The Governing Council meets eight times a year to set policy. Quantitative easing involves creating euros to buy assets and is usually linked with a weaker euro, while quantitative tightening involves ending purchases and reinvestments and is usually linked with a stronger euro.
Given the surprising degree of uncertainty and volatility, we should anticipate sharp movements in European markets. The European Central Bank’s firm stance against inflation suggests it will delay any planned interest rate cuts or even consider tightening if necessary. This creates a difficult environment for managing risk over the next few weeks.
Inflation Data And Market Repricing
This hawkish tone is likely a reaction to recent data, as we saw Eurozone inflation for February 2026 unexpectedly tick up to 2.4%, interrupting the steady decline we observed throughout 2025. While this is a far cry from the peaks of 2022, it’s enough to make the central bank cautious. This goes against the market’s previous conviction that rate cuts were coming soon.
As a result, bets on a June 2026 rate cut are quickly being repriced, with market odds dropping significantly in the last few days. We are now seeing traders push their expectations for the first cut further into the third quarter. This shift in expectations will be a primary driver of bond and currency derivatives.
The explicit mention of high volatility is a clear signal for traders to protect their portfolios. The VSTOXX index, which measures Euro Stoxx 50 volatility, has already jumped over 15% in the last week, moving from its calm state in February. We should prepare for this heightened volatility to persist through March and into April.
In this environment, strategies that profit from price movement itself, rather than direction, are becoming more attractive. We should consider buying options, such as straddles or strangles, on instruments like the Euro Stoxx 50 index or the EUR/USD pair. This allows us to benefit from the large swings that the ECB’s uncertainty is likely to cause.
Looking back, the market’s path seemed much clearer in the final quarter of 2025 when a steady disinflationary trend was firmly in place. This sudden return of uncertainty is a stark reminder of how quickly conditions can change. It contrasts with the calmer period we experienced last year when the main question was not *if* the ECB would cut rates, but *when*.
The Euro itself is now caught in a tug-of-war. A central bank ready to fight inflation is typically supportive of its currency, but the overarching volatility and growth concerns are a headwind. This makes straightforward long or short positions on the EUR/USD risky, reinforcing the view that volatility-based plays are the more prudent approach for now.
Create your live VT Markets account and start trading now.
Start trading now – Click here to create your real VT Markets account
Written on March 11, 2026 at 6:00 am, by josephine
Jensen Huang says AI is “essential infrastructure, like electricity and the internet” and the buildout is only “a few hundred billion dollars” in, with “trillions of dollars” still to build.
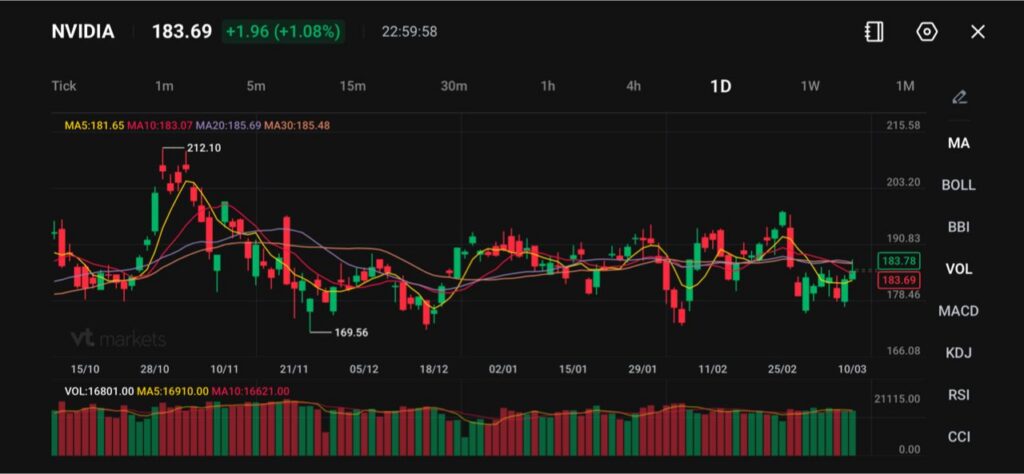
NVIDIA stock sits at 183.69, up +1.96 (+1.08%), with MA5 181.65, MA10 183.07, MA20 185.69, MA30 185.48.
Layoff messaging keeps colliding with AI optimism: Block cut 40% of staff, Pinterest cut up to 15%, and Goldman sees US unemployment edging from 4.4% to 4.5% by year-end.
The Market Takeaway From Huang’s “Buildout” Message
Jensen Huang is trying to reframe the AI cycle as an industrial capex supercycle, not a software fad. In his March 10 blog post, he calls AI “essential infrastructure, like electricity and the internet”, and says the industry has only put “a few hundred billion dollars” into the buildout so far, with “trillions of dollars” still to go.
For markets, that framing matters because it shifts the debate from short-term AI revenue to long-term demand for power, data centres, networking, cooling, and skilled labour. Huang also argues AI is a “five-layer cake” spanning energy, AI chips, infrastructure, AI models, and applications.
If traders buy the “infrastructure cycle” story, semis and data-centre supply chains can keep attracting capital even in a choppy macro tape. If oil stays volatile and bond yields stay sticky, markets may still fade rallies in high-multiple tech, even if the long-run thesis remains intact.
Jobs Narrative Splits Into Two Tracks
Huang’s key claim is that AI will not become the large-scale job taker many fear, because building and maintaining “trillions of dollars” of infrastructure needs a large workforce. He lists trades such as electricians, plumbers, steelworkers, network technicians and operators, and calls them “skilled, well-paid jobs” that are “in short supply”.
At the same time, the market has fresh evidence that firms are already using “AI efficiency” as a justification for headcount cuts. Block cut 40% of staff, with CEO Jack Dorsey pointing to AI-enabled efficiency. Pinterest cut up to 15% of jobs as it redirected resources toward AI.
Goldman Sachs analysts have described AI job losses as “visible but moderate”, while flagging that AI-driven displacement could lift the US unemployment rate from 4.4% to 4.5% by year-end.
That split matters for risk assets. Markets can price both at once: near-term layoffs that lift margins, plus a longer-term capex wave that lifts demand for equipment and power.
Chip stocks including Nvidia are holding up despite market volatility, according to the charts https://t.co/ucmOMIRphK
If more companies follow Block-style cuts, equities may like the margin story in the short run, but consumer-facing sectors could feel pressure if job insecurity rises. If capex ramps as Huang expects, industrials and infrastructure-linked names may gain relative strength, but the path will depend on rates and energy costs.
Technical Analysis
NVIDIA (NVIDIA) is trading near $183.69, up around 1.08%, as the stock attempts to stabilise following a period of sideways consolidation that has dominated trading since late November. The daily chart shows the market holding within a broad range after the sharp rally that pushed prices to a peak near $212.10 before momentum faded.
From a technical standpoint, price is currently sitting close to its short-term moving averages. The 5-day moving average (181.65) is slightly below the current price, while the 10-day (183.07) is almost aligned with the market.
Meanwhile, the 20-day (185.69) and 30-day (185.48) averages sit marginally above the current level, suggesting the stock remains trapped within a narrow consolidation band with no clear directional breakout yet.
Immediate resistance appears near $190–$192, where previous rallies have struggled to sustain momentum. A move above this area could open the path toward $200, followed by the $212 region that marked the prior high. On the downside, initial support lies around $178–$180, with stronger structural support closer to $170, which previously acted as a major swing low.
Overall, NVIDIA appears to be range-bound in the near term, with the market digesting earlier gains. A decisive break above $192 would strengthen the bullish outlook, while a move below $178 could trigger renewed downside pressure.
Macro Link That Traders Should Not Ignore
The buildout pitch lands at a tricky time. AI data centres consume power, materials, and financing. When energy prices rise and yields climb, the market can become less patient with long-duration growth stories. That does not kill the AI thesis, but it can change the timing and leadership within tech.
The job angle also matters for central banks. If unemployment drifts from 4.4% to 4.5% as Goldman outlines, policymakers may face a slower-growth backdrop at the same time that energy and infrastructure spending keep parts of inflation sticky.
If data shows cooling employment without a sharp inflation drop, markets may keep trading a narrow path where quality growth and cash-rich leaders hold up, while rate-sensitive risk stays jumpy.
What to Watch Next
Follow-through on “trillions” of buildout claims via real orders, capex guidance, and data-centre power build plans.
Whether “AI efficiency” layoff headlines broaden beyond tech, after Block’s 40% cut and Pinterest’s up to 15% reduction.
NVIDIA behaviour around 185.48–185.69 overhead and 181.65 support, with 183.69 as the current pivot.
Create a live VT Markets account today to access our platform features, including market insights and educational content.
Frequently Asked Questions
How Big is the AI Buildout According to Huang? Huang said the buildout is only “a few hundred billion dollars” in so far, and that “trillions of dollars” of infrastructure still need to be built.
Why Does a “Trillions” Buildout Matter for Markets? Large infrastructure cycles usually spread demand across multiple industries. Traders may look beyond software into power, data centres, networking, cooling, construction, and industrial labour as second-order beneficiaries.
What Is Huang’s “Five-Layer Cake” Model For AI? He described AI infrastructure as a “five-layer cake” consisting of energy, AI chips, infrastructure, AI models, and applications. It outlines the chain from power supply through to end-user products.
Why Does Huang Say AI Will Not Be A Large-Scale Job Taker? He says the buildout needs workers to build and maintain the infrastructure. He listed roles such as electricians, plumbers, steelworkers, network technicians, and operators, and called them “skilled, well-paid jobs” that are “in short supply”.
How Do Layoffs Fit With This Pro-Jobs View? Companies can cut some roles while still increasing demand for other roles. The article cites examples of firms linking cuts to AI efficiency: Block cut 40% of its staff, and Pinterest and Dow cited AI as the reason to cut a total of more than 5,000 employees between them.
What Does Goldman Sachs Expect For US Unemployment? Goldman Sachs analysts said AI-driven job losses have been “visible but moderate”, and that AI could lift the US unemployment rate from 4.4% to 4.5% by year-end.
Start trading now – Click here to create your real VT Markets account
Written on March 11, 2026 at 6:00 am, by josephine
US Central Command said US forces eliminated several Iranian naval vessels, including 16 minelayers operating near the Strait of Hormuz, Reuters reported on Wednesday. The statement came after Donald Trump said 10 “inactive” minelayers had been “completely destroyed”.
Trump said on Tuesday that if mines are placed and not removed, Iran will face consequences “at a level never before seen”. No further detail was provided in the text.
Market Reaction And Oil Prices
At the time of writing, West Texas Intermediate (WTI) was down 1.33% at $83.73. It had earlier reached over three-year highs of $113.28 this week.
The text defines “risk-on” and “risk-off” as terms for how much risk market participants accept. In risk-on conditions, stocks, most commodities except gold, commodity-linked currencies and cryptocurrencies tend to rise, while in risk-off periods, bonds, gold and safe-haven currencies tend to do better.
It says risk-on tends to support the Australian Dollar (AUD), Canadian Dollar (CAD), New Zealand Dollar (NZD), and also the Ruble (RUB) and South African Rand (ZAR). It says risk-off tends to support the US Dollar (USD), Japanese Yen (JPY) and Swiss Franc (CHF).
Last year, we saw how quickly the market reacted when US forces engaged with Iranian vessels near the Strait of Hormuz. WTI crude futures shot up to over $113 a barrel, a three-year high at the time, before pulling back, showing just how sensitive energy prices are to conflict in that specific waterway. That event created a clear playbook for how markets respond to military escalation in the Gulf.
Today, we see a similar, though less acute, pattern of tension which traders must watch closely. Although direct conflict has been avoided, recent satellite imagery shows a heightened naval presence, and war risk insurance premiums for tankers passing through the strait have ticked up by 0.15% in the last quarter. This underlying friction keeps energy markets on edge, with WTI currently hovering around $91 a barrel, well above the levels seen before last year’s incident.
Derivatives Hedging And Safe Haven Flows
For derivative traders, this environment suggests that buying near-term call options on crude oil futures is a prudent strategy to position for any potential flare-up. Implied volatility in oil options has risen to its highest level in six months, indicating that the market is already pricing in a higher probability of a sharp move. This makes options a more capital-efficient way to gain upside exposure compared to holding long futures contracts directly.
This situation points toward a broader risk-off sentiment if things escalate. We’re already seeing early signs of this as the CBOE Volatility Index, or VIX, has climbed from a low of 17 to over 21 in the past three weeks, reflecting growing nervousness in the equity markets. Therefore, purchasing put options on major stock indices could serve as an effective hedge against a wider market downturn triggered by geopolitical shocks.
In the currency markets, we should expect safe-haven currencies to outperform. The Japanese Yen and Swiss Franc will likely benefit from capital flight, just as they have during previous periods of global uncertainty. Consequently, traders could consider call options on the JPY or CHF, particularly against commodity-exporting currencies like the Australian Dollar, which would suffer from a risk-off move.
Create your live VT Markets account and start trading now.
Start trading now – Click here to create your real VT Markets account
Written on March 11, 2026 at 5:58 am, by josephine
Nasdaq 100 has moved sideways for about 3 months and retested the range low this week. The drop into the low was overlapping, while the rise from Monday looks more like an impulse move.
The view presented is that the wider trend fits a wave ii rally bias. A further 3–5% rise later this week is described as possible, with pressure on all-time highs.
Wave Structure And Key Levels
The rally from the November 2025 low is described as a diagonal (rising wedge). The fall from the January high is described as corrective due to overlapping price action.
The move up from the Monday 9 March low is labelled as wave i of a larger impulse. A pullback in wave ii is mapped to 24,629–24,842, tied to the 38% and 61% Fibonacci retracement levels.
After wave ii, wave iii is projected to push towards a retest of highs near 25,200, with 26,200 also given as a potential level. A drop to or below 23,854 is set as a point that would trigger a review of the wave count.
For the past three months, we have watched the Nasdaq trade in a frustrating sideways range, with the CBOE Volatility Index (VIX) hovering in a tight band between 18 and 22. The strong, impulsive rally since Monday, March 9th, suggests this corrective period that began in January 2026 might be concluding. This could be the start of a new upward leg.
Risk Management And Positioning
We are now looking for a temporary pullback into the key support zone between 24,629 and 24,842. This area represents a classic 38% to 61% Fibonacci retracement of the initial thrust up from the March 9th low. For traders, this could be an ideal area to start building long positions through bull call spreads or by selling cash-secured puts.
If support holds, we anticipate a powerful wave ‘iii’ to develop, targeting the 26,200 level and new all-time highs. This view is supported by last week’s Producer Price Index (PPI) data, which showed cooling inflation, giving the Fed room to stay accommodative. A similar pattern was observed back in the fourth quarter of 2024, when a brief correction was followed by a sharp 12% rally into year-end.
Risk management remains paramount, with the 23,854 level acting as our line in the sand. A decisive break below this horizontal support would invalidate the immediate bullish setup and signal a potentially deeper correction is underway. Any long derivative positions should have stops placed just below this critical zone to protect capital.
Create your live VT Markets account and start trading now.
Start trading now – Click here to create your real VT Markets account
Written on March 11, 2026 at 5:58 am, by josephine
Gold traded near $5,190 in early Asian dealings on Wednesday, steady after recent swings. The move came ahead of the US February CPI inflation release.
US President Donald Trump said US military operations in Iran would be ending soon, with no clear timetable. His comments coincided with lower oil prices and reduced inflation concerns.
Middle East Risk And Oil Flow Threats
Markets continued to track developments in the Middle East. Iran’s Islamic Revolutionary Guard Corps said Iran could block regional oil exports if US and Israeli attacks continue, while Trump warned the US would respond if oil flows through the Strait of Hormuz are disrupted.
US CPI data is due later on Wednesday, with headline inflation forecast at 2.4% year on year in February and core CPI at 2.5%. A higher reading could strengthen the US Dollar and pressure the dollar-priced gold market.
Central banks are the largest holders of gold. They added 1,136 tonnes worth about $70 billion in 2022, the highest annual total on record, according to the World Gold Council.
Gold often moves opposite to the US Dollar and US Treasuries. It is also influenced by interest rates and geopolitical risk.
Looking Back At 2025 Price Volatility
Looking back to this time in 2025, we recall gold trading near an impressive $5,200 level, driven by significant Middle East tensions and anticipation of key inflation data. That period of volatility was a reminder of how geopolitical headlines can quickly impact the price of safe-haven assets. The focus on a potential de-escalation showed how sensitive the market was to any news from the conflict.
The upcoming US Consumer Price Index (CPI) report was a major focal point then, just as it is for us now. The market last year was bracing for a 2.4% headline figure, and any deviation caused sharp moves. Today, with the February 2026 CPI data showing inflation stubbornly above 3%, the Federal Reserve’s path on interest rates is even more uncertain, creating a challenging headwind for gold.
While the specific US-Iran flare-up of early 2025 has subsided, the broader geopolitical landscape remains tense, providing an underlying bid for gold. We see that consistent safe-haven demand is a key support, even as the dollar has strengthened. This dynamic suggests that any new escalations could trigger a rapid move upwards, similar to what we saw last year.
For derivative traders, this environment suggests looking at options strategies that can benefit from potential price swings. With the market uncertain about the Fed’s next move, implied volatility on gold options has been elevated, recently hovering around 18%, which is higher than its 52-week average. This indicates that option sellers can collect higher premiums, but buyers are pricing in the possibility of significant price action.
We must also consider the persistent buying from central banks, which has continued since the record-breaking purchases we saw in the years leading up to 2025. According to the most recent data from 2025, global central banks added another 950 tonnes to their reserves, underscoring their long-term strategy to diversify away from the dollar. This structural demand provides a solid floor under the gold price, limiting the potential downside.
Ultimately, the inverse relationship with the US Dollar remains the most critical factor for short-term price movements. As long as inflation remains a concern and keeps the Federal Reserve from cutting rates, the strong dollar will likely cap gold’s upside potential. We are watching for any shift in Fed language, as that would be the primary catalyst for a sustained break in either direction.
Create your live VT Markets account and start trading now.
Start trading now – Click here to create your real VT Markets account
Written on March 11, 2026 at 4:59 am, by josephine
USD/JPY rose nearly 0.25% on Tuesday and traded at 158.07, about 80 pips above its opening level. It rebounded from a three-day low of 157.27 as risk appetite weakened late in the New York session, despite comments pointing to de-escalation in the conflict.
The technical setup is slightly bearish after a shooting star candle formed on Monday. Tuesday produced a bullish candle, but selling pressure still pushed the pair down to 157.27.
Technical Levels And Momentum
The Relative Strength Index (RSI) indicates buying momentum is building and is close to overbought territory. If the uptrend resumes, the March 9 high at 158.90 is the first level to watch, with attention on the 159.00–160.00 zone.
If the pair drops below 158.00, the next support is the March 5 swing low at 156.46. Further levels include the 50-day SMA at 156.20 and the 100-day SMA at 155.68.
A weekly performance table and heat map show percentage moves among major currencies. The Japanese Yen was the strongest this week against the US Dollar.
We recall this time last year when the pair was clinging to the 158.00 handle, with intense speculation around intervention near the 160.00 mark. The technical outlook was cautiously bearish then, following specific candle formations. Those fears proved valid, as we saw Japanese authorities step in during late April 2025 to defend the yen.
Today, the situation has escalated with the pair trading significantly higher, around 162.20. The persistent interest rate differential is the primary driver, as the Federal Reserve holds its policy rate steady in response to core PCE inflation lingering at 3.1%. Meanwhile, the Bank of Japan has remained cautious, despite Japan’s own core inflation holding above target at 2.5%.
Derivatives Positioning And Intervention Risk
For derivative traders, this environment suggests a marked increase in implied volatility in the coming weeks. We are now well above the 2025 intervention zone, and verbal warnings from the Ministry of Finance have become more frequent. Options pricing, particularly for one-month JPY calls, reflects this heightened risk of sudden, sharp price movements.
We see traders positioning for a potential downturn by purchasing USD/JPY puts or establishing put spreads to limit premium costs. This strategy is a direct play on the increasing probability of official action to strengthen the yen from these historically weak levels. The key will be timing entry before volatility spikes further, making these defensive positions more expensive.
Create your live VT Markets account and start trading now.
Start trading now – Click here to create your real VT Markets account
Written on March 11, 2026 at 4:59 am, by josephine
China’s latest trade report for February showed exports beating expectations despite US tariffs. The data suggests trade has remained resilient even with disruption risks.
A firmer People’s Bank of China daily fixing has also supported the renminbi. The fix was set stronger than expected, at just below the 6.9000 level.
Trade Data Supports Renminbi Resilience
Lower tariff-related risks had previously allowed policymakers to tolerate more renminbi strength against the US dollar before the Middle East conflict. Near-term gains may be limited if higher energy prices feed through to China’s economy.
The article was produced with assistance from an AI tool and reviewed by an editor.
The Chinese yuan is showing resilience, supported by strong policy fixes and surprisingly robust trade data. We’ve seen exports continue to beat expectations, a trend that began to firm up last year in 2025. This fundamental strength suggests a solid floor for the currency.
The latest numbers confirm this, with combined January and February 2026 exports surging over 7% from a year ago, far exceeding forecasts. This performance shows China’s export machine remains potent. It gives us confidence that the central bank has room to guide the renminbi stronger against the dollar.
Options Strategies For Managing Headline Risk
However, we must watch the energy markets closely, as the conflict that flared up in the Middle East in 2025 continues to create price volatility. With Brent crude futures currently pushing past $95 a barrel, this poses a significant risk for China as a major energy importer. Historically, large energy shocks can eventually weigh on the yuan, even if fundamentals are strong.
For traders, this suggests that outright long positions in the renminbi may be too risky given the headline risks. Instead, selling USD/CNY call spreads or CNH put options could be a prudent approach to gain from the yuan’s underlying strength. These strategies benefit from a stable-to-stronger yuan while limiting exposure to a sudden reversal caused by an energy price spike.
The People’s Bank of China’s recent daily fixes, consistently set stronger than market expectations around the 6.9000 level, signal a clear intent to prevent sharp depreciation. This official support effectively provides a backstop, which should help keep currency volatility contained in the near term. This managed environment is favorable for strategies that profit from premium decay.
Create your live VT Markets account and start trading now.
Start trading now – Click here to create your real VT Markets account
Written on March 11, 2026 at 4:58 am, by josephine
US weekly crude oil stocks fell by 1.7 million barrels in the week ending 6 March. This was below expectations for a rise of 1.4 million barrels.
The data points to a tighter stock position than forecast for that week. The figures refer to the United States API weekly crude oil stock report.
Historical Parallel From 2025
Looking back to this time in 2025, we saw a surprise draw in crude inventories that signaled tightening supply when the market expected a build. This type of report often precedes a bullish run as it indicates stronger-than-anticipated demand or weaker supply. That specific event helped push WTI prices higher in the subsequent trading sessions.
We are seeing a similar setup now in March 2026, creating a potentially profitable environment. The most recent Energy Information Administration (EIA) report showed a crude inventory draw of 2.1 million barrels, defying consensus expectations for a 900,000 barrel build. This second consecutive weekly surprise draw suggests the market is fundamentally tighter than many analysts believe.
On the demand side, recent data shows US jet fuel demand is up 4% year-over-year, its highest level for early March since 2019. This coincides with China’s manufacturing PMI recently hitting a seven-month high, pointing to robust global energy consumption. These factors are creating a strong pull on available crude oil supplies.
Given the tightening inventories and strengthening demand signals, we should consider positioning for upward price movement.
Options Strategy For Upside Exposure
Buying near-term call options on WTI and Brent futures could be a good way to capitalize on this developing trend. This strategy allows us to benefit from a potential price spike while defining our maximum risk.
Create your live VT Markets account and start trading now.
Start trading now – Click here to create your real VT Markets account
Written on March 11, 2026 at 4:58 am, by josephine
NZD/USD fell back to about 0.5930 after giving up earlier gains late in the American session, as the US Dollar recovered. Earlier, the US Dollar eased after President Donald Trump said late Monday that the Middle East conflict could end soon.
Oil rose after the US and Israel started a war with Iran, with markets focused on the risk of Iran closing the Strait of Hormuz. Oil later pulled back after Trump’s remarks and reports that G7 countries may release strategic reserves if prices rise again.
Key Market Drivers
WTI is trading near $85 a barrel, down from a three-year peak near $120 on Monday. The war with Iran remains ongoing, and shifts in risk sentiment could support the US Dollar.
Attention turns to the US Consumer Price Index on Wednesday and New Zealand’s Business NZ Performance of Manufacturing Index on Thursday. These releases may influence near-term NZD/USD direction.
On the 4-hour chart, NZD/USD is around 0.5929, sitting above the 20-period SMA but below the 100-period SMA, with both flattening. The RSI is near 52.
Support is at 0.5925, then 0.5907, while resistance is at 0.5965. A move above 0.5965 points higher, while a drop below 0.5907 suggests renewed downside.
Risk And Strategy Outlook
We recall how last year, in 2025, the NZD/USD was struggling around 0.5930 amid significant geopolitical tension and an oil price spike to nearly $120 a barrel. The market was highly sensitive to headlines about the conflict with Iran, causing sharp reversals in the US Dollar. That volatility was driven by uncertainty over energy supplies and global stability.
Fast forward to today, March 11, 2026, the Kiwi is trading higher around 0.6150, but the underlying pressure is building again. US inflation remains a primary concern, with the latest February CPI data coming in hotter than expected at 3.2%, keeping the Federal Reserve on a hawkish path. This persistent inflation strengthens the case for a stronger US Dollar in the medium term.
On the other side, New Zealand’s economy is showing signs of weakness, with the most recent BusinessNZ Performance of Manufacturing Index for February lingering in contractionary territory at 49.3. This weak data puts pressure on the Reserve Bank of New Zealand to consider cutting interest rates sooner than the Fed. This monetary policy divergence is a powerful driver that suggests potential downside for the NZD/USD pair.
Given this outlook, we should consider buying NZD/USD put options with an expiration in the coming months to profit from a potential decline. A strike price around 0.6050 would offer a good balance between cost and potential payoff if the pair reverses its recent gains. This strategy provides a defined risk, limited to the premium paid for the option.
Alternatively, for a more conservative view that generates income, we can look at selling bear call spreads. For example, selling the 0.6200 strike call and simultaneously buying the 0.6250 strike call would profit if NZD/USD stays below 0.6200 by expiration. This is a bet that the pair’s upside is capped due to the strong US economic data.
Market volatility, as measured by indicators like the VIX index which is currently holding around 17, is not extreme but reflects underlying economic uncertainty. Implied volatility in NZD/USD options may still be underpriced given the diverging paths of the Fed and RBNZ. We must watch the upcoming Federal Reserve meeting next week and New Zealand’s GDP figures for catalysts that could sharply move the pair.
Create your live VT Markets account and start trading now.
Start trading now – Click here to create your real VT Markets account
Written on March 11, 2026 at 3:59 am, by josephine
USD/CHF rose 0.20% on Tuesday as the US Dollar recovered from earlier losses. The pair traded at 0.7786 after hitting a daily low of 0.7748, while three of the four US indices closed lower.
Price action showed consolidation, with USD/CHF failing to extend its downtrend. The pair is attempting to move above the 50-day Simple Moving Average at 0.7810.
Near Term Momentum
The Relative Strength Index moved above its neutral level and continued higher. This points to building upward momentum in the near term.
If the pair moves above 0.7810, the next levels include the March 3 high at 0.7878, then 0.7900 and 0.8000. On the downside, support sits at the March 6 low of 0.7750.
Further support lies along a trendline from the year’s low around 0.7601, passing through the 0.7670 to 0.7700 area. If that breaks, the January 28 swing low at 0.7601 is the next level.
A weekly performance table showed CHF as the strongest currency against the US Dollar. A heat map format was used to display percentage moves between major currency pairs.
Shift In Macro Backdrop
Looking back at the analysis from early March 2025, we saw the beginning of a potential rebound for the USD/CHF from the 0.7780 level. That period of consolidation was a critical turning point, leading to the much stronger dollar we see today. Now, with the pair trading significantly higher around 0.8950, the dynamics have completely shifted.
The primary driver for this sustained rally has been the divergence in central bank policy. Recent US inflation data from February 2026 came in at a stubborn 2.8%, pushing expectations for a Federal Reserve rate cut further into the future. This contrasts sharply with Switzerland, where inflation is comfortably below 1.5%, prompting the Swiss National Bank to signal potential rate cuts.
This interest rate differential makes holding the US Dollar more attractive than the Swiss Franc, a trend that is likely to persist. For derivative traders, this suggests that long USD positions remain favorable. Buying call options on USD/CHF with a strike price above the key psychological level of 0.9000 could be a strategy to capture further upside.
Given the strong uptrend, we should consider bull call spreads to reduce the initial cost of purchasing options. This strategy involves buying a call option and simultaneously selling another call with a higher strike price. It allows us to profit from a moderate rise in the USD/CHF while capping both our potential profit and our initial cash outlay.
Historically, the support levels mentioned in 2025, such as 0.7900 and 0.8000, have now become distant floors. Current volatility suggests that any pullbacks are likely to find support near the 50-day moving average, which now sits closer to 0.8820. Traders should watch for any break above 0.9000 as a signal to target the next resistance level near the late-2024 highs of 0.9150.
Create your live VT Markets account and start trading now.
Start trading now – Click here to create your real VT Markets account
Written on March 11, 2026 at 3:59 am, by josephine