US stocks plunged on Tuesday, coming under heavy selling pressure and suffered from their biggest daily losses in more than two years following the release of US Consumer Price Index data. The US annual CPI inflation decelerated to 8.3% yearly in August but was slightly above markets’ estimates of a decline to 8.1%. Therefore, the hotter-than-expected inflation data fueled the bets on a 75 bps rate hike by the Federal Reserve next week and weighed heavily on the equity markets. There is around a 25% chance that the Fed will announce a full 1.0% increase in the benchmark Fed rate on September 21 meeting.
In the Eurozone, the weaker-than-expected German ZEW Economic Sentiment declined to -61.9 in September and deteriorated the market mood. Furthermore, expectations that Russia will hit hard after retreating from some parts of Ukraine also undermined the euro. However, another 75 basis points rate hike from the European Central Bank in October is still on the table.

The benchmarks, S&P 500 and Dow Jones Industrial Average both suffered from heavy losses on Tuesday as a broad-based selloff pushed the equity market down most since 2020 amid the surging US dollar. The S&P 500 was down 4.3% daily and the Dow Jones Industrial Average also declined with a 3.9% loss for the day. All eleven sectors in S&P 500 stayed in negative territory as the Energy and the Utilities sectors are the worst performing among all groups, losing 5.64% and 5.35%, respectively. The Nasdaq 100 meanwhile dropped the most with a 5.5% loss on Tuesday and the MSCI World index was down 3.4% for the day.

Main Pairs Movement
The US dollar staged an impressive rally on Tuesday, regaining upside strength and witnessing its biggest one-day percentage gain since March 2020. The rising US treasury yields have provided strong support to the greenback as the stronger-than-expected US inflation data boosted investor bets that the Federal Reserve will need to stay aggressive in raising interest rates. As for today, the market focus shifts to the US Producer Price Index (PPI) report later in the US session.
GBP/USD retreated sharply on Tuesday with a 1.62% loss as the cable witnessed an intense sell-off towards the 1.150 mark after the release of the US CPI data. On the UK front, investors are awaiting the release of the UK inflation data which might add to the concerns of a recession and soaring jobless claims. Meanwhile, EUR/USD also plummeted and touched a daily low below the 0.9980 mark in the second half of the day. The pair was down almost 1.50% for the day.
Gold licked its wounds with a 1.28% loss for the day after retreating to a daily low around the $1,698 mark during the early US session, as the renewed fears of the Federal Reserve’s aggressive rate hike undermined the safe-haven metal. Meanwhile, WTI Oil remained under pressure and refreshed its daily low near the $85 mark during the US trading session as the hawkish Fed expectations propelled the recession woes on Tuesday.
Technical Analysis
EUR/USD (4-Hour Chart)

EUR/USD started the day with upward momentum, but the pair could not hold on to gains as the U.S. CPI report was released during the early American trading session. U.S. CPI came in at 8.3%, higher than market expectations f 8.1%. The Dollar Index soared more than 1% following the release of the report. Market participants have piled on to the rhetoric of a 75 basis point interest rate hike by the Fed as inflation continues to run high in core areas. Most notably, food and rent went up for August, thus causing the core CPI to rise at an unexpected rate. The strong Dollar, accompanied by the rising U.S. 10-year treasury yield eroded all of the shared currency’s early gains and sent the pair into correction territory.
On the technical side, EUR/USD reversed course slightly below our previously estimated resistance level of 1.0192 and is trending below parity. The short-term support level for the pair remains at 0.9902, however, a strong PPI report from the U.S. could send the Euro-Dollar pair further away from parity. RSI for the pair sits at 44.08, as of writing. On the four-hour chart, EUR/USD currently trades below its 50, 100, and 200-day SMA.
Resistance: 0.9902, 1.0011, 1.0055
Support: 0.9902, 0.985
GBP/USD (4-Hour Chart)

The British Pound attracted bidding during the earlier part of Tuesday’s trading, but the Pound did not stand a chance against the U.S. Greenback as the Dollar was met with a surge of demand following the hotter-than-expected CPI report. Cable reversed course around the 1.173 price region and began trending down as U.S. 10-year treasury yields soared past 3.4%. The British Pound, however, fared better compared to its European peers as the U.K. has yet to announce its monthly CPI figure. The downside for the British Pound could still be unrestricted as the nation faces one of its toughest seasons as winter approaches, and energy prices continue to haunt the residents of Britain. Furthermore, the BoE continues to be hampered by the weak British economy, so raising interest rates could add more pressure on any economic revival.
On the technical side, GBP/USD met fresh resistance at the 1.173 price region. We maintain 1.1463 as Cable’s short-term resistance as the upside for the U.S. Greenback is still yet to be exhausted. A hot CPI report from the U.K. could favour Pound bulls in the short term, but the stronger U.S. Greenback limits any upward momentum for Cable. RSI for the pair sits at 40.9, as of writing. On the four-hour chart, GBP/USD currently trades below its 50, 100, and 200-day SMA.
Resistance: 1.1561, 1.1854
Support: 1.1463
XAU/USD (4-Hour Chart)

Gold prices advanced during early trading on the 13th. Gold prices were able to rise before the U.S. CPI release as the Dollar continues to exert weakness; however, as the CPI came in above expectations, Gold plunged back to the $1,700 per ounce region. The non-yielding precious metal simply could not compete against U.S. treasury yields, which soared past 3.4% as market participants bet on a rise of short-term interest rates. The 75 basis point interest rate hike now seems all the more certain as core CPI from the U.S. rose unexpectedly. U.S. PPI, which is scheduled to release during today’s American trading session, is expected to show resilient demand and add to the case of a super-size interest rate hike as the next FOMC meeting nears.
On the technical side, XAU/USD has reversed course at our previously estimated resistance level of $1,724 per ounce and has broken below our previous estimated support level of $1,712 per ounce. The next level of support for Gold sits at the $1,695 per ounce price level. RSI for the pair sits at 41.4, as of writing. On the four-hour chart, XAU/USD currently trades below its 50, 100, and 200-day SMA.
Resistance: 1740, 1800
Support: 1712, 1695
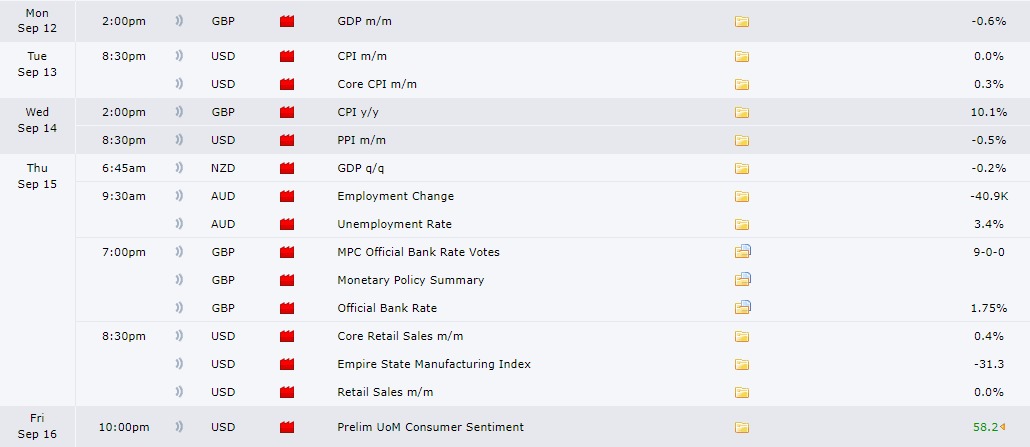
Economic Data
| Currency | Data | Time (GMT + 8) | Forecast |
| GBP | CPI (Aug) | 14:00 | 10.2% |
| USD | PPI (Aug) | 20:30 | -0.1% |
| USD | Crude Oil Inventories | 22:30 | 0.833M |