Key Points
- Gold trades near $4,550, with COMEX futures up 0.6%.
- Brent crude surges above $115, marking a 60% monthly rise.
- Gold has dropped over 15% this month, its steepest fall since October 2008.
Gold prices edged higher on Monday, with the June COMEX contract rising 0.6% to $4,550 per ounce.
The move comes as a softer U.S. dollar improves affordability for international buyers, offering short-term support to bullion.
Silver followed, climbing 1.1% to $70.520 per ounce, reflecting broader precious metals demand.
However, gains remain limited as macro headwinds continue to weigh on sentiment.
Gold may stabilise in the near term, but upside could remain capped without a sustained dollar decline.
Oil Shock Drives Inflation Concerns
Energy markets remain the dominant macro driver.
Brent crude surged past $115 per barrel, recording a 60% rise in March, driven by escalating tensions in the Middle East.
Recent attacks by Yemeni Houthis on Israel have intensified fears of prolonged disruption, reinforcing inflation risks.
Higher energy prices feed directly into broader inflation expectations, complicating the outlook for central banks.
Fed Rate Expectations Shift Sharply
Markets have significantly adjusted expectations for U.S. monetary policy.
Traders now see minimal likelihood of a rate cut this year, a stark reversal from earlier expectations of two cuts before the conflict escalated.
Rising inflation pressures from energy costs are expected to keep interest rates elevated.
This dynamic poses a challenge for gold, as higher rates increase the opportunity cost of holding non-yielding assets.
Persistent inflation may keep gold under pressure despite its safe-haven appeal.
Gold Faces Pressure Despite Safe-Haven Demand
Gold typically benefits during periods of geopolitical uncertainty, yet current price action tells a more complex story.
Despite ongoing conflict, gold has fallen more than 15% this month, marking its steepest decline since October 2008.
This drop has been driven largely by a stronger dollar, which has gained over 2% since February 28, when the U.S.-Israeli war on Iran began.
The interplay between safe-haven demand and rising yields continues to create conflicting signals for gold prices.
Technical Analysis
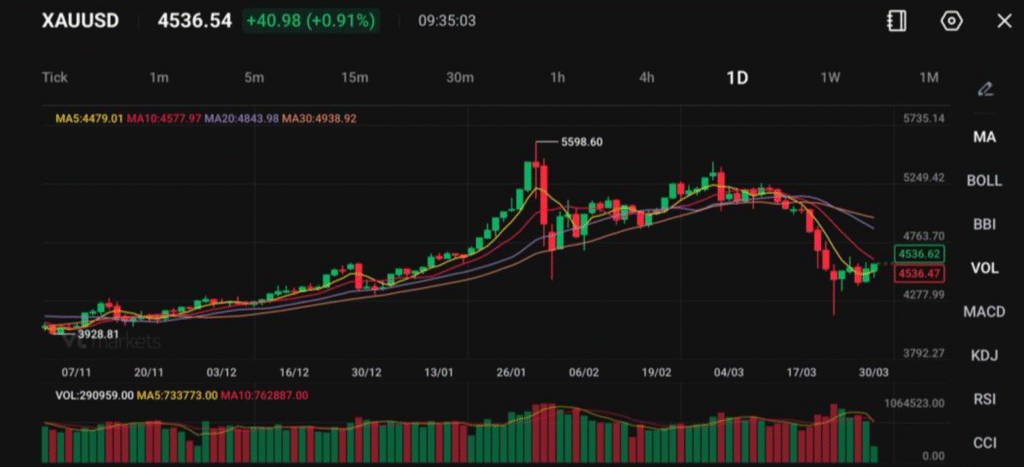
Gold is trading around 4536, attempting a bounce after a sharp corrective move that followed the rejection from the 5598 high. The structure has clearly shifted from a strong uptrend into a medium-term pullback, with price now testing whether a base can form.
Trend Structure and Momentum
The moving averages show a clear deterioration in trend:
- MA5: 4479
- MA10: 4577
- MA20: 4843
- MA30: 4938
Price is currently:
- Slightly above MA5, but
- Still below MA10, MA20, and MA30
This tells you the bounce is early-stage and fragile, not yet a confirmed reversal.
The earlier sell-off was aggressive, with long bearish candles and strong follow-through. The current rebound is much smaller, suggesting short-covering rather than strong fresh buying.
Key Levels To Watch
- Immediate Resistance: 4575 → 4650
- Stronger Resistance: 4760 → 4850
- Support: 4400 → 4275
- Breakdown Level: Below 4275 opens deeper correction toward 4100
The 4575 (MA10) area is the first key test. If price fails there, sellers remain firmly in control.
Price Behaviour Insight
The move from ~3900 to 5598 was a strong macro-driven rally. What we are seeing now is:
- A distribution phase near the highs
- Followed by a sharp unwind
- Now transitioning into a potential consolidation or corrective range
The recent bounce off the lows shows some demand, but:
- No strong impulsive candles yet
- Resistance is still pressing down
- Structure still shows lower highs
What to Watch Next
Focus on how price behaves around 4575–4650:
- Rejection: Likely continuation lower toward 4400
- Break and hold above 4650: Opens a move toward 4760
Also watch macro drivers closely:
- US dollar direction (USDX)
- Treasury yields
- Ongoing geopolitical risk, especially energy-driven inflation narratives
Gold tends to react quickly to shifts in rate expectations, so any change in that narrative will drive the next move.
Cautious Outlook
The bias remains corrective to bearish below 4650, with rallies still vulnerable to selling pressure. A sustained move above 4760–4850 is needed to stabilise the structure. Until then, price risks another leg lower or extended consolidation around current levels.
What Traders Should Watch Next
Gold remains highly sensitive to macro and geopolitical developments. Key drivers include:
- Direction of the U.S. dollar
- Oil price movements and inflation expectations
- Federal Reserve policy signals
- Developments in Middle East tensions
For now, gold is caught between competing forces, with inflation risks and rate expectations shaping its near-term path.
Learn more about trading Precious Metals on VT Markets here.
Trader Questions
Why is Gold Rising Slightly Despite Bearish Pressure?
Gold is supported by a softer dollar, which makes it cheaper for global buyers, even as broader pressures remain.
Why Has Gold Fallen Over 15% This Month?
Gold has dropped more than 15%, its steepest fall since October 2008, due to a stronger dollar and rising interest rate expectations.
How Do Rising Oil Prices Affect Gold?
Higher oil prices increase inflation risks, which can support gold, but also reduce the chances of rate cuts, which weighs on it.
Why Are Fed Rate Expectations Important for Gold?
Higher interest rates increase the opportunity cost of holding gold, reducing its appeal as a non-yielding asset.
What Are Markets Expecting From the Fed Now?
Traders now see a minimal likelihood of a rate cut this year, compared to expectations of two cuts before the conflict.
Start trading now – Click here to create your real VT Markets account


