Back

Consumer Price Index (CPI): Understanding its importance on the economy

What is the U.S Consumer Price Index (CPI)  

The U.S Consumer Price Index (CPI) is a measure of the average change over time in the prices paid by urban consumers for a market basket of consumer goods and services. The CPI is widely regarded as one of the most important economic indicators in the United States as it measures the rate of inflation, which is a key factor in determining the state of the economy. The CPI is compiled monthly by the Bureau of Labor Statistics (BLS) and is used by policymakers, economists, and investors to track changes in the cost of living and make informed decisions. 

What are the various categories of Consumer Price Index (CPI)  

The Consumer Price Index is comprised of various categories, each with its own weight in the overall index. The major categories of the CPI include food and beverages, housing, apparel, transportation, medical care, recreation, education and communication, and other goods and services. The weights assigned to each category reflect the relative importance of each category in the spending habits of consumers. For example, housing typically has the highest weight in the index, reflecting the fact that it is the largest expense for most households. 

Why is the CPI important  

The CPI is important because it is used to monitor inflation, which is a key economic indicator. Inflation can erode the value of money and impact the purchasing power of consumers. As such, policymakers use the CPI to make informed decisions about monetary policy, including setting interest rates. Investors also use the CPI to monitor inflation and adjust their investment strategies accordingly. Additionally, the CPI is used to adjust payments for various government programs, such as social security and other entitlements. 

What goes into the Consumer Price Index  

The CPI tracks the prices of a wide range of goods and services, including food, housing, clothing, transportation, medical care, recreation, education, and communication. The index includes more than 200 categories of goods and services, which are further divided into subcategories.  

For example, the food category includes subcategories such as meat, dairy, fruits and vegetables, and nonalcoholic beverages. The housing category includes subcategories such as rent, homeownership costs, utilities, and household furnishings.  

The transportation category includes subcategories such as gasoline, public transportation, and vehicle insurance. The CPI also considers the frequency of purchase and the relative importance of each item to the average household. The Bureau of Labor Statistics, which is responsible for compiling the CPI, surveys thousands of households to determine their spending patterns and then uses this information to weight the various goods and services in the index. The resulting CPI is a valuable tool for policymakers, businesses, and consumers in understanding inflation and making informed decisions about the economy. 

Where can you find the Consumer Price Index  

The Consumer Price Index is released by the Bureau of Labor Statistics monthly. The release schedule for the CPI is typically announced several months in advance and is available on the BLS website. The CPI is also widely reported in the media and can be found on numerous financial news websites. Additionally, investors and economists often track the CPI using specialized software and data services, which provide more detailed analysis of the index and its components. 

Consumer Confidence Index (CCI): 5 ways that the (CCI) can affect you and why it is important

What is the Consumer Confidence Index 

The Consumer Confidence Index (CCI) is a survey-based economic indicator that measures the level of optimism that consumers have in the economy. The CCI is released monthly and is closely watched by economists, investors, and policymakers as an important gauge of the health of the U.S. economy. 

Understanding how the Consumer Confidence Index works 

The CCI is compiled by the Conference Board, a non-profit research organization. The CCI is created through a survey of a random sample of 5,000 households across the U.S. Respondents are asked questions about their perceptions of current business and labor market conditions, as well as their expectations for the future.

5 ways the Consumer Confidence Index affects you 

The CCI has significant implications for consumers, businesses, and policymakers.

Here are five ways that the CCI can affect you: 

Consumer Spending: When consumers are confident in the economy, they are more likely to spend money on goods and services, which can help drive economic growth. 

Business Investment: If businesses perceive that consumers are confident in the economy, they may be more likely to invest in their operations, which can help create jobs and drive economic growth. 

Interest Rates: The CCI can also influence the actions of the Federal Reserve. If the CCI shows that consumers are optimistic about the economy, the Fed may be more likely to raise interest rates to prevent inflation. 

Stock Market: The CCI can also impact the stock market, as investors may buy or sell stocks based on their perceptions of the economy as indicated by the CCI. 

Job Market: The CCI is closely watched by policymakers as an important indicator of the health of the labor market. When the CCI is high, it can signal that consumers are more likely to be optimistic about job prospects, which can help drive employment growth. 

Why Is the Consumer Confidence Index Important 

The significance of the Consumer Confidence Index lies in its ability to reflect consumer sentiments regarding the current state and future trajectory of the economy. Administered by the Conference Board, the index comprises five questions concerning the current economic situation and three questions pertaining to future expectations. It offers valuable information on consumer spending and saving patterns, which can aid businesses and economic leaders in monitoring inflation and output levels. 

Where can you find the Consumer Confidence Index 

The Conference Board releases the CCI on the last Tuesday of every month at 10:00 a.m. ET.

The CCI is on the Conference Board’s website, financial news websites and platforms. Additionally, many financial institutions provide their own analysis and interpretation of the CCI, which can clarify the implications of the index for the broader economy. 

Mixed Market Reaction as Investors Await Key Inflation Data and Banking Sector Stability

The S&P 500 closed near the flat line on Monday, with investors anticipating crucial inflation readings, including the consumer price index report for April. Despite minor fluctuations, the broad market index ended the session at 4,138.12, reflecting a marginal gain of 0.05%. The Nasdaq Composite performed slightly better, adding 0.18% and closing at 12,256.92, while the Dow Jones Industrial Average slipped 0.17%, shedding 55.69 points to settle at 33,618.69.

Investors eagerly await key data that will influence the Federal Reserve’s future course, starting with Wednesday’s release of April’s CPI report, followed by the producer price index on Thursday. In the banking sector, select bank shares experienced slight gains at the start of the week. PacWest shares rose by 3.6% after the bank announced a dividend cut from 25 cents per share to just 1 cent per share. Western Alliance shares increased by approximately 0.6%, and big banks such as Wells Fargo and JPMorgan Chase also saw their stock prices rise. Additionally, Disney shares rose by over 2% ahead of the company’s upcoming quarterly results report on Wednesday, while Berkshire Hathaway Class A shares saw a 1% increase following the conglomerate’s first-quarter results announcement, which revealed a 12% rise in operating earnings and a cash reserve exceeding $130 billion.

Data by Bloomberg

On Monday, the market experienced mixed results with the S&P 500 ending the day with a slight gain of 0.05%. The Communication Services sector saw the highest increase with 1.27%, followed by Consumer Discretionary and Financials with 0.30% and 0.21%, respectively. On the other hand, Real Estate had the largest decline, dropping by 0.69%, followed by Industrials with 0.37%. Health Care, Consumer Staples, Materials, and Utilities also saw negative changes, ranging from -0.22% to -0.33%. Meanwhile, Energy and Information Technology experienced minimal changes, with gains of 0.07% and a slight drop of 0.02%, respectively.

Major Pair Movement

On Thursday, the dollar index remained unchanged, but it gained against the euro and lost to the yen due to increasing banking and recession concerns. Market uncertainty surrounding central bank tightening combined with worries about economic and financial stability were reflected in the decreasing inversion of Treasury and euro zone yield curves. The falling German exports and retail sales and unhealthy US Q1 productivity and labor costs raised further concerns.

The implosion of US regional bank stocks could lead to a decline in rates and risk-driven USD/JPY, pushing it back toward the banking crisis lows of April and March. A full percentage point of Fed rate cuts is being priced in by year-end, while the ECB is only expected to hike 28bp.

On Friday, the focus will be on US employment data, but concerns over banking stress will continue to be in the spotlight.

Technical Analysis

EUR/USD (4 Hours)

The EUR/USD pair has dropped below the psychological support level of 1.1000, indicating weakness as the US Dollar Index (DXY) aims for further gains. US inflation is expected to remain steady, offsetting lower credit from commercial banks with higher household earnings. Meanwhile, the Eurozone economy is facing recession risks due to declining retail demand and higher interest rates from the European Central Bank (ECB). The EUR/USD pair has lost upward momentum, struggling to stay above the resistance level at 1.1033, with the 20-period Exponential Moving Average providing support. The Relative Strength Index suggests a lackluster performance ahead. A break below 1.0942 could lead to further downside, while a recovery above 1.1095 could drive the pair to new highs.

According to technical analysis, the EUR/USD pair is currently trending lower after a period of upward movement. At present, the price targeting the lower band of the Bollinger band. It is expected that the EUR/USD will continue to consolidate and move slightly higher for today. The Relative Strength Index (RSI) is presently at 45, suggesting a neutral trend in the EUR/USD market.

Resistance: 1.1015, 1.1051

Support: 1.0986, 1.0954

XAU/USD (4 Hours)

The price of gold is holding onto its gains near $2,020, but its rise is limited by the strengthening US dollar. Traders are focused on the upcoming release of the US Consumer Price Index (CPI) data, which will impact the Federal Reserve’s interest rate outlook. Initially, there was an improvement in market sentiment, leading to a relief rally in bank stocks globally. This reduced demand for US government bonds and the dollar, but the dollar rebounded as US Treasury bond yields recovered. As a result, gold initially moved higher but failed to sustain its upward momentum as the dollar and bond yields strengthened. Market expectations for Fed interest rates may change based on the CPI data. Traders are also monitoring developments in the US banking sector crisis and statements from Federal Reserve policymakers.

The technical analysis indicates that XAU/USD is moving flat on Monday. The price is currently just below the middle band of the Bollinger Band, indicating the potential for a consolidating movement. Moreover, the Relative Strength Index (RSI) is currently at 53, indicating that XAU/USD is neutral.

Resistance: $2,030, $2,046

Support: $2,015, $2,003

Week Ahead: All Eyes on Bank of England Rate Statement, US CPI, and US PPI

Highly anticipated economic reports are set to be released this week, including the Bank of England Rate Statement, US Consumer Price Index (CPI), and US Producer Price Index (PPI). These reports are vital, providing traders and investors with essential data and ensuring they stay ahead of the dynamic market.

Consumer Price Index | US (10 May)

CPI in the US rose by 0.1% in March 2023, showcasing a slowdown in increment from February’s 0.4% increase.

According to analysts, the CPI reading for April—which will be released on 10 May—is expected to rise by 0.3%.

Takeaway: Following the negative market reaction to the Fed rate decision, the market will now be closely watching the Consumer Price Index. If the results align with the forecast, we can anticipate a slight boost to the US dollar.

Bank of England Rate Statement | UK (11 May)

During its March 2023 meeting, the Bank of England raised its key bank rate by 25bps to 4.25%, with the objective of bringing inflation back to the 2% target. 

Some analysts expect the next rate hike will be by another 25bps to 4.50%.

Takeaway: Based on last month’s hawkish inflation and wage data, the Bank of England is expected to implement another 25 basis-point rate hike. However, due to recent comments by the bank on the delayed impact of prior tightening measures, the criteria for further actions have increased. Unless there is negative economic news in the next few weeks, we predict that there will be no further adjustment in June.

Producer Price Index | US (11 May)

Producer prices for final demand in the US decreased by 0.5% month-on-month in March 2023, the largest drop since April 2020. 

The PPI data for April will be released on 11 May, with analysts expecting an increase of 0.3% from the previous month. 

Takeaway: Following the negative reaction of the market to the Fed rate decision, the focus now shifts to the Producer Price Index. If the result aligns with the forecast, we can anticipate a slight boost for the US dollar.

Gross Domestic Product | UK (12 May)

The UK economy experienced a halt in February 2023, after achieving upward growth of 0.4% in January. 

The GDP figures for March, due to be released, is expected to show an increase of 0.1%.

Takeaway: The Bank of England will rely on the latest UK GDP figures to help determine their next interest rate decision. The release of this data, if it’s in line with expectations, could potentially slow down the GBPUSD exchange rate. However, it could also signal the central bank to keep the interest rate unchanged in the next meeting.

Prelim University of Michigan Consumer Sentiment | US (12 May)

The University of Michigan’s US consumer sentiment came in at 63.5 in April 2023, up from 62 in March.

For May, analysts expect a reading of 64. 

Takeaway: The market closely watches consumer sentiment as it serves as an indicator of the public mood in the US. If the data release meets the forecast, we may see a boost for the US dollar.

Leverage Adjustment Notice – May 05, 2023

Dear Client,

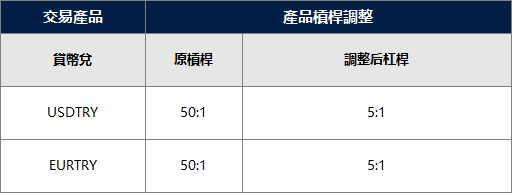
In response to the upcoming high market volatility for TRY crosses during the upcoming Turkish election, there will be adjustments for these products on May 08, 2023. Please check the details below:

1.TRY Crosses products leverage will be modified from 50:1 to 5:1

2.These products will be set to close only effective on May 08, 2023

The above data is for reference only, please refer to the MT4/MT5 software for specific data.

Friendly reminders:

1. The margin requirement of the trade may be affected by this adjustment, please make sure the funds in your account are sufficient to hold the position before this adjustment.

2. You can continue to hold the positions held during this adjustment period, but you will not be able to open new TRY Crosses product positions after the adjustment.

If you’d like more information, please don’t hesitate to contact [email protected]

US Stocks Continue Decline Amid Regional Bank Contagion Concerns with Non-Farm Payroll Report in Focus

On Thursday, the Dow Jones Industrial Average fell 0.86%, the S&P 500 slid 0.72%, and the Nasdaq Composite shed 0.49%, marking the fourth consecutive day of declines for the major indexes. The decline was caused by contagion fears in the regional bank space as PacWest’s shares tanked over 50% due to news that the California bank has been assessing strategic options, including a possible sale. The SPDR S&P Regional Bank ETF (KRE) dropped more than 5%, while Western Alliance tumbled 38% and Zions Bancorporation lost 12%.

The Federal Reserve’s 25 basis point rate hike and commentary following its Wednesday meeting were also being digested by investors. Keith Apton, managing director at UBS Wealth Management, believes that the volatility in the banking sector will help the Fed’s mission of cooling down the economy. Apton believes that regional lenders will have to constrain capital, which will indirectly cool down the economy and bring inflation down. Additionally, he does not believe that the Fed will have to raise rates any further for the rest of this year, although Friday’s nonfarm payrolls report will be important to watch.

Overall, the decline in the major indexes was due to contagion fears in the regional bank space and investors digesting the Federal Reserve’s rate hike and commentary.

Data by Bloomberg

On Thursday, the US stock market fell by 0.72%, with sectors experiencing varying degrees of decline. The financial industry saw the most significant drop at 1.29%, followed by communication services at 1.26%, and energy and industrials both declined by over 1%. Real estate and utilities were the only sectors that saw gains, with real estate up 0.92% and utilities up 0.73%. Consumer staples saw a small decline of 0.29%, while information technology, materials, consumer discretionary, and health care all declined between 0.49% to 0.81%.

Major Pair Movement

Data by VT Markets MT4

On Thursday, the dollar index remained unchanged, but it gained against the euro and lost to the yen due to increasing banking and recession concerns. Market uncertainty surrounding central bank tightening combined with worries about economic and financial stability were reflected in the decreasing inversion of Treasury and euro zone yield curves. The falling German exports and retail sales and unhealthy US Q1 productivity and labor costs raised further concerns.

The implosion of US regional bank stocks could lead to a rate decline and risk-driven USD/JPY, pushing it back toward the banking crisis lows of April and March. A full percentage point of Fed rate cuts is being priced in by year-end, while the ECB is only expected to hike 28bp.

On Friday, the focus will be on US employment data, but concerns over banking stress will continue to be in the spotlight.

Technical Analysis

EUR/USD (4 Hours)

EUR/USD remains down as the ECB hikes rates and US NFP is in focus.

The EUR/USD pair fell after the ECB meeting due to declining European bond yields and lower US yields affecting the US Dollar’s performance. The ECB announced a 25 basis point hike in interest rates, signaled likely further hikes, and stopped asset purchase program reinvestments from July 2023. Market participants expect two more rate hikes at the next two meetings. The Eurozone will release Retail Sales data for April on Friday, while the US employment report will be the key event.

According to technical analysis, the EUR/USD pair is currently trending lower after a period of upward movement. At present, the price has reached the middle band of the Bollinger band, indicating a consolidation phase. It is expected that the EUR/USD will continue to consolidate and remain within our support and resistance levels. The Relative Strength Index (RSI) is presently at 51, suggesting a neutral trend in the EUR/USD market.

Resistance: 1.1051, 1.1073

Support: 1.1015, 1.0986

XAU/USD (4 Hours)

Gold (XAU/USD) Bulls Hold Strong Ahead of US Nonfarm Payrolls Report.

XAU/USD fell with the Asian opening, but then jumped back to near record highs of $2,078.36 before closing the gap. It has since retreated to around $2,050, supported by falling US Treasury yields which put pressure on the Greenback. The ECB announced a widely anticipated 25 bps hike, with market players rushing to discount at least 2 or 3 more rate hikes. Lagarde confirmed that they are not concerned about the banking situation, and the decision to hike at a slower pace was linked to the crisis. The US employment figures are now in focus, with the market anticipating the April Nonfarm Payrolls report on Friday.

The technical analysis indicates that XAU/USD is still hovering in the high territory, but it has slowed down a bit. The price is currently just below the upper band of the Bollinger Band, indicating the potential for a downward movement. Moreover, the Relative Strength Index (RSI) is currently above 70, indicating that XAU/USD is overbought.

Resistance: $2,068, $2,058

Support: $2,046, $2,033

Economic Data

CurrencyDataTime (GMT + 8)Forecast
CHFConsumer Price Index14:300.2%
CADEmployment Change20:3021.6K
CADUnemployment Rate20:305.1%
USDAverage Hourly Earnings m/m20:300.3%
USDUnemployment Rate20:30181K
USDNon-Farm Employment Change20:303.6%

Weekly Dividend Adjustment Notice – May 04, 2023

Dear Client,

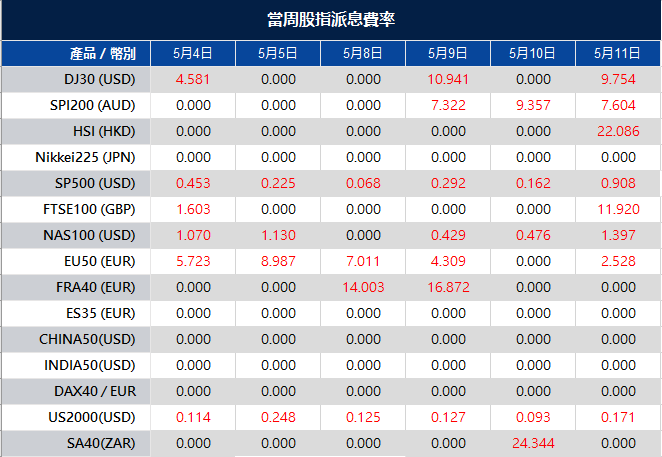
Please note that the dividends of the following products will be adjusted accordingly. Index dividends will be executed separately through a balance statement directly to your trading account, and the comment will be in the following format “Div & Product Name & Net Volume ”.

Please refer to the table below for more details:

The above data is for reference only, please refer to the MT4/MT5 software for specific data.

If you’d like more information, please don’t hesitate to contact [email protected]

Fed Raises Rates for 10th Time in Current Cycle, Signals Cautious Approach to Future Increases

On Wednesday, S&P 500 futures and Dow Jones Industrial Average futures both fell, by 0.2% and 0.2%, respectively, while Nasdaq 100 futures remained flat, up 0.06%. The drop was attributed to the Federal Reserve’s decision to increase rates by 25 basis points and concerns over contagion in the regional bank sector. PacWest’s shares plummeted more than 50% after news broke that the California bank was assessing strategic options, including a possible sale. Other regional banks, such as Western Alliance and Zions Bancorporation, also experienced sharp declines.

During a post-meeting press conference, Fed Chair Jerome Powell indicated that the committee viewed inflation as unlikely to decrease rapidly, making it inappropriate to cut rates. Stocks closed lower on Wednesday, with the Dow dropping 0.8%, the S&P 500 losing 0.7%, and the Nasdaq Composite declining by approximately 0.5%. Upcoming key economic reports, including Thursday’s initial jobless claims and Friday’s April payrolls report, will help inform the Fed’s next steps.

In addition to economic reports, investors will be closely watching several companies’ earnings releases, including Moderna’s results before the opening bell on Thursday, and after-market earnings from Apple, Lyft, DraftKings, and Coinbase.

Data by Bloomberg

On Wednesday, all sectors experienced a 0.7% decrease, with the energy sector seeing the largest decline of 1.92%. The financial sector followed closely behind, falling by 1.19%. The information technology and materials sectors also experienced significant declines of 0.83% and 1.11%, respectively. Other sectors, such as healthcare, communication services, and utilities, saw smaller declines ranging from 0.11% to 0.31%. The consumer staples and real estate sectors both fell by 0.79% and 0.59%, respectively, while the consumer discretionary and industrials sectors saw declines of 0.71% and 0.38%, respectively.

Major Pair Movement

Data by VT Markets MT4

On Wednesday, the US dollar fell against major currencies including the euro, yen, and sterling following the Federal Reserve’s meeting where Chair Jerome Powell raised the bar for further tightening to combat high inflation despite the restrictive policy and increasing financial and economic risks. Powell reiterated that inflation remains high and the labor market tight, leaving the Fed’s policy options open. The ISM non-manufacturing index was large as forecast, with prices paid remaining high and new orders likely driven by export orders surging.

Investors are now awaiting Friday’s employment report to assess whether ADP’s report of 296k jobs in April versus March’s 142k is valid or whether other factors like falling job openings and rising layoffs point to a decline in non-farm payrolls forecasted at 180k. In addition, jobless claims are set to be released on Thursday, while the European Central Bank is expected to hike rates twice by year-end.

Meanwhile, the dollar index and Treasury yields dropped to new session lows after the Fed replaced the line suggesting further rate hikes with watching incoming data to determine if more hikes “may be appropriate.” Sterling managed a 0.78% gain despite coming off 11-month highs, while EUR/USD rose by 0.56% after approaching April’s trend highs. There was also news from the Kremlin claiming Ukraine had attempted to kill President Putin in a drone attack, introducing a new risk curve ball.

Technical Analysis

EUR/USD (4 Hours)

The EUR/USD pair reached a high of 1.1091 after the Federal Reserve raised interest rates to 5.00-5.25%, the highest since 2007. However, the dollar then recovered as the Fed signaled a potential pause in further tightening. Data released on Wednesday showed the Euro area’s unemployment rate unexpectedly dropped to 6.5%. The European Central Bank (ECB) meeting, where a 25 basis points interest rate hike is expected, will likely overshadow upcoming data releases, including the final readings of the HCOB Services and Composite PMI and the Euro area’s March Producer Price Index.

Following the ECB meeting, attention will shift to the US Non-Farm Payrolls (NFP) on Friday. The ADP Employment report showed an increase in private payrolls of 296,000 in April, surpassing expectations. Q1 Unit Labor Costs and the weekly Jobless Claims are also due on Thursday.

Based on technical analysis, the EUR/USD pair is continuing to move higher and has been able to break above the 1.1000 level, with an attempt to reach the 1.1100 level. Currently, the price has moved higher, pushing the upper band of the Bollinger band to a higher level. It is anticipated that the EUR/USD will reach the resistance level at 1.1095. The Relative Strength Index (RSI) is currently at 66, indicating that the market is bullish on the EUR/USD.

Resistance: 1.1095, 1.1129

Support: 1.1054, 1.1018

XAU/USD (4 Hours)

Gold (XAU/USD) prices continued to climb, reaching $2,026.80 per troy ounce, as the US dollar weakened ahead of the Federal Reserve’s monetary policy announcement. The US reported positive job creation numbers with the private sector adding 296,000 new positions in April, double the market’s expectations, and the ISM Services PMI printing at 51.9 in April, higher than anticipated. However, the S&P Global downwardly revised the US Services PMI and Composite PMI. Wall Street remains in wait-and-see mode, with the three major indexes in the green, while Treasury yields retreat for the second day, adding pressure on the US dollar. Analysts expect the Fed to hike rates by 25 basis points and signal a pause in its tightening cycle, but most anticipate Chairman Jerome Powell to leave the door open for additional tightening depending on macroeconomic data.

The technical analysis suggests that XAU/USD is showing signs of moving lower after reaching a high of $2,084. The price is currently inside the Bollinger Band and below the upper band, indicating the potential for a downward movement. Additionally, the Relative Strength Index (RSI) is currently above 70, indicating that XAU/USD is overbought.

Resistance: $2,068, $2,058

Support: $2,033, $2,020

Economic Data

CurrencyDataTime (GMT + 8)Forecast
EURMain Refinancing Rate20:153.75%
EURMonetary Policy Statement20:15
USDUnemployment Claims20:30239K
EURECB Press Conference20:45
CADBOC Gov Macklem Speaks00:50 (5th May)51.8

VT Markets Launches King of the Hill Trading Contest With Over US$60,000 Prize Pool

Sydney, Australia, 3rd May 2023 – VT Markets, a leading online trading platform, has announced the launch of its highly anticipated King of the Hill Trading Contest. The contest will run from 1 May to 31 July 2023, granting the world’s best traders an exclusive chance at global recognition.

First launched early this year to a hugely positive reception, the popular competition is now set to build on its inaugural success. In addition to new participating regions, this latest edition will feature an expanded prize pool of over US$60,000, to be split between participating traders based on their realised profit.

Beyond cash prizes, top performers will also be featured on VT Markets’ Wall of Fame, allowing them to grow their influence and establish themselves among the world’s elite traders.

Commenting on the numerous incentives on offer, a VT Markets representative stated: “We are delighted to bring traders these exciting opportunities for higher earning potential and greater rewards. By leveraging our innovative copy trading platform, VTrade, traders can now showcase their trading expertise and access unparalleled chances for success.”

For more information, visit the relevant King of the Hill Trading Contest page below:

For Europe https://bit.ly/koth_eu

For Southeast Asia https://bit.ly/koth_asia

For Greater China https://bit.ly/koth_gcn

About the company:

VT Markets is a regulated multi-asset broker with a presence in over 160 countries. The broker has won many international accolades including Best Customer Service and Fastest Growing Broker. Its mission is to make trading an easy, accessible, and seamless experience for everyone.

For more information, please visit www.vtmarkets.com or email [email protected] 

Follow them at 

Trade 2 New Currency Pairs With VT Markets – May 03, 2023

Dear Client,

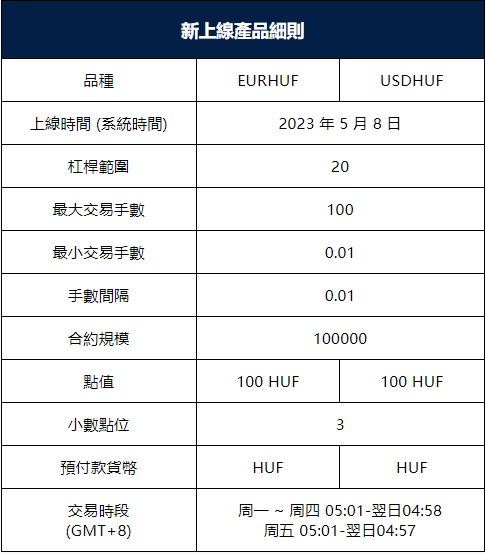
To provide you with more diverse trading options, VT Markets will launch 2 new products on 8th May 2023.

You can now trade the world’s popular products on MetaTrader 4 and 5 with the following specifications:

The above data is for reference only, please refer to the MT4 and MT5 platforms for the updated data.

For more information, please contact [email protected]

Back To Top
server

Hello there 👋

How can I help you?

Chat with our team instantly

Live Chat

Start a live conversation through...

  • Telegram
    hold On hold
  • Coming Soon...

Hello there 👋

How can I help you?

telegram

Scan the QR code with your smartphone to start a chat with us, or click here.

Don’t have the Telegram App or Desktop installed? Use Web Telegram instead.

QR code