Back

What is Forex Trading: A comprehensive overview

Forex is a short term for “foreign exchange,” which means changing one currency to another. 

Let’s say you’re travelling from France to the United States. You’ll need to change your euros to US dollars. When you go to the bank, you’ll see a big board with names of different currencies and numbers. This board shows exchange rates, which are the price of one currency compared to another. For instance, the exchange rate for €1 is $1.2. 
source: canva.com

Suppose you exchange €1000 for $1200 before your trip. This means you participated in the Forex market

However, when you’re on vacation, you’ll notice that the exchange rate has changed, and now €1 is worth less in US dollars than when you exchanged your money. As a result, your €1000 is now worth only $1100 instead of $1200. This means your euros can buy fewer things in the United States than you initially thought. 

In the financial world, Forex traders aim to profit from the changes in exchange rates by buying and selling currencies at the right time. 

The Forex market is the world’s largest and most liquid financial market. It is estimated that the daily trading volume of the Forex market has reached $7.5 trillion USD. To put this into perspective, the stock market in the United States has a daily trading volume of around $400 billion USD, which is just a fraction of the Forex market’s volume. 

To help you visualise just how big the Forex market is, imagine the world’s largest shopping mall on Black Friday, with millions of people buying and selling goods all at once. Now, imagine that happening every single day, 24 hours a day, 5 days a week, all over the world. That’s how big the Forex market is. 

To facilitate trading around the clock, the Forex market has several financial centres located in different parts of the world, including New York, London, Tokyo, and Sydney. Each financial centre has its opening and closing hours, which overlap to create a continuous trading session

For example, when it’s morning in New York, and the Forex market opens, it’s already afternoon in London, where the market is already open. This overlap in market hours allows traders to trade in multiple markets simultaneously and take advantage of the increased liquidity and volatility. 
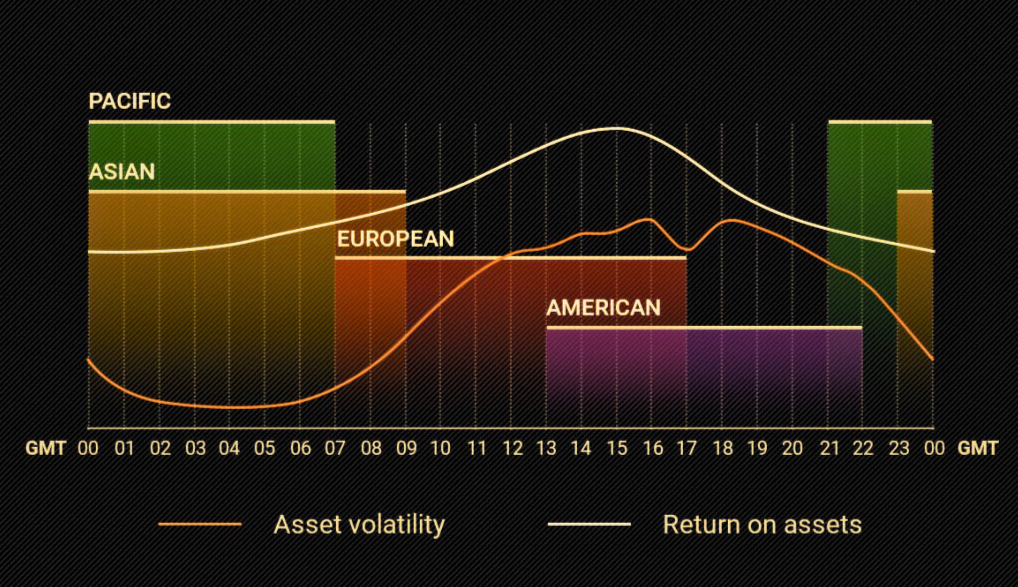
source: Image courtesy of independent brokerage

Forex plays a crucial role in facilitating international trade and investment by allowing businesses and individuals to exchange one currency for another. Without Forex trading, it would be difficult to conduct international transactions, as businesses and individuals would have to rely on their own country’s currency. 

The Forex market is decentralised, meaning that it does not have a central location like the New York Stock Exchange or the London Stock Exchange. Instead, it operates through a global network of big commercial banks, central banks, multinational corporations, investors, hedge funds, and individual traders who buy and sell currencies electronically. 

Commercial banks are the biggest players in the Forex market. They trade currencies for lots of different clients, such as other banks, big companies, and people who want to exchange money for their travels. When they trade currencies, they help to set the prices for all the other traders in the market. The big players that significantly influence the market are called market makers

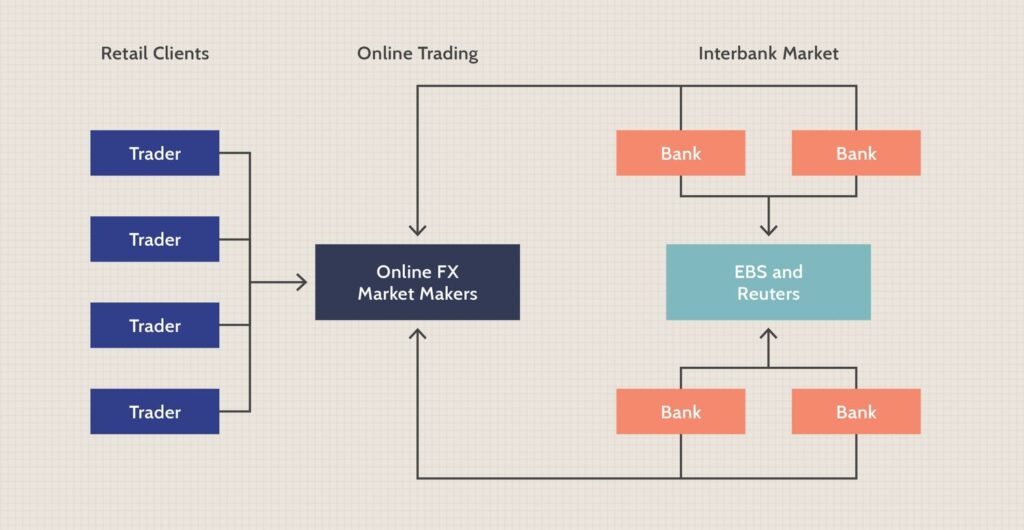
The Forex market operates through two main channels: the interbank market and the over-the-counter (OTC) market

source: investopedia.com

The interbank market is where banks and financial institutions trade currencies with each other, acting as both buyers and sellers. For example, if a bank needs to exchange US dollars for euros, it will turn to the interbank market to find another bank willing to sell euros and buy US dollars. 

On the other hand, the OTC market is where trades are conducted directly between two parties without using a centralized exchange or clearinghouse. For example, if you’re travelling to another country and need to exchange your currency for the local currency, you might go to a currency exchange booth at the airport. The currency exchange booth acts as an OTC market maker, buying your currency from you and selling you the local currency at a markup. 

Forex brokers like VT Markets play a crucial role in the Forex market by providing a platform for traders to buy and sell currency pairs. They act as intermediaries between traders and the market, executing trades on behalf of their clients. 

As a broker’s client, you have the opportunity to earn profits by speculating on the movement of currency pairs. Brokers also offer various tools and resources to help traders make informed decisions, such as market analysis, educational materials, and trading signals. 

Choosing a reputable and regulated broker is important, as the Forex market is known for its volatility and potential risks. However, with the right knowledge and strategy, trading Forex can be a lucrative opportunity for those willing to put in the effort to learn and practice. 

Summary:
  • Forex means “foreign exchange” and involves changing one currency to another. 
  • Exchange rates are the prices of one currency compared to another and fluctuate constantly in response to various economic and political factors. 
  • Forex traders aim to profit from changes in exchange rates by buying and selling currencies at the right time. 
  • The Forex market is the world’s largest and most liquid financial market, with a daily trading volume of $7.5 trillion USD. 
  • The Forex market operates through a global network of big commercial banks, central banks, multinational corporations, investors, hedge funds, and individual traders who buy and sell currencies electronically. 
  • The Forex market is decentralised and operates through two main channels: the interbank market and the over-the-counter (OTC) market. 
  • Forex brokers play a crucial role in the Forex market by providing a platform for traders to buy and sell currency pairs. 

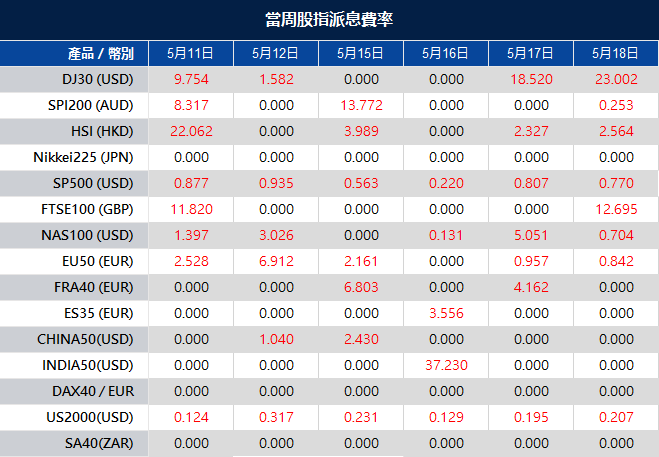
Weekly Dividend Adjustment Notice – May 11, 2023

Dear Client,

Please note that the dividends of the following products will be adjusted accordingly. Index dividends will be executed separately through a balance statement directly to your trading account, and the comment will be in the following format “Div & Product Name & Net Volume ”.

Please refer to the table below for more details:

The above data is for reference only, please refer to the MT4/MT5 software for specific data.

If you’d like more information, please don’t hesitate to contact [email protected]

Nasdaq Rises on Tame Inflation Report, Treasury Yields Fall

The Nasdaq Composite closed higher as investors turned to tech stocks following a relatively modest inflation report. The tech-heavy index gained 1.04% to reach a closing value of 12,306.44, while the S&P 500 added 0.45% to close at 4,137.64. In contrast, the Dow Jones Industrial Average dipped slightly by 0.09% to end at 33,531.33.

April’s consumer prices rose 4.9% compared to the previous year, falling short of economists’ expectations of a 5% increase. This news, along with the in-line month-over-month inflation rate of 0.4% in April, caused Treasury yields to decline. The 2-year Treasury yield fell by around 11 basis points to 3.91%, and the 10-year rate declined by 8 basis points to 3.44%.

While the market reacted positively to the tempered inflation report, cyclical stocks linked to the economy traded lower, with companies like Nike and Caterpillar ending the session in negative territory. Additionally, Airbnb and Twilio saw significant declines of 10.9% and 12.6%, respectively, following weak forecasts. Rivian, an electric vehicle maker, closed 1.8% higher after reporting a narrower-than-expected loss. The focus also turned to earnings reports from Disney and Robinhood.

Investors remained cautious about a potential full-fledged rally despite the more favorable inflation figures. Concerns over the U.S. debt ceiling also weighed on traders’ minds, as the possibility of an agreement being reached before June 1—when the U.S. Treasury Department says a default could occur—became uncertain. President Joe Biden met with congressional leaders, but limited progress was reported. Another meeting is scheduled for Friday to address the issue.

Data by Bloomberg

On Wednesday, the overall market showed a positive trend, with all sectors experiencing a 0.45% gain. The Communication Services sector had the highest increase of 1.69%, followed by Information Technology with a gain of 1.22%. Real Estate and Utilities also performed well, rising by 0.98% and 0.94% respectively.

Consumer Discretionary showed a modest increase of 0.63%, while Health Care and Materials had smaller gains of 0.27% and 0.05% respectively. On the other hand, Consumer Staples experienced a slight decline of -0.15%. Industrials and Financials sectors faced larger decreases of -0.32% and -0.58% respectively. The Energy sector experienced the most significant decline, dropping by -1.15%.

Major Pair Movement

The U.S. dollar initially weakened in response to the Consumer Price Index (CPI) data, which fell short of some expectations, indicating that it may not support the Federal Reserve’s position against rate cuts in the second half of the year. However, risk-off sentiment and book-squaring helped the dollar recover from its early losses, except against the safe-haven Japanese yen. The decline in Treasury yields, driven by the weaker-than-expected inflation data and renewed weakness in regional bank stocks, contributed to the dollar’s recovery.

The Japanese yen benefited the most from the stock market decline and falling yields, as Japanese Government Bond (JGB) yields are influenced by the Bank of Japan’s (BoJ) yield curve control and quantitative easing measures. Speculation is growing that the BoJ’s policy review, amid inflation levels surpassing its target, may lead to higher JGB yields. Additionally, a report highlighting Japanese life insurers’ inclination to reduce their Treasury holdings in favor of JGBs further fueled the exit of long positions in USD/JPY and yen shorts.

Meanwhile, the euro initially rebounded against the dollar following the CPI release but later experienced a modest 0.15% increase as risk-off flows supported demand for the safe-haven dollar. Similarly, sterling’s post-CPI rally to new one-year highs dissipated due to derisking and ahead of the Bank of England’s meeting on Thursday.


Technical Analysis

EUR/USD (4 Hours)

EUR/USD Lacks Direction as US Dollar Recovers Despite ECB Hawkish Comments

The US dollar initially weakened in response to US inflation data, causing the EUR/USD pair to briefly surpass 1.1000. However, the US dollar later regained its footing, pushing the pair back below that level. The EUR/USD pair is currently moving sideways without a clear direction, despite the European Central Bank (ECB) members’ hawkish comments.

ECB Governing Council member Mario Centeno stated that policy would remain tight for some time, but interest rates might start to decline in 2024. Bloomberg reported that some ECB members are considering a rate hike in September, assuming earlier hikes in June and July. Meanwhile, German inflation data confirmed a 7.2% annual increase in April.

In the US, the Consumer Price Index (CPI) showed a slight decrease to 4.9% in April from 5% in March, while the Core CPI dropped to 5.5% from 5.6% in March. Initially, the US dollar faced significant losses but eventually rebounded and turned positive. Market participants are pricing in a potential pause in rate hikes from the Federal Reserve in June. On Thursday, the US will release additional inflation data with the Producer Price Index (PPI).

Chart EURUSD by TradingView

According to technical analysis, the EUR/USD pair is currently trending lower after reached the middle band of the Bollinger band. It is expected that the EUR/USD will continue to move back lower to reach the lower band of the Bollinger band. The Relative Strength Index (RSI) is presently at 42, suggesting a neutral trend but lower in the EUR/USD market.

Resistance: 1.0990, 1.1032

Support: 1.0965, 1.0939

XAU/USD (4 Hours)

XAU/USD Retreats as US Inflation Data Spurs Speculation on Fed Rate Hike Chances

Following the announcement of US inflation data, spot gold initially reached a peak of $2,048.14 per troy ounce but has since declined and is currently trading around $2,025. The rise in the US Consumer Price Index (CPI), with a 4.9% year-on-year increase in April and a 0.4% month-on-month increase in line with expectations, led to a surge in XAU/USD. However, the inflation rate has been gradually easing from its previous record highs in mid-2022.

The release of the inflation figures prompted speculators to factor in reduced chances of a rate hike by the Federal Reserve (Fed) in July. This resulted in a rally in stock markets as investors hoped that the Fed would maintain its current stance, reducing the risk of an economic downturn. Consequently, the US dollar initially weakened across the foreign exchange (FX) market.

Although Wall Street opened on a positive note, sentiment quickly shifted, allowing the US dollar to recover its losses against major currencies. Similarly, US Treasury yields initially rose but subsequently fell back to their pre-announcement levels, remaining at the lower end of the daily range. Currently, stock markets are trading with mixed results, with the Dow Jones Industrial Average (DJIA) in negative territory, the S&P 500 struggling to stay afloat, and the Nasdaq Composite performing the best, showing a gain of 78 points.

Chart XAUUSD by TradingView

The technical analysis indicates that XAU/USD is moving higher on Wednesday. The price is currently just above the middle band of the Bollinger Band, indicating the potential for a consolidating movement with higher potential. Moreover, the Relative Strength Index (RSI) is currently at 54, indicating that XAU/USD is considered neutral but slightly bullish.

Resistance: $2,038, $2,052

Support: $2,015, $2,003

Economic Data

CurrencyDataTime (GMT + 8)Forecast
GBPBOE Monetary Policy Report19:00 
GBPMPC Official Bank Rate Votes19:007-0-2
GBPMonetary Policy Summary19:00 
GBPOfficial Bank Rate19:004.50%
GBPBOE Gov Bailey Speaks19:30 
USDCore PPI m/m20:300.2%
USDPPI m/m20:300.3%
USDUnemployment Claims20:30245K

May Futures Rollover Announcement – May 10, 2023

Dear Client,

New contracts will automatically be rolled over as follows:

Please note:
• The rollover will be automatic, and any existing open positions will remain open.

• Positions that are open on the expiration date will be adjusted via a rollover charge or credit to reflect the price difference between the expiring and new contracts.

• To avoid CFD rollovers, clients can choose to close any open CFD positions prior to the expiration date.

• Please ensure that all take-profit and stop-loss settings are adjusted before the rollover occurs.

• All internal transfers for accounts under the same name will be prohibited during the first and last 30 minutes of the trading hours on the rollover dates

If you’d like more information, please don’t hesitate to contact [email protected]

Stocks Slip as Investors Await Inflation Data and Debt Limit Progress

Stocks closed lower on Tuesday as investors prepared for upcoming inflation reports and monitored progress on the U.S. debt limit. The S&P 500 and the Nasdaq Composite experienced declines of 0.46% and 0.6% respectively, while the Dow Jones Industrial Average remained relatively flat with a 0.17% decline. President Joe Biden and House Speaker Kevin McCarthy held a meeting to discuss the debt limit, but no definitive progress was expected as the two remain divided on tying the debt ceiling increase to spending cuts. Treasury Secretary Janet Yellen warned of the economic catastrophe that could result from failing to raise the debt ceiling, and concerns over inflation and the banking sector also weighed on investor sentiment.

In the market, PacWest shares experienced volatility but closed up 2.4%, while the SPDR S&P Regional Banking ETF ended the day down slightly. Lucid, PayPal, and Skyworks saw declines following the release of their quarterly reports, while Palantir saw a significant jump of 23% after reporting strong earnings and positive guidance. Traders are now eagerly awaiting the consumer price index report for April and the producer price index report for the newest data on inflation. Economists anticipate a 0.4% month-over-month increase in inflation for April and a 5% year-over-year increase, with core prices expected to have risen by 0.4%, excluding food and energy components.

Data by Bloomberg

On Tuesday, the overall stock market experienced a decline of 0.46%. Among the sectors, there were mixed performances. Industrials showed a slight increase of 0.17%, while energy and consumer discretionary sectors saw minor gains of 0.03% and 0.02% respectively. Utilities and consumer staples sectors experienced modest declines of 0.20% and 0.30%. Financials, real estate, communication services, health care, information technology, and materials sectors all faced greater declines ranging from 0.37% to 0.93%.

Major Pair Movement

The dollar index saw a 0.2% increase as the euro weakened due to concerns over Chinese trade data. Despite tightening credit, New York Fed President John Williams expressed reluctance towards policy easing, suggesting that the worst phase of stress in the banking sector may be over. The eurozone and German data have taken a negative turn recently, causing the EUR/USD to fall by 0.3% and reach last week’s lows. The yield spreads between two-year bonds and Treasuries have become 21 basis points more damaging compared to April’s peak.

Although the market still anticipates 66 basis points of Federal Reserve rate cuts by the end of the year, 6-month Treasury yields increased by 5 basis points on Tuesday, reflecting the ongoing refunding and the risk associated with the unresolved debt ceiling issue. The recent reports from the Fed on lending standards and financial stability provided some relief as they indicated less tightening of lending standards than expected and lower loan demand despite recent regional bank failures. The April NFIB report revealed the weakest conditions in over a decade but attributed the restraint not to tighter credit but rather to a persistent shortage of workers. The performance of U.S. regional bank stock indexes and Wednesday’s inflation data will be influential in determining the direction of Treasury yields and the dollar.

The safe-haven yen remained steady against the euro and the Australian dollar, which was negatively impacted by declining Chinese imports and de-risking. Japan’s unexpected decrease in household spending and real wage decline had minimal impact, as the focus remained on the Bank of Japan’s policy review. The British pound recovered slightly after a brief setback from Monday’s one-year peak in anticipation of U.S. CPI data and the upcoming Bank of England meeting on Thursday.

Technical Analysis

EUR/USD (4 Hours)

EUR/USD Extends Decline as US Dollar Strengthens Ahead of Crucial Data

The EUR/USD currency pair continued to retreat on Tuesday, falling below 1.1000 and extending its decline from monthly highs. Despite hawkish comments from European Central Bank (ECB) members, the Euro underperformed, while the US Dollar gained strength supported by higher US Treasury yields in anticipation of important data releases. ECB members, including Martins Kazaks and Peter Kazimir, spoke about the possibility of further rate hikes, while Isabel Schnabel highlighted the need for more efforts to bring inflation back to target. Mario Centeno is also scheduled to speak on Wednesday. The Euro remained the weakest currency among the G10 currencies. The market focus now turns to the upcoming US April Consumer Price Index (CPI), which is expected to show an acceleration in headline inflation and could influence the Federal Reserve’s monetary policy expectations. The ongoing debt ceiling issue is also gaining attention, adding to market uncertainty.

According to technical analysis, the EUR/USD pair is currently trending lower, reaching the lower band of the Bollinger band. It is expected that the EUR/USD will continue to move back lower but need to move slightly higher to reach the middle band of the Bollinger band. The Relative Strength Index (RSI) is presently at 42, suggesting a neutral trend but lower in the EUR/USD market.

Resistance: 1.0990, 1.1032

Support: 1.0965, 1.0939

XAU/USD (4 Hours)

XAU/USD Consolidates as Risk-Aversion Persists, US Dollar Gains Ground

Gold (XAU/USD) remained consolidated around $2,030 per troy ounce as risk aversion persisted, driving demand for both gold and the US Dollar. The US Dollar gained strength against other currencies, supported by concerns about the banking system’s health and the release of the Federal Reserve’s Senior Loan Officer Opinion Survey, which showed tightened lending standards and weakened credit demand in the US. Wall Street closed in the red, reflecting the negative market sentiment. Traders are now focused on the upcoming release of the April Consumer Price Index (CPI), with expectations of a 5% annualized increase in inflation. A lower-than-expected CPI could fuel speculation of a potential rate cut by the Federal Reserve.

The technical analysis indicates that XAU/USD is moving higher on Monday. The price is currently just above the middle band of the Bollinger Band, indicating the potential for a consolidating movement with higher potential. Moreover, the Relative Strength Index (RSI) is currently at 56, meaning that XAU/USD is considered neutral but slightly bullish.

Resistance: $2,038, $2,052

Support: $2,015, $2,003

Economic Data

CurrencyDataTime (GMT + 8)Forecast
USDConsumer Price Index (Monthly)20:300.4%
USDConsumer Price Index (Yearly)20:305.0%
USDCore Consumer Price Index (Monthly)20:300.3%

Updated Leverage for US Share CFDs – May 09, 2023

Dear Client,

To provide the best trading experience possible, VT Markets will modify the available leverage for US share CFDs on 15 May 2023:

The above data is for reference only, please refer to the MT4/MT5 software for specific data.

Friendly reminders:
All specifications for US shares stay the same except leverage.

As a result, the margin requirements for the trading products above will be lowered.

If you’d like more information, please don’t hesitate to contact [email protected]

United States Non-Farm Payroll: What is it and why is important

What is NFP and Why is Important?

The Non-Farm Payroll (NFP) report is a monthly economic release that provides insight into the employment situation in the United States. It is a highly significant economic indicator and is widely used by investors, traders, and policymakers to evaluate the health of the U.S. economy.

Impact of Nonfarm Payroll on the Foreign Exchange Market

The NFP report can significantly impact the foreign exchange (Forex) market. If the report shows more jobs added than expected, it can indicate a strong economy, leading to an increase in the value of the U.S. dollar. Conversely, if the report indicates fewer jobs added than expected, it can signal a weak economy and lead to a decrease in the value of the U.S. dollar.

Non-Farm Payroll Report Employment Change

The NFP employment change measures the number of jobs added or lost in the U.S. economy, excluding the farming industry. It is issued on the first Friday of each month by the U.S. Bureau of Labor Statistics and is based on data collected in the previous month.

How to read the Non-Farm Payroll Report  

While the NFP report can be complex, it offers valuable insights to investors and traders. It includes critical data such as the unemployment rate, the number of jobs added or lost, and the average hourly earnings. Investors and traders analyze this information to assess the economy’s health and make investment decisions.

Where to find the Non-Farm Payroll Report

The NFP report, released on the first Friday of every month at 8:30 a.m. Eastern Time (ET), can cause significant volatility in financial markets.

It is available on the website of the U.S. Bureau of Labor Statistics, as well as various financial news outlets and online platforms. Monitoring the NFP, along with other economic indicators, allows investors, traders, and policymakers to gain insights into the health of the U.S. economy and make informed decisions. Thus, comprehending the Non-Farm Payroll report is crucial for making better investment decisions.

Gross Domestic Product (GDP): Formula and how to use it

What is Gross Domestic Product (GDP)

Gross Domestic Product (GDP) is a measure of the economic activity of a country. It is the total monetary value of all the goods and services produced within a country’s borders in a specific period, usually a year. GDP is often used as an indicator of a country’s economic health and overall standard of living. 

Understanding Gross Domestic Product (GDP) 

GDP is an important measure of a country’s economic activity. It provides a snapshot of a country’s economy at a specific point in time. It is important to understand that GDP is not a measure of a country’s wealth or standard of living, but rather a measure of its economic activity. It is calculated by adding up the total value of all goods and services produced within a country’s borders, including exports and imports. 

Types of Gross Domestic Product 

Nominal GDP 

Nominal GDP is the total value of all goods and services produced within a country’s borders at current market prices. Nominal GDP does not consider the effects of inflation or deflation on the economy. 

Real GDP 

Real GDP is the total value of all goods and services produced within a country’s borders adjusted for inflation or deflation. Real GDP is often used as a measure of a country’s economic growth, as it considers changes in the price level. 

GDP Per Capita 

GDP per capita is the total GDP of a country divided by its population. This measure is often used to compare the economic activity of different countries. 

GDP Growth Rate 

GDP growth rate is the percentage change in a country’s GDP from one period to another. It is often used to measure the health and growth of a country’s economy. 

GDP Purchasing Power Parity (PPP) 

GDP purchasing power parity (PPP) considers the differences in the cost of living between countries. It adjusts for differences in the prices of goods and services between countries to provide a more accurate measure of economic activity. 

GDP Formula 

The formula for calculating GDP is: 

GDP = C + I + G + (X-M) 

Where: 

C = Personal consumption expenditures 

I = Gross private domestic investment 

G = Government consumption expenditures and gross investment 

X = Exports of goods and services 

M = Imports of goods and services 

How to Use GDP Data and where to find them

GDP data is useful for analyzing a country’s economic activity and identifying trends in specific industries or sectors. It can be used to compare the economic activity of different countries and to determine if an economy is growing or contracting.

Policymakers, investors, and economists often use GDP data to make informed decisions and to gain insights into the health of the economy.

Gross Domestic Product data can be found in the National Accounts dataset portal, and in the Data Tables tab of the International Financial Statistics dataset portal.

Is a High GDP Good? 

A high Gross Domestic Product (GDP) generally indicates a strong and growing economy. It means that the country is producing more goods and services, creating more job opportunities, and generating higher incomes. A high GDP can also attract foreign investments, which can further boost economic growth. Additionally, a high GDP can provide the government with more resources to invest in public goods and services, such as infrastructure, education, and healthcare.

However, a high GDP alone does not necessarily equate to a better quality of life for all citizens, as income inequality and other social issues can persist. Therefore, while a high GDP can bring many benefits, it should not be the only measure of a country’s overall well-being.

Federal Interest Rates: 5 ways they affect your money

What is the U.S Federal Interest Rates 

The Federal Reserve (Fed) sets the interest rates that banks charge each other for short-term loans, known as the federal funds rate. The federal funds rate is the benchmark for other interest rates, such as mortgage rates, credit card rates, and car loan rates. The Fed has two primary tools for controlling interest rates: open market operations and the discount rate. Open market operations involve buying and selling Treasury securities in the open market to influence the supply of money in the economy. The discount rate is the rate at which banks can borrow money directly from the Federal Reserve. 

5 ways Federal Interest Rates affect your money 

Interest rates have a significant impact on the economy, and changes in interest rates can affect consumers in many ways: 

Mortgages: When the Federal Reserve raises interest rates, mortgage rates tend to increase, which can make it more difficult for people to buy homes. 

Credit Cards: Credit card companies typically charge variable interest rates, which are often tied to the prime rate. When the Federal Reserve raises interest rates, the prime rate increases, and credit card rates follow. 

Car Loans: When interest rates rise, car loan rates tend to follow. This can make it more expensive to finance a car. 

Savings Accounts: When interest rates rise, savings account rates tend to increase as well. This can be good news for savers, as they can earn more interest on their savings. 

Inflation: The Federal Reserve raises interest rates to combat inflation. When inflation is high, interest rates tend to be high as well. High interest rates can help keep inflation under control, but they can also make it more expensive for consumers to borrow money. 

Why is the Federal Interest Rates important 

The Federal Reserve sets interest rates to achieve its dual mandate of price stability and maximum employment. The Fed raises interest rates to slow down inflation and lower interest rates to stimulate the economy. The Federal Reserve also uses interest rates to manage the money supply in the economy. By increasing or decreasing the money supply, the Fed can affect the overall level of economic activity. 

Interest rates also play a critical role in financial markets. Changes in interest rates can affect the prices of stocks, bonds, and other financial assets. For example, when interest rates rise, the prices of bonds tend to fall, and when interest rates fall, the prices of bonds tend to rise. 

What makes the Federal Reserve (Fed) change Interest Rates 

The Federal Reserve changes interest rates based on its assessment of the economy’s performance. The Fed’s policymaking body, the Federal Open Market Committee (FOMC), meets regularly to assess economic conditions and determine whether to raise, lower or maintain interest rates. The FOMC considers a range of economic indicators, including inflation, unemployment, and economic growth, when making its decisions. 

In general, the Federal Reserve raises interest rates when it wants to slow down inflation, and it lowers interest rates when it wants to stimulate economic growth. The Fed may also change interest rates in response to external factors such as changes in the global economy or financial market instability. 

Where can you find the Federal Interest Rates 

The Federal Reserve releases information about interest rates through its website and other public channels. The Federal Reserve publishes the minutes of the FOMC meetings, which provide insight into the committee’s thinking and decisions.

Federal Funds Rate: What it is and why is important

What is the U.S Federal Funds Rate 

The U.S Federal Funds Rate refers to the interest rate at which depository institutions lend and borrow money from each other overnight to maintain their reserve requirements set by the Federal Reserve. The Federal Reserve sets a target for the Federal Funds Rate, and then uses open market operations to adjust the supply of money to keep the rate within the target range. 

How does the U.S Federal Funds Rate work 

The Federal Funds Rate is the rate at which banks lend to one another to meet their reserve requirements.

Banks are required to keep a certain amount of cash on hand, which is known as a reserve requirement.

The Federal Reserve uses the Federal Funds Rate as a tool to influence the supply of money and credit in the economy. When the Federal Reserve increases the Federal Funds Rate, it becomes more expensive for banks to borrow money, and therefore they are less likely to lend to consumers and businesses. This results in a decrease in the money supply and a contractionary effect on the economy.

Conversely, when the Federal Reserve decreases the Federal Funds Rate, it becomes cheaper for banks to borrow money, and they are more likely to lend to consumers and businesses. This results in an increase in the money supply and an expansionary effect on the economy. 

Why is the U.S Federal Funds Rate important 

The U.S. Federal Funds Rate is a valuable tool used by the Federal Reserve to manage the economy. Changes in the Federal Funds Rate can significantly impact borrowing costs for consumers and businesses, which can affect spending and investment decisions.

For example, if the Federal Reserve raises the Federal Funds Rate, mortgage rates and other loan rates will increase, making it more expensive for consumers to borrow money to buy a house or a car. This can lead to a slowdown in the housing market and a decrease in consumer spending.

On the other hand, if the Federal Reserve lowers the Federal Funds Rate, mortgage rates and other loan rates will decrease, making it easier for consumers to borrow money and increasing consumer spending. 

What are the differences between the Federal Funds Rate and Regular Interest Rates 

The Federal Funds Rate is the interest rate that banks charge each other for overnight loans to meet reserve requirements. Regular interest rates, on the other hand, refer to the interest rates that banks charge consumers and businesses for borrowing money.

The Federal Funds Rate is set by the Federal Reserve and is used as a tool to influence the money supply and credit in the economy, while regular interest rates are set by banks based on their cost of funds and risk factors. The Federal Funds Rate is typically lower than regular interest rates, as it is a short-term rate and banks are lending to each other, while regular interest rates are based on the longer-term risk and cost of lending to consumers and businesses. 

Where can you find the Federal Funds Rate  

The Federal Reserve announces the Federal Funds Rate eight times a year after the Federal Open Market Committee (FOMC) meetings. The FOMC is responsible for setting the target range for the Federal Funds Rate, and the announcement is made at the end of each meeting.

The Federal Reserve also publishes the minutes of the FOMC meetings, which provide details on the discussions and decisions made by the committee.

The Federal Funds Rate can also be found on various financial news websites and is closely monitored by economists, investors, and financial market participants. 

Back To Top
server

Hello there 👋

How can I help you?

Chat with our team instantly

Live Chat

Start a live conversation through...

  • Telegram
    hold On hold
  • Coming Soon...

Hello there 👋

How can I help you?

telegram

Scan the QR code with your smartphone to start a chat with us, or click here.

Don’t have the Telegram App or Desktop installed? Use Web Telegram instead.

QR code