Back

Inside the oil market: Global impact, main players, and investment opportunities 

The global oil market is a behemoth in the world of finance and economics, wielding significant influence over numerous sectors and individual lives. 

In 2022, the world maintained an average production of approximately 80.75 million barrels of oil every day, which includes condensates. This translates to an annual crude oil production of about 29.5 billion barrels, contributing to a market value that surpasses $2 trillion at current market rates. 
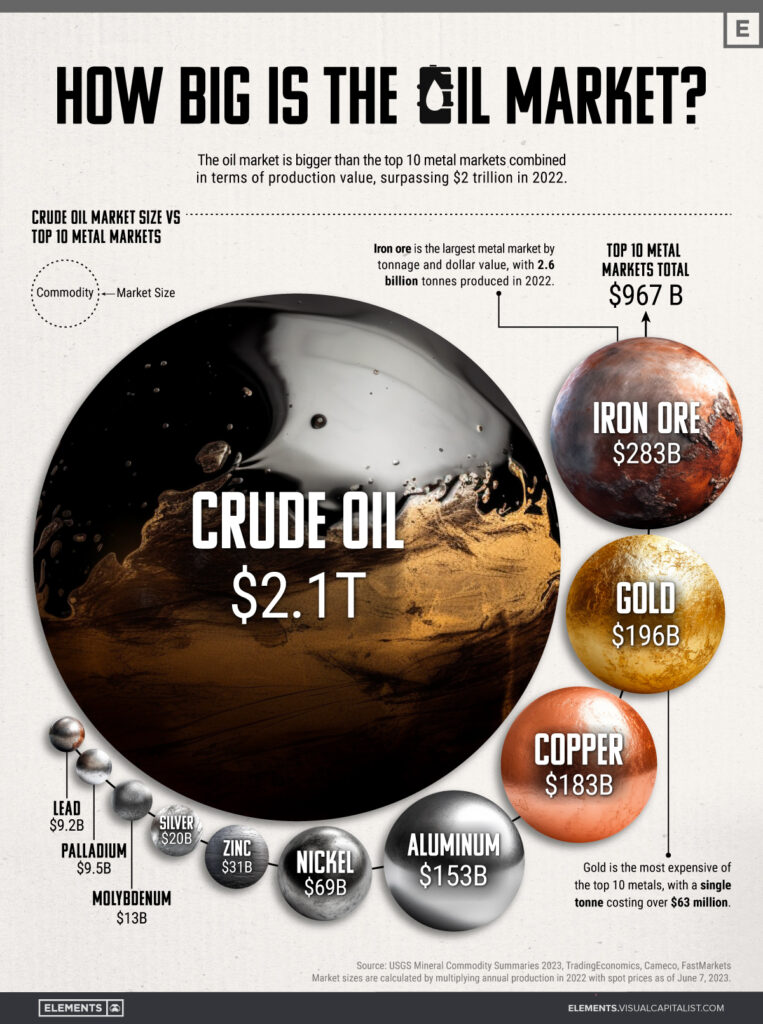
Oil Market Size 2022
Source: Visual Capitalist

To put this into perspective, consider the collective market size of the top 10 metal markets, which stands at $967 billion. Remarkably, this is less than half the size of the oil market. Furthermore, even if we were to aggregate all the remaining smaller markets in the raw metal industry, they would still fall significantly short of matching the magnitude of the oil market. 

These statistics vividly underscore the extensive magnitude of global oil consumption each year, demonstrating its pervasive presence in our daily lives. 

For those not intimately acquainted with the complexities of commodities trading or the foreign exchange (Forex) market, understanding the magnitude of the oil market can seem like a daunting task. However, we’re here to break it down for you and provide insights into how this mammoth market affects Forex trading, making it more accessible for the everyday trader. 

The Role of Oil in the World Economy 

Oil is more than just the fuel that powers our vehicles; it’s an essential component of the world economy. The intricacies of the oil market are crucial to comprehend as they impact various aspects of our lives, from transportation costs to the price of goods and services. 

Energy Source: Powering Modern Life 

Oil, often referred to as “black gold,” is the lifeblood of modern civilisation. It is a fundamental and indispensable energy source that powers transportation, industries, and households globally. 

In the realm of transportation, oil fuels cars, trucks, ships, airplanes, and trains, enabling the movement of people and goods with unparalleled efficiency. Moreover, oil-based products like gasoline and diesel are critical for the functioning of agricultural machinery, enabling the production and distribution of food on a large scale. 

Oil Industry
Source: Business Africa Online

In industries, oil is a primary energy source for manufacturing, powering machinery and equipment essential for production. Additionally, households rely on oil for heating, cooking, and electricity generation, making it an essential component of daily life. 

Economic Impact: Ripples Across Economies 

Fluctuations in oil prices have a profound and direct impact on global economies. Oil is a major input in the production of goods and services across various industries. 

When oil prices rise, the cost of production increases for businesses, leading to higher prices for end consumers. This phenomenon, known as cost-push inflation, can have a cascading effect on the broader economy, potentially leading to higher overall inflation rates. 

On the flip side, when oil prices drop, it can stimulate economic growth as businesses experience cost reductions, enabling them to invest in expansion and hire more employees. 

Oil’s economic impact is not limited to just the domestic economy. As a globally traded commodity, changes in oil prices can trigger geopolitical shifts and instability. 

Nations heavily dependent on oil exports may experience significant swings in revenue, affecting their fiscal policies, foreign exchange reserves, and geopolitical influence. In times of extreme oil price volatility, countries may face economic challenges, potentially leading to regional or even global economic downturns. 

Connection to Forex: Oil Price and Currency Values 

Oil prices and Forex markets share a symbiotic relationship. Major currencies are often tied to the economic health of oil-producing nations. When oil prices rise, the economies of oil-producing countries experience increased revenue, resulting in a stronger demand for their currencies. Conversely, a decrease in oil prices can have the opposite effect, weakening the currencies of oil-exporting nations. 

Forex traders closely monitor changes in oil prices as they provide valuable insights into potential shifts in currency values. The value of currencies such as the Canadian Dollar (CAD), Russian Ruble (RUB), and Norwegian Krone (NOK) is heavily influenced by oil prices due to the significant role oil exports play in their respective economies. 

Understanding this dynamic relationship between oil prices and Forex markets is essential for traders seeking to make informed decisions and effectively manage their Forex portfolios. It’s a reminder of how interconnected the global economy truly is, where a shift in one market can resonate across various financial domains. 

Key Players Shaping the Oil Market Landscape 

In 2022, the price of oil surged, crossing the $100 per barrel mark, the highest in eight years. This was triggered by the instability caused by the Russian invasion of Ukraine, sending shockwaves through the energy markets. Oil companies reaped the benefits, doubling their profits and providing a substantial boost to major oil-producing nations. 
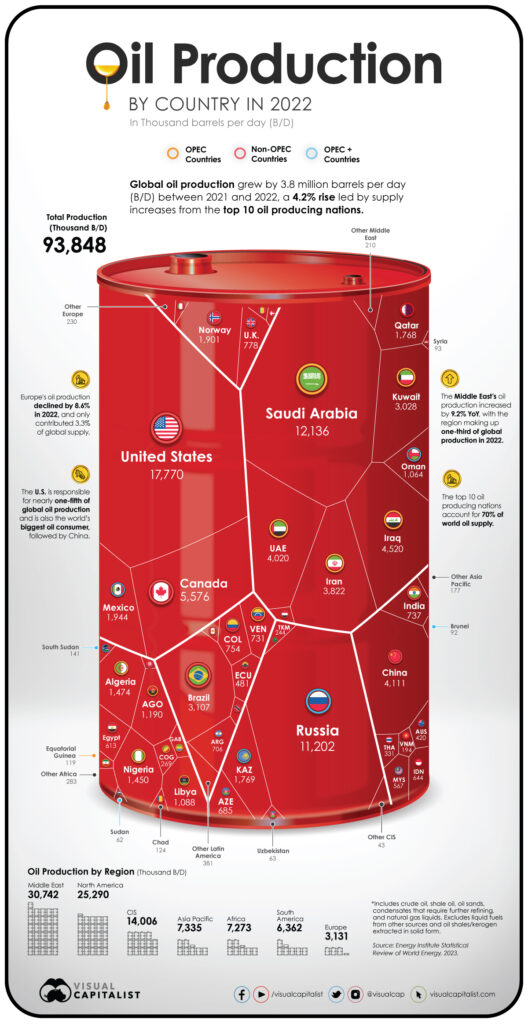
Oil Production by Country in 2022
Source: Visual Capitalist

The United States, maintaining its position as the largest global oil producer since 2018, continued its streak in 2022 by producing nearly 18 million barrels per day. This accounted for almost a fifth of the world’s total oil supply. The majority of this production, approximately three-fourths, was concentrated in five key states: Texas, New Mexico, North Dakota, Alaska, and Colorado. 

Saudi Arabia secured the second position by contributing 12 million barrels of oil per day in 2022, constituting about 13% of the worldwide oil supply. Following closely, Russia claimed the third spot with significant production of 11 million barrels per day during the same year. 

When combined with Canada (fourth position) and Iraq (fifth position), these top five oil-producing nations supplied over half of the world’s entire oil production. 

Simultaneously, the top 10 oil producers, encompassing rankings from 6th to 10th, including China, UAE, Iran, Brazil, and Kuwait, bore the responsibility for a significant 70% of the world’s oil production. 

Notably, all top 10 oil giants increased their production levels between 2021 and 2022, resulting in a notable 4.2% year-on-year surge in global oil output. This growth highlights the substantial role these nations play in the global oil landscape. 

Major Oil Producing Regions 

The Middle East contributes to one-third of the world’s oil production, and North America accounts for another one-third of this production. Additionally, the Commonwealth of Independent States, a consortium of post-Soviet Union nations, stands as a significant regional oil producer, representing 15% of global oil production. 

However, the data clearly reveals a declining share of oil production in Europe, presently constituting only 3% of the world’s oil supply. Over the past two decades, the European Union (EU) has witnessed a reduction of over 50% in its oil output due to various factors, including stricter adherence to environmental regulations and a shift towards natural gas. 
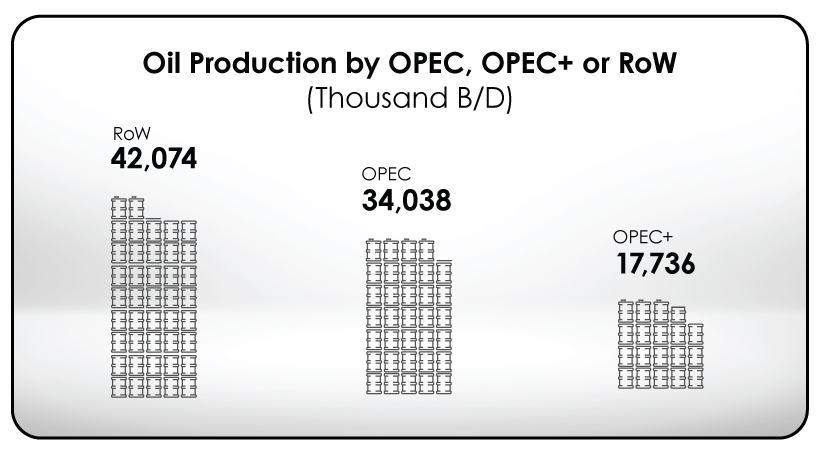
Oil Production by OPEC, OPEC+, Rest of the World
Source: Visual Capitalist

Shifting focus to OPEC members provides another perspective on regional oil production. OPEC nations collectively control approximately 35% of the global oil output and possess nearly 70% of the world’s oil reserves. 

OPEC plays a pivotal role in influencing the global oil market. Consisting of major oil-producing nations such as Saudi Arabia, Iraq, Iran, and Venezuela, OPEC actively coordinates oil production levels to stabilise prices and ensure a consistent supply to the international market. 

Moreover, considering the group of 10 oil-exporting countries with ties to OPEC, known as OPEC+, the proportion of oil production further increases, surpassing half of the world’s oil supply. 

Global Oil Trading Hubs 

In the intricate web of the global oil trade, certain key locations serve as the beating heart, where the pulse of this vital commodity is felt most intensely. These hubs are epicentres of oil trading, shaping market dynamics and influencing prices on a grand scale. 

New York (NYMEX) 

New York, specifically the New York Mercantile Exchange (NYMEX), stands as one of the most significant oil trading hubs globally. The NYMEX’s West Texas Intermediate (WTI) crude oil futures contract is a prominent benchmark for oil prices in the United States. 

London (ICE) 

The Intercontinental Exchange (ICE) in London is another major hub for oil trading. The Brent crude oil futures contract, a widely recognised global benchmark, is traded here, influencing prices on a broader scale. 

Singapore (SGX) 

Singapore has emerged as a major hub for oil trading in Asia. The Singapore Exchange (SGX) facilitates trading of multiple oil products, reflecting and impacting regional market trends. 

Oil Transportation
Source SOMO

Driving Oil Prices: Key Influencing Factors 

The world of oil is not just driven by supply and demand. There are pivotal factors, often beyond everyday headlines, that sway the prices we pay at the pump and impact the broader global economy. Understanding these driving forces is pivotal in comprehending how the oil market functions and how it influences the world economy. 

  • Geopolitical Events: Geopolitical tensions and conflicts in oil-producing regions can disrupt supply chains and production capacities, directly impacting oil prices. Events like political instability, wars, or sanctions can send shockwaves through the oil market, causing price volatility. 
  • Environmental Regulations: Environmental policies and regulations have a substantial influence on the oil market. Government initiatives promoting cleaner energy sources and stricter environmental standards can affect the demand for oil and related products, consequently influencing prices. 
  • Economic Indicators: Economic factors like GDP growth, inflation rates, and employment levels have a direct impact on oil demand. Growing economies often lead to increased energy needs, driving up oil consumption and prices. Conversely, economic downturns can lead to reduced demand and subsequently lower prices. 

Investing in Oil 

The world of oil presents intriguing prospects for investors, with various opportunities to capitalise on its dynamic market. However, alongside these prospects lie inherent risks that necessitate careful consideration and strategic risk management. 

ETFs (Exchange-Traded Funds) 

Exchange-Traded Funds are an accessible investment option for those seeking exposure to the oil market without directly trading commodities. ETFs often track oil prices and oil company stocks, providing a diversified investment approach. 

Futures

Futures contracts allow investors to buy or sell oil at a predetermined price at a specified future date. It’s a direct way to engage with the oil market, but it requires a good understanding of market trends and fluctuations. 

Stocks

Investing in oil company stocks provides ownership in a specific company involved in oil production, exploration, refining, or distribution. Stock values are influenced by company performance and broader market dynamics. 

Options

Options give investors the right (but not the obligation) to buy or sell oil at a specified price within a set time. It offers flexibility and can be a part of a diversified investment portfolio. 

An oil trader with VT Markets

How to Trade Oil with VT Markets? 

When it comes to investing into the oil market, having a reliable and regulated broker is paramount. VT Markets offers oil trading with tight spreads, low commissions, and leverage of up to 500:1. 

Start trading with VT Markets today by following these three simple steps: 

1. Register: Select your preferred account type and submit your application.

2. Fund: Choose from a variety of methods to fund your account. 

3. Trade: Select oil in the Energy section or explore more than 1000 instruments across all asset classes. 

Additionally, you can test your oil trading strategies with our risk-free demo account. Wishing you the best of luck! 

In conclusion, the global oil market is undeniably colossal, exerting immense influence over the world economy and financial markets, notably the Forex market. For non-professional traders, a solid grasp of the oil market fundamentals and its relationship with Forex trading is essential. Stay informed, manage risks prudently, and leverage this knowledge to navigate the dynamic world of Forex trading within the vast sphere of the oil market. 

Stock Markets Plunge as Treasury Yields Soar, Raising Recession Concerns

On Tuesday, stock markets faced a significant downturn due to surging Treasury yields, reaching levels not seen since 2007. This spike in yields raised worries about potential recession and housing market impacts, leading the Dow Jones Industrial Average to experience a 1.29% decline, the S&P 500 to slide by 1.37%, and the Nasdaq Composite to drop by 1.87%. Rising interest rates were driven by the Federal Reserve’s commitment to maintaining them. The surge in rates created uncertainty and potential downside for stocks, with various companies and tech giants experiencing significant losses. The US dollar strengthened against major currencies, but the situation remains uncertain, hinging on data and yield spreads. Upcoming economic indicators will set the tone for October, as the impact of these changes is felt across asset classes.

Stock Market Updates

Stock markets experienced a significant downturn on Tuesday, primarily driven by surging Treasury yields, which reached their highest levels since 2007. This surge in yields raised concerns that higher interest rates could negatively impact the housing market and potentially push the economy into a recession. The Dow Jones Industrial Average suffered a loss of 430.97 points, representing a 1.29% decline and its worst performance since March. The index closed at 33,002.38. The S&P 500 also took a hit, sliding by 1.37% and reaching its lowest level since June before closing at 4,229.45. The Nasdaq Composite, known for its tech-heavy components, dropped 1.87% to finish at 13,059.47, with growth stocks particularly affected by the rise in interest rates.

This market turbulence led the Dow into negative territory for the year, down by 0.4%, while the broader S&P 500 remained up by 10% for the year 2023. The surge in Treasury yields, with the 10-year yield reaching 4.8% and the 30-year yield hitting 4.925%, is a significant concern. The rise in rates is attributed to the Federal Reserve’s commitment to maintaining higher interest rates for an extended period. Investors and experts expressed concerns about the impact of these rising rates on equities, with some suggesting that the stock market will need to find a balance in the bond market before it can stabilize. Seasonal market weakness in September and October is considered normal, but ongoing worries about higher interest rates add to the uncertainty and potential downside for stocks.

The stock market’s performance on this day closely followed movements in bond yields, with stocks dropping each time yields spiked. The release of the August job openings survey, indicating a tight labor market with 9.6 million open positions (surpassing the expected 8.8 million), was a recent catalyst for the surge in rates. Fear rippled through the market as the Cboe Volatility Index reached its highest level since May, reflecting growing concerns among investors about future market volatility. Companies that stand to lose the most from rising rates and a potential recession faced the largest losses, including Home Depot, Lowe’s, Goldman Sachs, and American Express. Big Tech giants like Nvidia and Microsoft also saw their stocks decline as higher interest rates diminished enthusiasm for growth stocks that rely on the promise of higher future earnings.

Data by Bloomberg

On Tuesday, various sectors experienced changes in their performance. Utilities saw a gain of 1.17%, while Consumer Discretionary had the most significant decline at -2.59%. The overall market, represented by “All Sectors,” was down by -1.37%, with Information Technology, Financials, and Real Estate showing substantial losses as well.

Currency Market Updates

The US dollar experienced a surge in value against major currencies, reaching new trend highs due to an impressive August JOLTS report that exceeded expectations by 810k, coupled with a rise in Treasury yields to their highest level in 16 years. However, the dollar’s bullish momentum faced an unexpected setback as USD/JPY witnessed a sharp drop from just above 150 to 147.30, raising suspicions of potential intervention by the Japanese government. While a senior Japanese Ministry of finance official declined to comment on this intervention, the New York Federal Reserve remained silent on the matter. This sudden drop left traders uneasy, resulting in a 0.6% loss for USD/JPY, while EUR/USD remained relatively steady despite hitting a new trend low. Concerns that the dollar index may lose its winning streak if USD/JPY remains below 150, the situation hinges on the divergence between US and eurozone data and Treasury-bund yield spreads.

Amid these developments, it is essential to keep an eye on upcoming US economic indicators, such as the ISM non-manufacturing report, ADP releases, jobless claims, and the employment report, as they will set the tone for the month of October. While the Federal Reserve reiterated the need for elevated rates to combat inflation, there is also an acknowledgment that surging Treasury yields represent a form of monetary tightening. The impact of these changes is felt across various asset classes, with equities, riskier assets, and high-beta currencies experiencing significant declines. In addition, concerns have emerged regarding the US banking sector as the KBE index approaches its lows during this year’s banking crisis. Meanwhile, the British pound remained relatively flat, but fresh signs of inflation receding could reduce the necessity for further rate hikes by the Bank of England. The Australian dollar depreciated by 1% amidst global risk aversion and the Reserve Bank of Australia’s decision to hold rates steady, driven in part by rising Treasury yields, which are fostering risk-averse sentiment on a global scale.

Picks of the Day Analysis
EUR/USD (4 Hours)

EUR/USD Hits Multi-Month Lows Amid Strong US Dollar and Robust Labor Market Data

The EUR/USD pair reached new multi-month lows, primarily driven by the strength of the US Dollar, supported by positive labor market data. The week ahead features critical economic reports, including ADP employment data and the JOLTS Job Opening report, which has already pushed the 10-year Treasury bond yield to cycle highs. These indicators reflect a robust US economy, and further job data releases, along with expectations of prolonged higher interest rates from the Federal Reserve, are likely to boost the Dollar’s momentum. Meanwhile, in the Eurozone, upcoming reports include Wholesale Inflation, Retail Sales, and HICP PMIs, with market participants closely watching for signs from the European Central Bank.

Chart EURUSD by TradingView

According to technical analysis, EUR/USD moved in consolidation on Tuesday, currently trading above the lower band, suggesting the potential for a slightly higher movement to the middle band of the Bollinger Bands. The Relative Strength Index (RSI) is at 33, indicating that EUR/USD is still in a bearish bias.

Resistance: 1.0538, 1.0605

Support: 1.0406, 1.0326

XAU/USD (4 Hours)

XAU/USD Tumbles to 6-Month Low Amid US Rate Hike Fears

On Tuesday, XAU/USD, the gold-to-US Dollar currency pair, plunged to $1,815.19, marking its lowest level since early March, as investors grew increasingly concerned about potential rate hikes in the US. This decline in the pair was triggered by Federal Reserve officials’ comments emphasizing the need for further rate increases to combat persistently high inflation. As investors closely monitored these remarks, XAU/USD experienced a notable sell-off, reflecting growing apprehension about the impact of tighter monetary policy on the precious metal’s value.

Chart XAUUSD by TradingView

According to technical analysis, XAU/USD moved in consolidation on Tuesday, currently the price continues consolidating above the lower band, suggesting potential higher movement for today to reach the middle band of the Bollinger Bands. The Relative Strength Index (RSI) is currently at 23, signifying a bearish bias for the XAU/USD pair.

Resistance: $1,834, $1,858

Support: $1,809, $1,777

Economic Data
CurrencyDataTime (GMT + 8)Forecast
NZDOfficial Cash Rate09:005.50% (Actual)
NZDRBNZ Rate Statement09:00 
USDADP Non-Farm Employment Change20:15154K
USDISM Services PMI22:0053.5

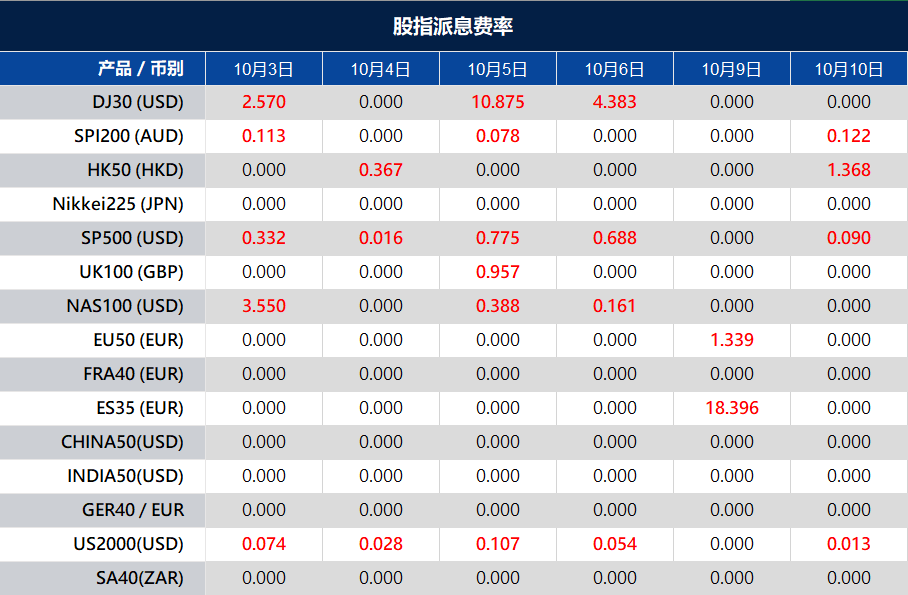
Dividend Adjustment Notice – October 3, 2023

Dear Client,

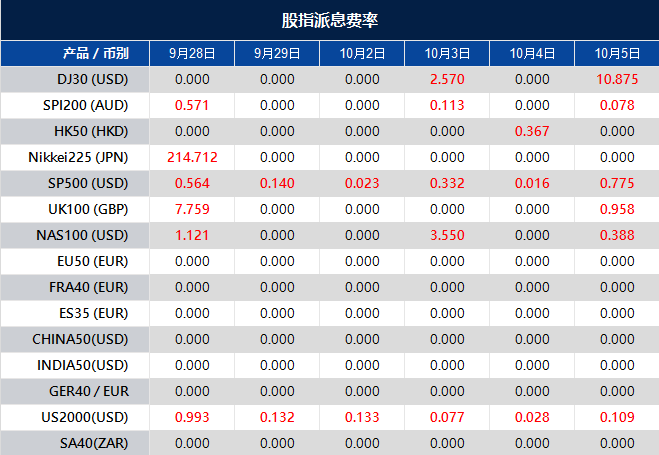
Please note that the dividends of the following products will be adjusted accordingly. Index dividends will be executed separately through a balance statement directly to your trading account, and the comment will be in the following format “Div & Product Name & Net Volume ”.

Please refer to the table below for more details:

The above data is for reference only, please refer to the MT4/MT5 software for specific data.

If you’d like more information, please don’t hesitate to contact [email protected].

US Stock Market Sees Mixed Performance Amidst Government Shutdown Concerns and Rising Bond Yields

In Monday’s stock market update, the Dow Jones Industrial Average dipped by 0.22%, while the S&P 500 made marginal gains and the Nasdaq Composite continued its winning streak. Notably, the small-cap Russell 2000 turned negative for the first time in 2023, reflecting challenges among smaller businesses. Rising bond yields, with the 10-year Treasury yield reaching its highest level since October 2007, influenced the market’s performance. The US dollar also gained strength, driven by higher interest rate commitments and divergence in Purchasing Managers’ Index (PMI) data between the US and Europe. Risk aversion and declining oil and copper prices further supported the dollar’s rise, impacting currency markets. Looking ahead, key data releases will continue to influence market dynamics.

Stock Market Updates

In the stock market update, on Monday, the Dow Jones Industrial Average experienced a 0.22% decline, closing at 33,433.35 points. This dip occurred despite a short-term agreement reached by U.S. legislators to prevent a government shutdown. The S&P 500, on the other hand, saw marginal gains of 0.01%, finishing at 4,288.39 points, while the Nasdaq Composite had a more positive day, adding 0.67% to reach a closing value of 13,307.77 points. Notably, this marked the fourth consecutive day of gains for the Nasdaq. However, the Russell 2000, a small-cap index, suffered a 1.6% decline on Monday, resulting in a year-to-date decrease of 0.3%. This marked the first time in 2023 that the Russell 2000 turned negative, reflecting challenges among smaller businesses. The Russell 2000 is often regarded as a valuable indicator of the overall economy’s health due to its focus on small enterprises.

The market’s performance occurred against the backdrop of rising bond yields, with the 10-year Treasury yield reaching a high of 4.7%, its highest level since October 2007. In terms of individual stock movements, Discover emerged as the top gainer in the S&P 500, with its shares rising by nearly 5%. Medical device manufacturer Insulet saw a 3.5% increase in its stock value, while chipmaker Nvidia rose by almost 3%. Among the various sectors, technology, communications services, and consumer discretionary were the only ones that recorded positive gains. Communication services added 1.5%, the tech sector traded 1.3% higher, and consumer discretionary gained 0.3%. The Senate’s recent passage of a continuing resolution, signed into law by President Joe Biden, ensured that the government would remain open until mid-November. Historically, stock markets have shown little concern for government shutdowns, with the S&P 500’s performance during such periods remaining relatively flat. Analysts emphasized that other economic conditions, such as housing, manufacturing, and labor, are more critical factors to watch as the year progresses.

Data by Bloomberg

On Monday, the performance of various sectors in the market showed mixed results. The overall market, represented by “All Sectors,” had a minimal increase of 0.01%. Notable gainers included Communication Services (+1.47%) and Information Technology (+1.33%), which experienced significant positive growth. On the other hand, some sectors faced losses, with Utilities being the most affected, plummeting by -4.72%. Real Estate (-1.75%), Energy (-1.91%), and Materials (-1.31%) also saw substantial declines. Additionally, Health Care (-0.11%), Consumer Staples (-0.64%), Financials (-0.84%), Industrials (-0.91%), and Consumer Discretionary (+0.28%) experienced relatively smaller fluctuations in their values.

Currency Market Updates

In the opening of the fourth quarter, the US dollar demonstrated resilience and strength, marking a 0.6% rise in the dollar index. This surge was primarily driven by an uptick in Treasury yields following the temporary resolution of a suspected US government shutdown. Additionally, the divergence in Purchasing Managers’ Index (PMI) data between the US and Europe favored the US dollar. The robust performance of the US currency was further supported by a commitment from Federal Reserve speakers to maintain higher interest rates for an extended period. This, in turn, triggered risk aversion, causing high-beta currencies like the Australian dollar and South African Rand to weaken. The dollar’s upward momentum was also aided by declines in oil and copper prices, which prompted derisking flows, alongside rising yields across Europe. As a result, the EUR/USD pair experienced a 0.76% decline, though it managed to hold above key support levels, raising questions about the sustainability of a recent rebound.

Looking ahead, the US dollar’s performance is expected to hinge on several key data releases, including the US JOLTS report, the ISM non-manufacturing data, and the employment report scheduled for Friday. Notably, the ISM manufacturing data exceeded expectations, while prices paid decreased, which might influence the dollar’s direction. In the currency market, USD/JPY saw a 0.27% increase, approaching the psychologically significant 150 level. Market participants are closely monitoring this level, as it is seen as a potential trigger point for intervention by the Japanese Ministry of Finance (MoF). The BoJ’s discussions on policy normalization are anticipated to be more active in Q1 2024, coinciding with wage negotiations, while the bank recently announced additional Japanese Government Bond (JGB) purchases in response to rising yields, which are nearing the bank’s 1% hard cap. Meanwhile, the British pound experienced a 0.79% decline, reaching its lowest point since March, due to a combination of risk-off sentiment and disappointing UK PMI data.

Picks of the Day Analysis
EUR/USD (4 Hours)

EUR/USD Drops Below 1.0500 Amid Strong US Dollar and Resilient Economic Data

The EUR/USD pair experienced a substantial decline, falling below 1.0500 as the US Dollar maintained its strength due to global risk-off sentiment and rising yields. The US Dollar Index (DXY) edged closer to 107.00, supported by positive economic data and Federal Reserve officials’ comments on the economy’s resilience. Meanwhile, the Eurozone reported a drop in unemployment and a confirmed Manufacturing PMI reading. The coming week’s key events, including the JOLTS and ADP reports, along with the Nonfarm Payrolls data, will likely influence the future direction of the EUR/USD pair, with the US Dollar’s strength hanging in the balance.

Chart EURUSD by TradingView

According to technical analysis, EUR/USD moved lower on Monday, reaching the lower band of the Bollinger Bands. It is currently trading above the lower band, suggesting the potential for further losses. The Relative Strength Index (RSI) is at 29, indicating that EUR/USD is now in bearish bias.

Resistance: 1.0538, 1.0605

Support: 1.0406, 1.0326

XAU/USD (4 Hours)

XAU/USD Hit Multi-Month Low Amid Shifting Economic Tides and Strong US Dollar Demand

Spot Gold recently plunged to a multi-month low of $1,827.11 per troy ounce, primarily driven by resurging US Dollar demand. Encouraging economic data from China and the United States initially boosted sentiment, with China’s Producer Manager Indexes indicating economic resilience and the US Congress extending the debt ceiling to avoid a government shutdown. However, as the day progressed, market sentiment turned sour due to global economic struggles, despite some positive signs such as an improvement in the US ISM Manufacturing PMI. Rising government bond yields, with the 10-year Treasury note hitting its highest since 2007, fueled demand for the US Dollar.

Chart XAUUSD by TradingView

According to technical analysis, XAU/USD moved lower on Monday, creating downward pressure on the lower band of the Bollinger Bands. Currently, the price is consolidating above the lower band, suggesting potential consolidation for today. The Relative Strength Index (RSI) is currently at 13, signifying a bearish bias for the XAU/USD pair.

Resistance: $1,834, $1,858

Support: $1,809, $1,777

Economic Data
CurrencyDataTime (GMT + 8)Forecast
AUDCash Rate11:304.10%
AUDRBA Rate Statement11:30 
CHFCPI m/m14:300.0%
USDJOLTS Job Openings22:008.81M

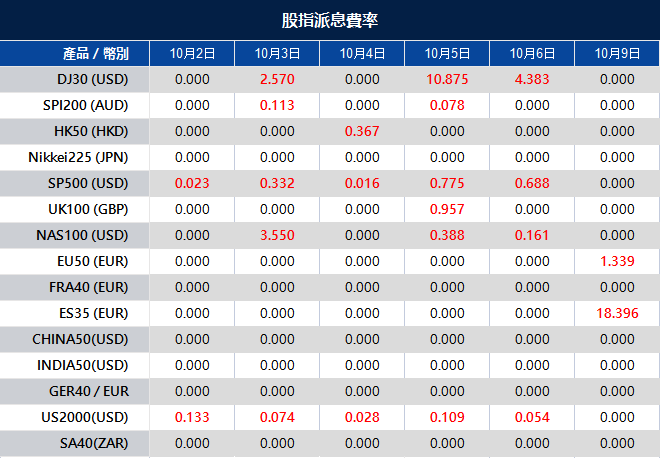
Dividend Adjustment Notice – October 2, 2023

Dear Client,

Please note that the dividends of the following products will be adjusted accordingly. Index dividends will be executed separately through a balance statement directly to your trading account, and the comment will be in the following format “Div & Product Name & Net Volume ”.

Please refer to the table below for more details:

The above data is for reference only, please refer to the MT4/MT5 software for specific data.

If you’d like more information, please don’t hesitate to contact [email protected].

Week Ahead: Markets to Focus on US Jobs Report, RBA Rate Statement, and RBNZ Rate Statement

Several key economic releases are expected to impact the financial markets this week. Notably, attention will be on the US Jobs Report, the rate statement from the Reserve Bank of Australia (RBA), and the rate statement from the Reserve Bank of New Zealand (RBNZ). Given the potential for heightened market volatility, we advise traders to approach their trading activities with caution.

Here are some of the notable market highlights for this week:

Reserve Bank of Australia Rate Statement (3 October 2023) 

The Reserve Bank of Australia (RBA) maintained its cash rate at 4.1% during its final meeting under Governor Philip Lowe in September 2023, extending the rate pause for the third successive month. 

Under the new Governor Michele Bullock, analysts predict that the RBA will keep its cash rate at 4.1% following its next meeting on 3 October.

Reserve Bank of New Zealand Rate Statement (4 October 2023) 

The Reserve Bank of New Zealand (RBNZ) maintained its official cash rate (OCR) at 5.5% during its August 2023 meeting, extending its rate pause for the second consecutive month.

Analysts expect the OCR to remain at 5.5% following the central bank’s upcoming meeting on 4 October.

US ISM Services PMI (4 October 2023)

The US Institute of Supply Management (ISM) Services PMI jumped from 52.7 in July 2023 to 54.5 in August 2023, the largest growth in the services sector in six months.

Updated data will be released on 4 October, with analysts expecting the index to be lowered to 53.6.

Canada Employment Change (6 October 2023) 

39,900 jobs were added to the Canadian economy in August 2023. Meanwhile, the unemployment rate held steady at 5.5%, maintaining its level from the previous month.

The figures for September are scheduled for release on 6 October, with analysts anticipating the addition of 17,000 new jobs. However, the unemployment rate is expected to rise slightly to 5.6%.

US Jobs Report (6 October 2023) 

187,000 jobs were added to the US economy in August 2023. However, the unemployment rate rose to 3.8%, the highest level since February 2022.

The figures for September 2023 are set to be released on 6 October. Analysts anticipate the addition of 163,000 jobs. Additionally, the unemployment rate is expected to decrease slightly to 3.7%.

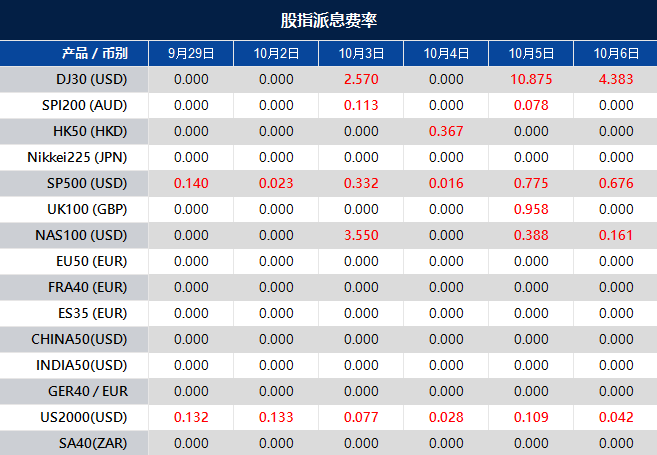
Dividend Adjustment Notice – September 29, 2023

Dear Client,

Please note that the dividends of the following products will be adjusted accordingly. Index dividends will be executed separately through a balance statement directly to your trading account, and the comment will be in the following format “Div & Product Name & Net Volume ”.

Please refer to the table below for more details:

The above data is for reference only, please refer to the MT4/MT5 software for specific data.

If you’d like more information, please don’t hesitate to contact [email protected].

Stocks Show Signs of Recovery Amidst Challenging Month as Treasury Yields Ease

On Thursday, the stock market witnessed a rebound as Wall Street aimed to recover from recent losses. The Dow Jones Industrial Average and Nasdaq Composite posted gains of 0.35% and 0.83%, respectively, while the S&P 500 came close to reaching the 4,300 marks with a 0.59% increase. Despite the challenging month and quarter, optimism returned due to a decrease in Treasury yields from multiyear highs and positive economic data showing a resilient labor market. The US dollar also faced a decline, largely influenced by a rebound in the EUR/USD currency pair and evolving monetary policies from the European Central Bank and the US Federal Reserve. Amid these factors, concerns over fiscal difficulties and potential government shutdowns persist.

Stock Market Updates

In the stock market update, on Thursday, stocks showed signs of recovery as Wall Street attempted to bounce back from the steep losses experienced earlier in the month. The Dow Jones Industrial Average rose by 116.07 points, or 0.35%, reaching 33,666.34, while the S&P 500 added 0.59%, just falling short of the key 4,300 level, closing at 4,299.70. The Nasdaq Composite saw a significant gain of about 0.83%, closing at 13,201.28. However, it’s worth noting that stocks have faced a challenging month and quarter, with the Dow expected to end September down 3% and the quarter down more than 2%. The S&P 500 is slated to finish the month with a 4.6% decline and the quarter with a 3.4% decrease, while the Nasdaq is on track to end both the month and quarter lower by 5.9% and 4.3%, respectively.

One key factor influencing market sentiment is the movement in Treasury yields, which have been rising. Investors have been concerned about the potential for higher interest rates and the impact on equities. However, on the positive side, Treasury yields eased from multiyear highs, providing some relief to the stock market. Additionally, positive economic data showing a resilient labor market with lower-than-expected jobless claims helped bolster market confidence. Investors are also keeping an eye on inflation metrics, particularly the personal consumption expenditures price index, which is the Federal Reserve’s preferred gauge of inflation. Moreover, political developments in Washington, specifically negotiations on a U.S. spending bill, are being closely monitored, as they could impact market dynamics in the near term.

Data by Bloomberg

On Thursday, across all sectors, there was a modest increase in the market, with a gain of 0.59%. Notably, Communication Services, Materials, and Consumer Discretionary sectors saw even stronger performance, with gains of 1.16%, 1.05%, and 0.97% respectively. The Real Estate, Financials, and Information Technology sectors also experienced positive growth, with gains of 0.85%, 0.69%, and 0.69%. Health Care and Industrials sectors had more moderate increases, with gains of 0.48% and 0.43%. However, Consumer Staples saw a smaller gain of 0.25%. The Energy sector only saw a minimal increase of 0.01%. In contrast, the Utilities sector faced a significant decline, with a loss of -2.19% on Thursday.

Currency Market Updates

In the latest currency market updates, the US dollar faced a notable decline, with the dollar index slipping by 0.37%. A significant contributor to this fall was the impressive 0.5% rebound in the EUR/USD currency pair, which had been deeply oversold. The pair found crucial support at the 1.0482 low from January 6, 2023, particularly toward the end of the month. This recovery was bolstered by a substantial rise in bund-Treasury yield spreads. Interestingly, the European Central Bank (ECB), despite German CPI figures coming in slightly below forecasts and reaching their lowest levels since the Russian invasion of Ukraine, indicated that it might not raise interest rates further. Instead, the ECB is in the process of unwinding its previous quantitative easing and bank-supportive policies, while fiscal policymakers in the region are grappling with rising costs. On the US front, concerns loom over potential fiscal difficulties, including the possibility of a government shutdown. The Federal Reserve’s commitment to maintaining higher interest rates for an extended period was also questioned by some, including Fed’s Austan Goolsbee. Though US jobless claims remained slightly below forecast, the pending home sales plummeted by 7.1% from July to August, hinting at a potential drop in September’s existing home sales, which could reach their lowest point in over a decade.

Moreover, in the context of the currency market, USD/JPY experienced a 0.2% decline due to a minor drop in Treasury-JGB yield spreads. Nevertheless, despite the promising yield spreads, the primary factor holding back USD/JPY’s advance is the fear of Japanese foreign exchange intervention. While most of the market’s attention is on the 150 level as a potential intervention trigger point, it could potentially break out above 2023’s channel top towards 2022’s 32-year high at 151.94, mirroring the scenario that triggered interventions in October 2022. Japanese officials have stated that they do not defend specific currency levels but rather respond to excessive volatility. However, recent price action has not been notably volatile. Additionally, the British pound rose by 0.46% following a recent low, which marked an 8% slide since its highs in July. This rebound was supported by the recovery of two-year gilts-Treasury yield spreads. Furthermore, the slight drop in Treasury yields, combined with a rebound in risk sentiment and pullbacks in both the dollar and oil prices, contributed to a 1.1% rise in AUD/USD and a 0.35% fall in USD/CNY. Upcoming data releases are set to include Tokyo CPI, Japan’s job market indicators, industrial production, and retail sales, as well as eurozone CPI figures, followed by the release of U.S. core PCE data, income and spending metrics, Michigan sentiment numbers, and Chicago PMI data.

Picks of the Day Analysis
EUR/USD (4 Hours)

EUR/USD Rebounds as US Dollar Correction Pauses Amidst Robust Economic Data

In a notable Thursday surge, the EUR/USD pair made a strong comeback from recent monthly lows, nearing the 1.0600 level, thanks to a brief halt in the US Dollar’s bullish streak driven by positive US economic indicators. While the US economy continued to show signs of strength, including a 2.1% annualized Q2 GDP growth rate and lower-than-expected Initial Jobless Claims, market sentiment weighed on the greenback. The Euro’s performance appeared relatively unaffected by the European Central Bank’s current stance, with market expectations leaning towards no October rate hike. Though comments from ECB members had limited influence, data, such as Germany’s falling annual inflation rate and resilient business and consumer sentiment indicators, helped bolster the Euro’s position, with Friday’s Eurozone inflation figures eagerly awaited.

Chart EURUSD by TradingView

According to technical analysis, EUR/USD moved higher on Thursday, reaching the middle band of the Bollinger Bands. It is currently trading above the middle band, suggesting the potential for further gains to reach the upper band. The Relative Strength Index (RSI) is at 51, indicating that EUR/USD is attempting to return to a neutral stance.

Resistance: 1.0547, 1.0605

Support: 1.0488, 1.0440

XAU/USD (4 Hours)

XAU/USD Hits Six-Month Low as US Dollar Gains Amid Positive Economic Data

On Thursday, the price of gold continued its decline, reaching $1,857.66 per troy ounce, its lowest point since early March. The US Dollar strengthened against gold due to improved market sentiment driven by positive macroeconomic data, including the confirmation of a 2.1% Q2 Gross Domestic Product (GDP) and better-than-expected Initial Jobless Claims. Additionally, government bond yields retreated from recent highs, with the 10-year Treasury note at 4.61% and the 2-year bond at 5.08%, down 12 basis points from recent highs following the Federal Reserve’s monetary policy announcement. Investors now await the latest US inflation data, particularly the August Personal Consumption Expenditures (PCE) Price Index, with the core annual reading expected to be 3.9%, slightly below July’s 4.2%.

Chart XAUUSD by TradingView

According to technical analysis, XAU/USD moved lower on Thursday, creating downward pressure on the lower band of the Bollinger Bands. Currently, the price is consolidating above the lower band, suggesting potential consolidation for today. The Relative Strength Index (RSI) is currently at 20, signifying a bearish bias for the XAU/USD pair.

Resistance: $1,872, $1,885

Support: $1,858, $1,846

Economic Data
CurrencyDataTime (GMT + 8)Forecast
CADGDP m/m20:300.1%
USDCore PCE Price Index m/m20:300.2%
USDRevised UoM Consumer Sentiment22:0067.7

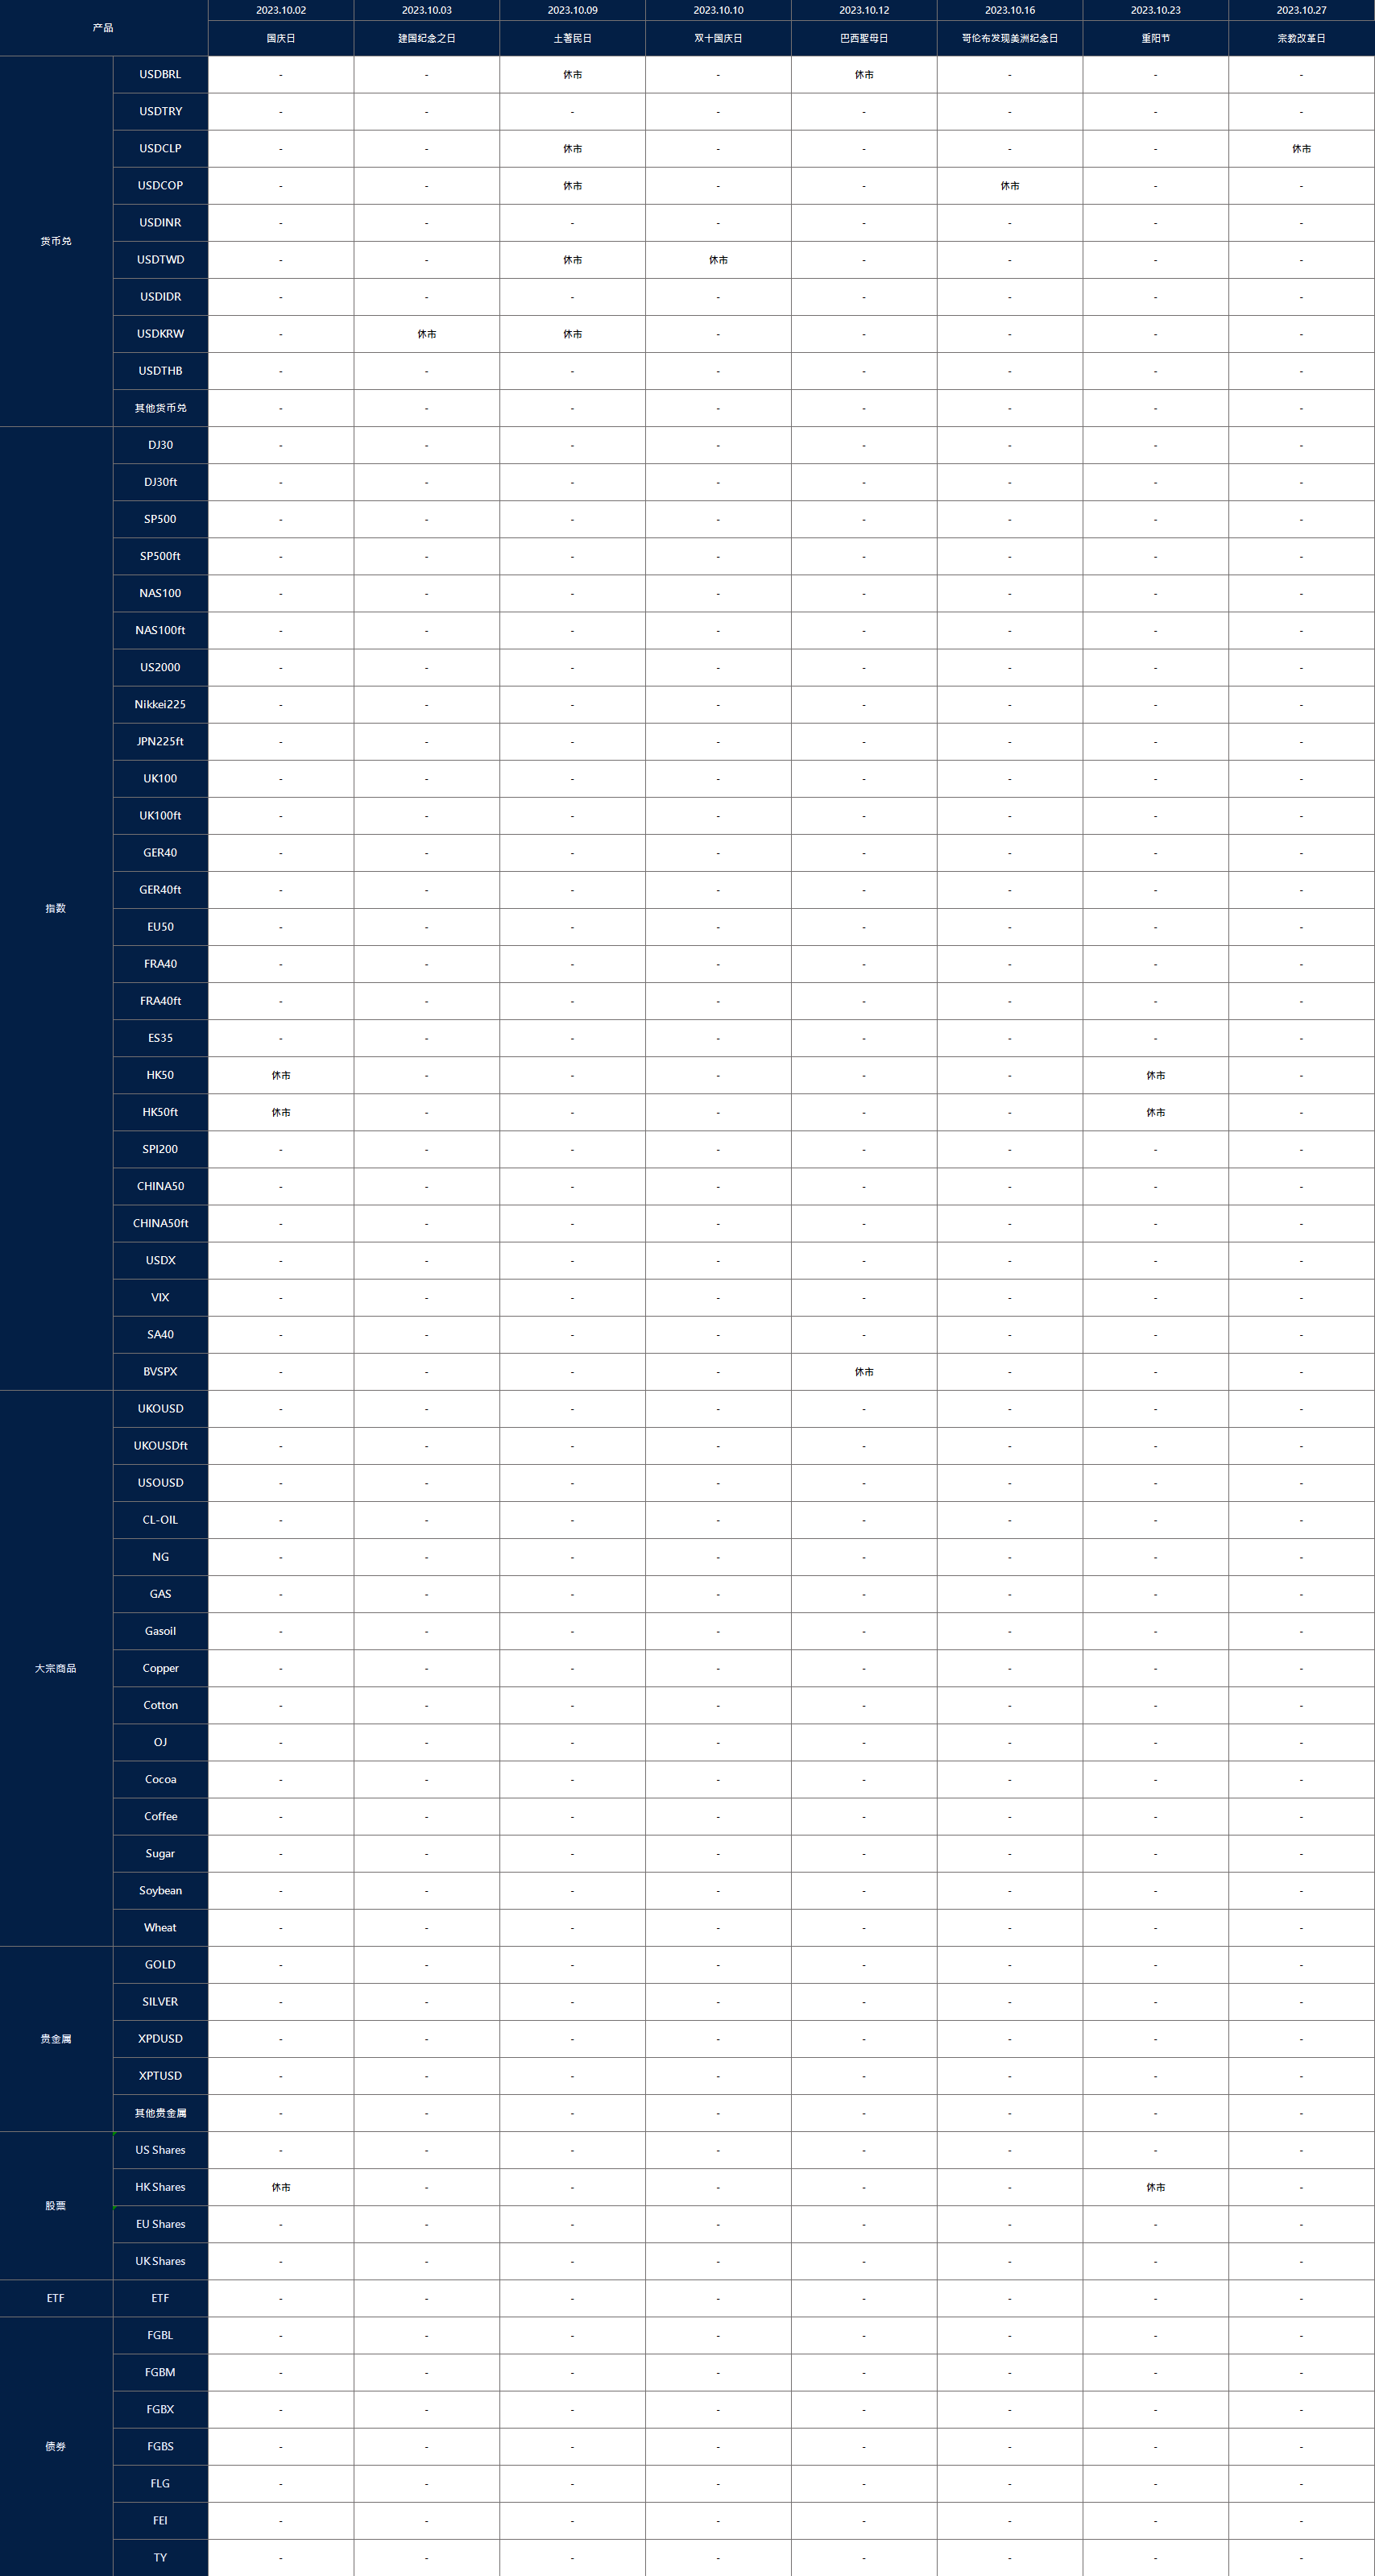
Notification of Trading Adjustment in Holiday – September 28, 2023

Dear Client,

Please note that the following instruments’ trading hours will be affected by the upcoming holidays.

Note: The dash sign (-) indicates normal trading hours.

The above data is for reference only, please refer to the MT4/MT5 software for specific data.

If you’d like more information, please don’t hesitate to contact [email protected].

Dividend Adjustment Notice – September 28, 2023

Dear Client,

Please note that the dividends of the following products will be adjusted accordingly. Index dividends will be executed separately through a balance statement directly to your trading account, and the comment will be in the following format “Div & Product Name & Net Volume ”.

Please refer to the table below for more details:

The above data is for reference only, please refer to the MT4/MT5 software for specific data.

If you’d like more information, please don’t hesitate to contact [email protected].

Back To Top
server

Hello there 👋

How can I help you?

Chat with our team instantly

Live Chat

Start a live conversation through...

  • Telegram
    hold On hold
  • Coming Soon...

Hello there 👋

How can I help you?

telegram

Scan the QR code with your smartphone to start a chat with us, or click here.

Don’t have the Telegram App or Desktop installed? Use Web Telegram instead.

QR code