Gold prices in India fell on Tuesday, based on data compiled by FXStreet. Gold was priced at INR 14,428.73 per gram, down from INR 14,513.10 on Monday.
The price per tola slipped to INR 168,293.80 from INR 169,277.90 a day earlier. Other listed rates were INR 144,287.30 for 10 grams and INR 448,784.40 per troy ounce.
FXStreet converts international gold prices into Indian rupees using USD/INR and local units. The figures are updated daily at the time of publication and are for reference, as local prices may differ slightly.
Gold is often used as a store of value and a medium of exchange, and is also used in jewellery. It is also used as a hedge against inflation and currency depreciation.
Central banks are the largest holders of gold and may buy it to diversify reserves. World Gold Council data says central banks added 1,136 tonnes worth about $70 billion in 2022, the highest annual purchase on record.
Gold often moves inversely to the US Dollar and US Treasuries, and can also move opposite to risk assets. Its price can be affected by geopolitical risks, recession fears, interest rates, and the US Dollar because gold is priced in dollars (XAU/USD).
With inflation proving difficult to tame, gold remains a critical asset for hedging. We saw this throughout 2025, as core inflation remained stubbornly above the 3% level in both the US and Europe. This persistent price pressure continues to support the case for holding gold as a store of value.
Central bank buying provides a strong underlying bid for the market. Looking back, we saw central banks add over 1,000 tonnes to their reserves in both 2022 and 2023, a trend that continued through 2025. This consistent demand from official sources creates a solid floor under the price, limiting downside risk for traders.
The primary focus for the coming weeks will be on future interest rate policy. After holding rates steady for most of 2025, the market is now pricing in potential rate cuts by the US Federal Reserve in the third quarter of this year, 2026. As a non-yielding asset, gold becomes more attractive as interest rates are expected to fall.
This anticipation of lower rates is already putting pressure on the US Dollar. As gold is priced in dollars, a weaker dollar typically pushes the metal’s price higher. This inverse relationship will be a key driver of gold’s performance moving forward.
For derivative traders, this environment suggests preparing for upward volatility. Buying call options could be a prudent strategy to gain exposure to potential price spikes caused by a confirmed shift in central bank policy. This allows for participation in the upside while defining the maximum risk on the trade.
We must also watch for any instability in the broader financial markets. A significant sell-off in equities, driven by recession fears or geopolitical events, would likely trigger a flight to safety. Gold’s status as a safe-haven asset means it would benefit directly from such a move.
Written on April 21, 2026 at 7:31 am, by josephine
AUD/USD failed to build on Monday’s rebound from 0.7115, a three-day low, and edged lower in Tuesday’s Asian session. It traded near 0.7165, down 0.15%, and remained close to last Friday’s highest level since June 2022.
Market direction stayed linked to the US-Iran dispute, including tensions around the Strait of Hormuz ahead of a second round of peace talks in Pakistan. This cautious mood supported the US Dollar, while higher crude oil prices added inflation concerns that also backed the Dollar and weighed on AUD/USD.
Further US Dollar gains were limited as markets reduced expectations of a US Federal Reserve rate hike. Pricing pointed to a roughly 45-50% chance of a Fed rate cut by year-end, compared with a more restrictive policy stance from the Reserve Bank of Australia.
RBA Deputy Governor Andrew Hauser said last week the bank remains focused on stopping medium-term inflation expectations from rising. Markets priced a 65% chance of a 25 basis point rise in May and projected a potential peak rate of 4.85% by mid-2026.
We are seeing the AUD/USD hover near its highest point since June 2022, around the 0.7165 level. While there is some selling pressure, any significant drops seem to find support, as they did recently at 0.7115. This suggests an underlying strength in the pair, even with day-to-day hesitation.
The core support for the Aussie dollar comes from the RBA’s firm stance against inflation, which we saw last year in 2025 persistently above their target. With Australia’s latest Q1 CPI data showing inflation at a stubborn 3.6%, the market is now pricing in a 65% chance of a rate hike next month to 4.60%. This contrasts sharply with the US, where Core PCE has cooled to 2.8%, making a Fed rate cut by year-end a real possibility.
However, ongoing tensions in the Strait of Hormuz and their effect on crude oil are keeping a lid on the pair. WTI crude prices are elevated, currently trading around $85 a barrel, reviving inflation fears globally and supporting the safe-haven US dollar. We saw a similar dynamic with energy prices back in 2022, where geopolitical events caused sharp, unpredictable market swings.
Given this tug-of-war, we should consider strategies that benefit from a gradual rise while managing risk from high volatility. A bull call spread could be effective, allowing us to profit from a move higher but with a defined cost and risk profile. This approach helps offset the expensive option premiums caused by the current geopolitical uncertainty.
Written on April 21, 2026 at 7:21 am, by josephine
Gold prices in Malaysia fell on Tuesday, based on FXStreet data. Gold was priced at MYR 609.83 per gram, down from MYR 613.46 on Monday.
Gold also dropped to MYR 7,112.83 per tola from MYR 7,155.31 a day earlier. FXStreet listed MYR 6,098.15 for 10 grams and MYR 18,967.92 per troy ounce.
FXStreet calculates Malaysia’s gold prices by converting international prices using the USD/MYR rate and local units. Prices are updated daily at publication time and are for reference, as local rates may differ slightly.
Gold has been used as a store of value and a medium of exchange, and is widely used in jewellery. It is also used as a safe-haven asset and as a hedge against inflation and currency depreciation.
Central banks hold the most gold and added 1,136 tonnes worth around $70 billion in 2022, according to the World Gold Council. This was the highest annual purchase since records began, with China, India and Turkey increasing reserves.
Gold often moves inversely to the US Dollar, US Treasuries, and some risk assets. Prices can also react to geopolitical events, recession fears, interest rates, and the US Dollar because gold is priced in dollars (XAU/USD).
While we see a minor dip in the gold price today, April 21, 2026, it is essential to consider the larger context. Looking back, we saw gold prices surge to record highs above $2,400 per ounce in 2024, demonstrating remarkable strength even when interest rates were elevated. This resilience suggests a fundamental shift in the market that derivative traders must now navigate.
A primary driver has been the relentless purchasing by central banks, a trend that accelerated through 2024 and 2025. We saw central banks, particularly those in emerging markets, add over 1,000 tonnes to their reserves again in 2024, continuing the record pace from the previous two years. This persistent demand provides a strong floor for prices and signals a long-term strategic move away from traditional reserve assets.
The key variable for the coming weeks will be the outlook on US interest rates and the dollar. After holding rates firm through most of 2025 to fight lingering inflation, recent economic data, such as the Q1 2026 jobs report showing a slight uptick in unemployment to 4.1%, is fueling speculation of a policy shift. Any confirmation of future rate cuts would likely weaken the dollar and serve as a significant catalyst for gold, making call options or long futures positions attractive.
Geopolitical tensions, which we saw simmer throughout 2025 with ongoing conflicts in Eastern Europe and the Middle East, continue to underpin gold’s safe-haven appeal. This creates an environment where implied volatility may rise, presenting opportunities for traders using options. For those anticipating instability, buying straddles or strangles could be a viable strategy to profit from a large price move in either direction, irrespective of the Fed’s immediate actions.
Written on April 21, 2026 at 7:16 am, by josephine
The People’s Bank of China (PBOC) set the USD/CNY central rate for Tuesday at 6.8594. This compared with the previous day’s fix of 6.8648 and a Reuters estimate of 6.8112.
The PBOC’s main monetary policy aims are price stability, including exchange rate stability, and supporting economic growth. It also works on financial reforms, such as opening and developing the financial market.
Governance And Independence
The PBOC is state-owned by the People’s Republic of China and is not an autonomous body. The Chinese Communist Party Committee Secretary, nominated by the Chairman of the State Council, has key influence over the bank’s management and direction, and Pan Gongsheng holds both this role and the governor post.
Policy tools include the seven-day Reverse Repo Rate, the Medium-term Lending Facility, foreign exchange interventions and the Reserve Requirement Ratio. The Loan Prime Rate is China’s benchmark rate and changes can affect loan, mortgage and savings rates, as well as the Renminbi exchange rate.
China has 19 private banks, a small share of the system. The largest include WeBank and MYbank, and private capitalised domestic lenders have been allowed since 2014.
Given today’s stronger-than-expected fixing by the People’s Bank of China, we see a clear signal of their discomfort with recent yuan weakness. The central bank is actively pushing back against market estimates, suggesting an intent to enforce currency stability in the short term. This action follows a period where the yuan has depreciated over 1.5% against the dollar in the last quarter alone.
Implications For Markets And Trading
This move comes amid conflicting economic data, which we believe is forcing the PBOC’s hand. While China’s Q1 2026 GDP growth came in slightly below target at 4.8%, recent export figures for March showed a surprising 6% year-over-year increase, largely aided by the weaker currency. Today’s fixing indicates that managing capital outflow risks and maintaining stability is taking precedence over using a weaker exchange rate to further boost exports.
For derivative traders, this suggests that implied volatility in USD/CNH options is likely overpriced and should decline in the coming weeks. We should consider strategies that profit from a decrease in volatility, such as selling short-dated strangles, as the central bank has now signaled its intention to keep the currency within a tighter range. The probability of the yuan rapidly weakening past the 6.90 level has been significantly reduced by this official intervention.
Looking back, this action contrasts with the policy stance we observed through much of 2025. We recall several cuts to the Reserve Requirement Ratio (RRR) last year, which were implemented to stimulate a sluggish domestic economy. Those easing measures contributed to the yuan’s gradual slide, a trend the PBOC now appears determined to pause.
A more stable yuan typically provides a calming effect across regional emerging markets. We should anticipate reduced pressure on other Asian currencies that often move in tandem with the yuan. This could present opportunities in derivatives on regional stock indices, such as the Hang Seng, which often react positively to signs of stability from mainland China.
USD/JPY moved up in Asian trading on Tuesday and reached 159.00 after mixed moves the day before. The pair stayed within the same range seen over the past month, which kept near-term direction unclear.
The yen weakened as concerns grew that Japan’s economy could face pressure if energy supplies are disrupted, linked to shipping problems through the Strait of Hormuz. At the same time, expectations of tighter Bank of Japan policy and worries about possible market action by authorities limited further yen losses.
BoJ Policy And Intervention Risk
Reuters reported that the Bank of Japan is expected to keep rates unchanged in April due to Middle East uncertainty, but may signal it could raise rates as soon as June because higher imported energy costs may affect inflation. Japanese officials also said they will not accept excessive volatility and are ready to take “bold” action, keeping the risk of intervention in focus.
The US dollar traded near a nearly two-month low reached last Friday as markets reduced expectations of a US Federal Reserve rate rise. Differences between Bank of Japan and Federal Reserve policy outlooks continued to limit the pair, and further gains would need stronger buying.
We remember looking at this situation in 2025, when the pair was stuck around the 159 level amid uncertainty. The fears of intervention were realized later that year when authorities sold dollars heavily in the third quarter, spending a record ¥10 trillion as the rate approached 160. That action, combined with the policy shifts that followed, has since pushed the pair significantly lower.
The divergent policy expectations mentioned back then fully played out over the last year. The Bank of Japan followed through with two small rate hikes, bringing its policy rate to 0.25%, while the Federal Reserve has cut its benchmark rate three times to the current 4.50%. This interest rate differential compression is the main reason we are now trading near 145.50, a far cry from the highs of 2025.
Options Strategy For a Rangebound Market
For the coming weeks, selling volatility appears to be the most sensible strategy for derivative traders. With the major policy shifts now in the past and the pair settling into a new equilibrium, implied volatility in USD/JPY options has fallen to its lowest level in 18 months. We see an opportunity in constructing short strangles or iron condors centered around the 145 strike price to collect premium from this stable environment.
However, we should stay alert to new inflation data that could disrupt this calm. The most recent US CPI reading for March 2026 came in slightly above forecasts at 3.1%, causing some to question whether the Fed will continue its easing cycle. Traders should consider using some of the premium earned from selling options to buy cheap, far out-of-the-money call options as a hedge against any unexpected return of dollar strength.
EUR/USD traded slightly lower near 1.1785 in early Asian hours on Tuesday, as markets assessed Middle East tensions before a 14-day ceasefire is due to expire on Wednesday. Germany and Eurozone ZEW surveys are due later on Tuesday, while the US March Retail Sales report is also scheduled.
US President Donald Trump said he is in no rush to end the conflict with Iran, but also said he expects new talks with Tehran in Pakistan. The comments came as the ceasefire deadline approaches.
Ceasefire Talks And Market Reaction
Iranian Parliament speaker Mohammad Bagher Ghalibaf said Iran will not accept negotiations with the US while under threat, according to the Guardian. Iranian Foreign Minister Abbas Araghchi said “continued violations of the ceasefire” by the US hinder the diplomatic process.
Uncertainty around US-Iran ceasefire discussions supported demand for the US Dollar, which weighed on EUR/USD. The pair faced headwinds as risk conditions remained unsettled.
European Central Bank officials were reported to prefer keeping interest rates unchanged at the April policy meeting. Barclays expects attention to move towards possible 25 basis point hikes in June and September, linked to an energy-driven inflation rise.
We recall this time last year, in the spring of 2025, when EUR/USD was trading near 1.18 amid uncertainty over US-Iran ceasefire talks. The market was also pricing in future rate hikes from the European Central Bank to fight a surge in energy prices. At the time, the focus was on how these two factors would drive the currency pair.
Those US-Iran ceasefire negotiations eventually stalled, creating risk-off sentiment that boosted the US Dollar through the second half of 2025. This geopolitical risk premium has become a recurring theme, causing the Cboe Volatility Index (VIX) to average over 19 for the last six months, a notable increase from prior years. The underlying tensions continue to simmer, adding a layer of uncertainty to markets.
Policy Divergence And Options Positioning
The European Central Bank did follow through with two 25 basis point hikes in 2025, but the effect has been muted by stubborn US inflation. With the latest US Consumer Price Index for March 2026 holding at 2.9%, the Federal Reserve has signaled it will hold rates higher for longer. This policy divergence has been the primary driver pushing EUR/USD down to the 1.07 handle where we see it today.
Given this environment, we see continued downward pressure on the EUR/USD pair. Traders should consider buying June 2026 put options with a strike price around 1.06 to capitalize on further dollar strength. This strategy offers a defined-risk way to position for a break of the year’s lows.
However, any sudden de-escalation in geopolitical tensions or a surprisingly weak US jobs report could cause a sharp snap-back rally. To prepare for an increase in volatility in either direction, purchasing a long straddle for May expiration could be effective. This allows a trader to profit from a significant price move, regardless of the direction.
The upcoming data on US Q1 GDP and the flash estimate for Eurozone April inflation will be critical catalysts. A robust US growth figure above the forecasted 2.1% would reinforce the bearish case for EUR/USD, making puts more attractive. Conversely, an unexpected jump in European inflation could force the ECB to adopt a more hawkish tone, benefiting call option strategies.
NZD/USD rose to about 0.5910 in early Asian trading on Tuesday, as the New Zealand Dollar strengthened after inflation data. Focus later on Tuesday turns to the US March Retail Sales report.
Statistics New Zealand said CPI increased 3.1% year on year in Q1 2026, matching the 3.1% rise in Q4 2025 and above the 2.9% forecast. Quarterly CPI rose 0.9% in Q1 from 0.6%, above the 0.8% estimate.
The US Dollar could find support from rising US–Iran tensions, which can lift demand for safe-haven currencies. A two-week ceasefire is due to end on Wednesday.
US President Donald Trump said on Monday he is not likely to extend the ceasefire with Iran. Iran’s top negotiator said Tehran will not negotiate under threats and accused Trump of seeking a “table of surrender”.
The New Zealand dollar is seeing some strength after inflation came in hotter than expected. This Q1 CPI reading of 3.1% YoY means the Reserve Bank of New Zealand will likely feel pressure to keep interest rates high for longer. We see this as delaying any potential rate cuts that the market might have been anticipating for later this year.
However, a major risk is the escalating tension between the US and Iran, with a ceasefire set to expire this week. A failure to extend it could trigger a flight to safety, benefiting the US dollar. We remember how the VIX index, a key measure of market fear, surged over 45% in the week after the conflict in Ukraine began back in 2022, showing how quickly markets can pivot to risk-off sentiment.
All eyes are now on the US Retail Sales report for March, which is due out later today. A strong number would reinforce the idea of a robust US economy, giving the Federal Reserve less reason to cut rates and further strengthening the dollar. For example, back in March 2024, retail sales beat expectations and rose 0.7%, which provided a significant lift to the Greenback at the time.
Given these powerful but opposing forces, we believe volatility in the NZD/USD is the main takeaway for the coming weeks. One-week implied volatility for the pair is already climbing towards 12% as traders anticipate a significant price swing. This environment suggests that long volatility strategies, such as buying straddles or strangles, could be effective to profit from a large move in either direction.
For those with existing positions, using options to hedge against a sharp reversal is a prudent move. Purchasing put options can protect a long NZD position from a sudden drop caused by geopolitical news or strong US data. Alternatively, a trader convinced of one outcome could use options to make a defined-risk bet, such as buying a call option if they believe the RBNZ’s stance will ultimately outweigh the geopolitical risks.
Written on April 21, 2026 at 5:36 am, by josephine
Gold (XAU/USD) was little changed near $4,825 in early Asian trading on Tuesday, as markets assessed fresh geopolitical risk in the Middle East. Prices held steady as uncertainty continued around regional security and diplomacy.
Reuters reported on Monday that Iran is considering attending peace talks with the United States in Pakistan, after Islamabad moved to end a US blockade of Iran’s ports. Officials said no decision had been made, while Iranian Foreign Minister Abbas Araghchi cited “continued violations of the ceasefire” by the US as an obstacle to further talks.
Oil prices have risen on concerns about a breakdown in US-Iran talks and the possibility of a renewed blockade of the Strait of Hormuz. Higher energy costs can add to inflation expectations and reduce the likelihood of interest-rate cuts, which can limit demand for non-interest-bearing assets such as gold.
Later on Tuesday, the focus is the US Retail Sales report. Retail Sales are forecast to rise 1.4% month-on-month in March, up from 0.6% in February; weaker-than-expected inflation could pressure the US dollar and support dollar-priced gold.
With gold trading near $4,825, the market is caught between Middle Eastern geopolitical support and the pressure of high interest rates. This deadlock suggests that outright directional bets are risky in the immediate term. We see traders becoming cautious, waiting for a clear catalyst to break the current range.
The primary upside risk is a complete breakdown in the US-Iran peace talks, which could escalate tensions in the Strait of Hormuz. We saw during similar episodes in 2019 that even the threat of disruption to oil supplies can cause a flight to safety, benefiting gold. A renewed blockade would almost certainly push gold toward new highs, making long call options an attractive hedge.
However, the dominant headwind for gold remains stubborn inflation and the corresponding central bank policy. With the last US Consumer Price Index (CPI) report showing inflation running at 3.1%, well above the Fed’s target, the market has priced out most expected rate cuts for this year. This high interest rate environment increases the opportunity cost of holding a non-yielding asset like gold.
This week’s US Retail Sales data will be a crucial test of this dynamic. A figure coming in stronger than the expected 1.4% would reinforce the idea of a robust US economy, likely strengthening the dollar and pushing gold lower. Conversely, a weak number could revive rate cut hopes and provide a lift for the precious metal.
Given these conflicting signals, we believe traders should consider strategies that capitalize on volatility rather than direction alone. Buying long-dated straddles or strangles could prove effective, as they would profit from a large price move in either direction. This approach allows one to position for a breakout without betting on whether it will be caused by a missile or a weak economic report.
We also have to look at how implied volatility behaved during the 2025 debt ceiling negotiations, where it spiked significantly before collapsing once a deal was reached. The current situation feels similar, suggesting that selling options premium through strategies like iron condors could be profitable if peace talks succeed and gold’s price action calms down. This would be a bet that the current uncertainty is overpriced by the options market.
Written on April 21, 2026 at 5:31 am, by josephine
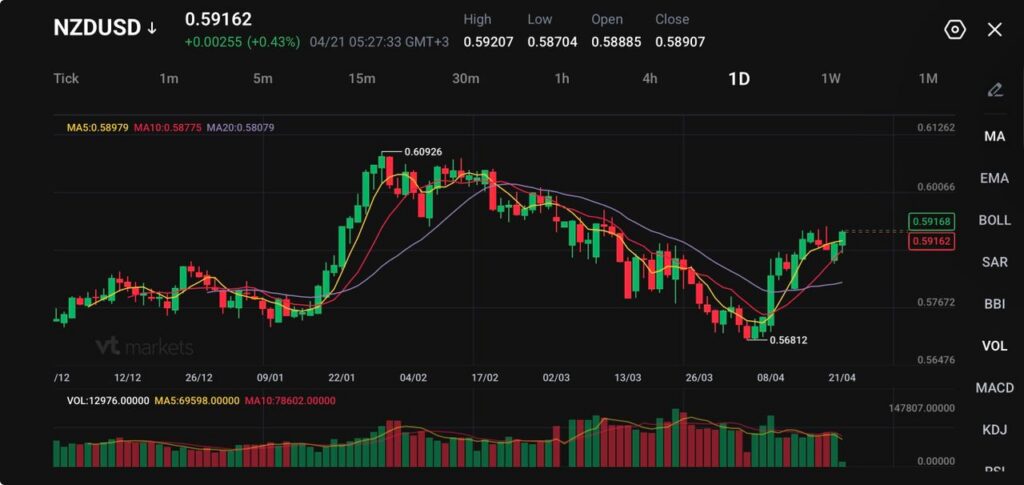
NZDUSD trades at 0.59162, up 0.00255 (+0.43%), after touching 0.59207 and moving close to the recent five-week high zone.
New Zealand CPI rose 0.9% in Q1, while annual inflation held at 3.1%, above the RBNZ’s 1% to 3% target band for a second straight quarter.
Markets lifted the implied chance of a 25 basis-point RBNZ hike next month to about 45%, up from 27% a day earlier, while 2-year government yields jumped 9 basis points to 3.555%.
The kiwi moved higher because the inflation report was firm enough to push the market back toward a more hawkish view of rates. Quarterly CPI rose 0.9%, ahead of the softer disinflation profile many traders had hoped for, while annual inflation held at 3.1%.
That left price growth above the Reserve Bank of New Zealand’s target band for a second consecutive quarter and pushed rate-hike expectations higher.
New Zealand inflation unexpectedly stayed above the Reserve Bank’s 1-3% target in the first quarter, even before the expected Iran-war driven surge in consumer prices from higher fuel and other costs https://t.co/tFqKjzFhi2
A hotter inflation print gives the currency clearer domestic support via rates. The market no longer has the luxury of assuming inflation will drift back into line without another policy response.
A cautious near-term view still favours support for NZDUSD while inflation stays sticky enough to keep hike risk alive.
Yields Turn Supportive
The bond market reacted quickly. The implied probability of a quarter-point hike next month rose to about 45%, from 27% the previous day. Markets now price about 82 basis points of total tightening, up from 70 basis points a day earlier. New Zealand’s 2-year government yield rose 9 basis points to 3.555%, ending a five-day run of declines.
New Zealand’s central bank will soon announce steps to increase the transparency of its monetary policy decisions, Governor Anna Breman said https://t.co/F7qyGgfqZl
That gives NZDUSD more of a rate cushion than it had a week ago. In a market still highly sensitive to central-bank repricing, even a moderate shift in rate expectations can move the currency sharply, especially when the US dollar is not trending decisively higher.
The kiwi is now being supported less by broad risk appetite alone and more by a specific domestic inflation problem that the central bank may have to address.
Recovery Remains Uneven
The complication is that inflation is not the whole story. Business confidence has deteriorated sharply. A private survey showed a net 4% of firms expect business conditions to worsen, compared with 48% optimism in the prior quarter.
That is a brutal swing and a reminder that the domestic recovery remains fragile even before the full effect of the Middle East energy shock comes through.
That leaves the RBNZ with a familiar problem. Inflation is too high, but the growth backdrop is not clean enough to make tightening comfortable.
Governor Anna Breman said last week that she still expects the economy to grow in 2026, especially if the ceasefire in the Middle East holds, but the central bank has already warned it may have to act if inflation becomes entrenched.
New Zealand’s central bank will respond with interest-rate increases to any acceleration in core inflation, Governor Anna Breman said Thursday, as fuel prices surge in response to the conflict in the Middle East https://t.co/A4aWGqiMnS
A cautious forecast still sees the kiwi supported by rate repricing in the short term, but the rally likely becomes harder to extend if growth data continues to soften.
Iran Shock Remains Inflation Driver
The inflation report only captured the first phase of the energy shock, which is why markets reacted so aggressively. Oil and logistics stress from the Iran conflict have already pushed up costs across Australia and New Zealand, and the second-quarter numbers may show that more clearly.
Recent reporting has already flagged the pressure on airlines, exporters, logistics firms, and building-material costs across the region.
Oil prices could rise to $110 per barrel if traffic in the Strait of Hormuz remains disrupted for another month, according to Citigroup https://t.co/PE0AZVxlpC
The current CPI result is particularly important, as it holds more weight than a standard quarterly report. It suggests that inflation was already entrenched before the full impact of war-related costs had a chance to materialise. This raises the likelihood that the RBNZ may need to maintain a restrictive policy, even if economic growth remains lacklustre.
NZDUSD Technical Outlook
NZDUSD is trading near 0.5916, extending its recovery from the recent swing low around 0.5681, with price now stabilising just below short-term resistance. The pair has shifted from a clear downtrend into a corrective rebound phase, supported by improving short-term momentum.
From a technical standpoint, the bias is turning cautiously bullish in the near term. Price has reclaimed the 5-day (0.5897) and 10-day (0.5877) moving averages, both of which are now sloping upward and acting as immediate support. The 20-day (0.5807) remains below and is beginning to flatten, suggesting that downside pressure is fading while a base forms.
Key levels to watch:
Support: 0.5900 → 0.5875 → 0.5800
Resistance: 0.5930 → 0.6000 → 0.6090
The pair is currently consolidating just under the 0.5930 resistance zone, which aligns with recent highs in this recovery leg. A clean break above this level could open the path toward the 0.6000 psychological level, with further upside potential toward 0.6090 if momentum builds.
On the downside, 0.5900 acts as immediate support. A break below this level may see a pullback toward 0.5875, though such a move would likely remain corrective unless price slips back below the 0.5800 region.
Overall, NZDUSD is showing early signs of a trend shift, with buyers stepping in after the March decline. The near-term focus remains on whether price can clear 0.5930 to confirm continuation, or if it stalls and returns to range-bound behaviour.
What Traders Should Watch Next
The next move depends on whether the inflation story keeps dominating the weaker growth story. Another round of firm domestic inflation or labour data would support the case for tighter policy and keep NZDUSD supported near the highs.
A softer activity backdrop or a renewed global risk scare could slow that move quickly. The cross with the Aussie carries weight, because part of the kiwi’s strength has come from rate expectations shifting faster in New Zealand than in Australia.
NZDUSD moved higher because the first-quarter CPI reading came in hot enough to revive the chance of another RBNZ hike. Quarterly inflation rose 0.9%, while annual inflation held at 3.1%, leaving it above the 1% to 3% target band for a second straight quarter.
Why Does A 3.1% Annual CPI Reading Matter So Much For The Kiwi?
Because it keeps inflation above the RBNZ’s target range and makes it harder for the central bank to sound relaxed. That usually supports the currency by lifting rate expectations.
How Much Did Rate-Hike Expectations Change?
Markets lifted the implied chance of a 25 basis-point RBNZ hike next month to about 45%, up from 27% a day earlier. Total expected tightening also rose to about 82 basis points, from 70 basis points.
Why Did New Zealand Bond Yields Jump?
The inflation surprise pushed traders to price a more hawkish RBNZ path. That sent the 2-year government bond yield up 9 basis points to 3.555%, ending a five-day decline.
Why Has The Kiwi Not Broken Higher More Aggressively?
Because the growth backdrop is still shaky. A private business survey showed a net 4% of firms expect conditions to worsen, compared with 48% optimism in the previous quarter. That weak confidence reading limits how far traders want to push the tightening story.
Start trading now – Click here to create your real VT Markets account
Written on April 21, 2026 at 5:17 am, by josephine
GBP/USD rose 0.1% on Monday to about 1.3530, after easing from last week’s high near 1.3600. It has been moving between 1.3500 and 1.3600, after rebounding from early April lows near 1.3160.
Geopolitics is driving markets as a two-week US-Iran ceasefire is due to end on Wednesday night, with an extension called “highly unlikely”. West Texas Intermediate futures jumped more than 6% to $89 a barrel after the US seized an Iranian cargo ship in the Gulf of Oman.
Upcoming events include the UK labour market report, US Retail Sales, and Kevin Warsh’s Senate hearing as Fed chair-designate. The UK CPI and flash PMI data in the UK and US also feature, with UK Retail Sales and University of Michigan sentiment due on Friday.
GBP/USD was at 1.3534 on a 15-minute chart, with the day’s open at 1.3485 and Stochastic RSI at 18.85. On the daily chart it traded at 1.3535, with the 50-day EMA at 1.3421, the 200-day EMA at 1.3358, and Stochastic RSI at 93.74.
The pound dates to 886 AD and is the world’s fourth most traded currency, making up 12% of FX, or $630 billion a day (2022). GBP/USD accounts for 11% of FX, GBP/JPY 3%, and EUR/GBP 2%, with policy set by the Bank of England.
We see GBP/USD consolidating near 1.3530, but the rally from the early April lows looks tired. The daily chart shows a very overbought stochastic reading, suggesting that upside momentum is stretched. This hesitation means initiating new long positions is risky until we get a clear catalyst.
The main focus is the impending expiration of the US-Iran ceasefire, which is creating major uncertainty. We saw a similar situation during the geopolitical tensions of early 2022, when Brent crude oil prices surged over 30% in just two weeks. With West Texas Intermediate already jumping to $89 a barrel, a failure to extend the ceasefire could trigger a significant risk-off move, likely strengthening the dollar and pushing GBP/USD lower.
Given this binary risk, we should look at options to trade the potential for a large price swing. Buying a strangle, which involves purchasing both an out-of-the-money call and put option, could be an effective strategy. This position would profit from a sharp move in either direction following the ceasefire news, without betting on the specific outcome.
On top of the geopolitical risk, we have a heavy week of economic data, including key inflation and growth reports from both the UK and the US. Historically, the UK’s Consumer Price Index (CPI) release can cause intraday swings of 50 to 80 pips in GBP/USD within the first hour. This week’s print will be critical for Bank of England policy expectations and will add another layer of volatility.
For those of us already holding long positions, it is prudent to protect our gains from a potential downturn. We can buy protective put options with a strike price near the 50-day moving average around 1.3420. This acts as an insurance policy, limiting our downside if geopolitical tensions escalate or if the UK economic data disappoints.
Conversely, if the ceasefire is extended, we could see a relief rally that breaks the 1.3600 resistance level. To position for this, we could use bull call spreads to bet on a move higher with a defined risk. This approach allows us to capitalize on the market’s current optimistic view while capping our potential loss if that view proves wrong.
Written on April 21, 2026 at 5:05 am, by josephine