Back

SP500 Rebounds as Diplomacy Eases The Opening Shock

Key Points

  • SP500 traded at 7167.05, down 3.41 points, or 0.05%, after reaching a session high of 7185.35.
  • S&P 500 and Nasdaq 100 futures advanced on Monday after Iran sent a new proposal to the US on reopening the Strait of Hormuz.
  • Microsoft, Amazon, Alphabet, Meta, and Apple earnings now sit beside Wednesday’s Federal Reserve decision as the main market tests.

US equity futures began Monday with a nervous tone, then reversed as traders reacted to a fresh diplomatic signal from Iran. S&P 500 and Nasdaq 100 futures advanced after Iran submitted a new proposal to the US aimed at reopening the Strait of Hormuz and easing tensions. The proposal was delivered via Pakistani mediators and focused first on de-escalation and maritime access, with nuclear talks pushed into a later phase.

That shift helped risk appetite recover from earlier losses. The market had opened lower after President Donald Trump cancelled plans to send senior envoys for a second round of talks with Iran. Tehran also repeated that it would not negotiate under threats or blockade conditions. The proposal now gives traders a reason to price a lower tail risk, even if the wider conflict remains unresolved.

Hormuz Still Holds The Market’s Nerve Centre

Iran’s proposal reportedly calls for extending the ceasefire to support progress toward a lasting settlement, while deferring nuclear negotiations until the US blockade of the Strait of Hormuz is lifted.

This gives markets a cleaner short-term framework: reopen the strait first, then argue over the nuclear track later. The plan, delivered through Pakistani mediators, would extend the ceasefire while nuclear talks come later after the blockade is lifted.

That sequencing helped equities because the Strait of Hormuz sits at the centre of the inflation trade. When traders fear a longer disruption, oil prices rise, fuel costs climb, and bond markets start to question how quickly inflation can cool. When diplomacy looks possible, equities usually get breathing room, especially growth stocks and tech.

Still, the market has not fully removed the risk premium. The S&P 500 and Nasdaq-100 futures edged up 0.1% and 0.3%, respectively, while oil traded above $95 a barrel as geopolitical risk stayed active. Traders are watching whether Iran’s offer to reopen the strait could cool pressure across energy markets.

If talks gain pace and shipping risk falls, SP500 could extend toward fresh highs. If the talks stall again, oil could rise and pull equities back through a stronger inflation-risk channel.

Big Tech Earnings Take Over The Next Trade

The next test comes from megacap technology earnings. Traders are turning to Microsoft, Amazon, Alphabet, Meta, and Apple this week. This group carries heavy index weight, so earnings guidance will matter as much as the headline numbers.

The market wants proof that AI spending still supports revenue growth, cloud demand, margins, and forward guidance. Apple, Amazon, Google, Microsoft, and Meta lead a heavy earnings week, while AI and semiconductor stocks helped push the Nasdaq and S&P 500 to fresh highs in the prior week.

This creates a narrow path for bulls. Strong earnings can confirm the rally and draw buyers back into growth names. Weak guidance could hurt the index even if the Hormuz story improves, because SP500 has already rallied hard from its early-April low.

Traders may reward firms that show margin control and clear AI returns. They may punish companies that rely too much on long-term AI promises without near-term earnings support.

Fed Decision Keeps Rate Risk In Play

The Federal Reserve is widely expected to keep its policy rate unchanged on Wednesday. The Fed is expected to hold the fed funds rate at 3.50% to 3.75% as it weighs inflation risks tied to surging oil prices and awaits confirmation of its new chair.

That puts Chair Jerome Powell’s tone at the centre of the market. A steady rate decision alone may not move equities much. The press conference could. Traders will listen for any sign that higher oil prices are slowing the case for further easing, or that the Fed still sees inflation cooling enough to support future cuts.

The Fed decision also lands in the same week as Big Tech earnings. Saxo described Wednesday as a volatility cluster, with the Fed decision arriving before major technology earnings from Alphabet, Amazon, Meta, and Microsoft after the close.

If Powell sounds calm on inflation and Big Tech delivers solid guidance, SP500 can hold its breakout tone. If Powell leans hawkish while earnings disappoint, the index could struggle to defend its short-term moving averages.

Technical Analysis Shows A Strong But Crowded Rally

SP500 is trading near 7167, holding just below recent highs after a strong rally from the 6318 low. Price action shows a steady advance with higher highs and higher lows, although momentum is beginning to slow as the index approaches resistance.

From a technical standpoint, the bias remains firmly bullish in the near term. Price is trading well above all key moving averages, with the 5-day (7135) and 10-day (7098) sloping upward and providing immediate support. The 20-day (6892) sits further below and continues to trend higher, reinforcing the strength of the current uptrend.

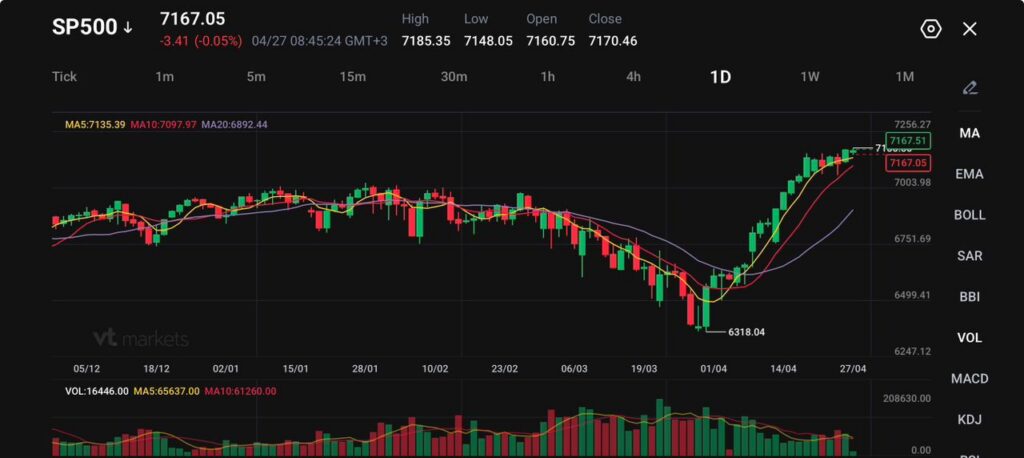
Key levels to watch:

  • Support: 7135 → 7095 → 6890
  • Resistance: 7185 → 7250 → 7350

The index is currently testing the 7185 resistance zone, which aligns with recent highs. A clean break above this level could extend the rally toward 7250, with further upside potential if momentum accelerates.

On the downside, 7135 is acting as immediate support. A break below this level could lead to a short-term pullback toward 7095, though such a move would likely remain corrective as long as price holds above the rising 20-day average.

Overall, the SP500 remains in a strong uptrend with signs of near-term consolidation, as price pauses beneath resistance. The focus now is on whether buyers can push through 7185, or if the market pulls back slightly to reset before the next leg higher.

What Traders Should Watch Next

SP500 now sits between three forces: diplomacy, earnings, and the Fed. A stable Hormuz backdrop can support risk appetite, but the index still needs Big Tech earnings to justify its premium near record territory.

A clean move above 7185.35 would keep 7256.27 in focus. Failure to hold 7135.39 would point to a short-term reset, especially if oil rises again or Powell pushes back against rate-cut hopes. The broader bias stays constructive while price holds above 7097.97, but the rally looks more exposed to headline shocks after such a fast climb from 6318.04.

Learn more about trading Indices on VT Markets today.

Trader Questions

Why Did The SP500 Rebound On Monday?

The SP500 rebounded after reports said Iran had submitted a new proposal to the US aimed at reopening the Strait of Hormuz and easing tensions.

The move helped S&P 500 and Nasdaq 100 futures reverse earlier losses after a weaker start to the session. Traders treated the proposal as a short-term relief signal, even though wider geopolitical risk remains active.

What Is Iran’s New Proposal About?

Iran’s proposal was reportedly delivered through Pakistani mediators. It called for extending the ceasefire to support progress toward a lasting settlement.

The proposal also deferred nuclear negotiations until the US blockade of the Strait of Hormuz is lifted. This gave markets a clearer short-term focus: reopen the strait first, then return to the harder nuclear talks later.

Why Does The Strait Of Hormuz Matter For The Stock Market?

The Strait of Hormuz matters because any disruption can lift oil prices, fuel inflation fears, and raise costs for businesses and consumers.

When oil prices rise too quickly, traders often reduce exposure to risk assets such as equities. If the strait reopens or shipping risk eases, the SP500 may gain support from lower energy stress and better risk sentiment.

Why Did US Stock Futures Open Lower Earlier?

US stock futures opened lower after President Donald Trump cancelled plans to send senior envoys for a second round of talks with Iran.

Tehran also said it would not engage in negotiations under threats or blockade conditions. That raised fears that diplomacy was losing traction before the new Iranian proposal helped ease some pressure.

Which Big Tech Earnings Matter This Week?

Investors are watching earnings from Microsoft, Amazon, Alphabet, Meta, and Apple this week.

These companies carry heavy weight in the SP500 and Nasdaq 100. Their results could shape market direction, especially if guidance gives traders a clearer view on AI spending, cloud demand, margins, advertising growth, and consumer demand.

Start trading now – Click here to create your real VT Markets account

FXStreet data shows gold prices in Pakistan climbed, with the precious metal recording gains locally today

Gold prices in Pakistan rose on Monday, based on FXStreet data. Gold was priced at PKR 42,356.48 per gram, up from PKR 42,198.95 on Friday.

Gold increased to PKR 494,037.70 per tola from PKR 492,200.30 per tola on Friday. Listed prices were PKR 423,564.80 for 10 grams and PKR 1,317,438.00 per troy ounce.

Pakistan Gold Price Snapshot

FXStreet converts international gold prices into Pakistani rupees using USD/PKR and local measurement units. Prices are updated daily at the time of publication and are for reference, as local rates may differ.

Gold is used as a store of value and a medium of exchange, and is also used in jewellery. It is often treated as a safe-haven asset and as a hedge against inflation and currency weakness.

Central banks hold the most gold and may buy it to diversify reserves. They added 1,136 tonnes worth about $70 billion in 2022, according to the World Gold Council.

Gold often moves inversely to the US Dollar and US Treasuries, and can also move against risk assets such as shares. Price drivers include geopolitics, recession risks, interest rates, and US Dollar strength.

Market Drivers And Trading View

With the US Dollar Index slipping to 104.2 from its recent highs, we see an immediate opportunity in gold. This inverse relationship is a core market driver, and the dollar’s recent weakness provides a tailwind for precious metals. The market is clearly favoring assets priced against the dollar.

This dollar movement is heavily influenced by expectations for future interest rates. The latest US CPI data for March 2026 came in at a subdued 2.8%, increasing market bets that the Federal Reserve will initiate a rate cut by the third quarter. Lower interest rates decrease the opportunity cost of holding non-yielding assets like gold, making it more attractive.

We are also seeing continued strong demand from central banks, a trend that has persisted since the record buying we observed back in 2022. The World Gold Council’s most recent report indicated that central banks, particularly in Asia, collectively added over 290 tonnes in the first quarter of 2026. This consistent institutional buying provides a solid price floor and signals underlying strength in the market.

Geopolitical tensions also remain a factor, with ongoing trade negotiations and maritime disputes creating market uncertainty. During turbulent times, gold serves its classic role as a safe-haven asset. Looking back at how gold performed during the instability of 2025, we see a clear pattern of it acting as a hedge against volatility in riskier assets like equities.

Given these factors, derivative traders should consider establishing bullish positions. Buying call options on gold futures, perhaps targeting the resistance levels seen late last year, could offer significant upside. This strategy allows for participation in gold’s potential rally while defining risk in the coming weeks.

Create your live VT Markets account and start trading now.

According to compiled data, gold prices in India rose, reflecting an increase in the metal’s value today

Gold prices in India rose on Monday, based on FXStreet-compiled data. Gold was priced at INR 14,367.49 per gram, up from INR 14,310.60 on Friday.

Gold rose to INR 167,581.00 per tola from INR 166,917.50 per tola on Friday. Listed reference prices were INR 143,676.10 for 10 grams and INR 446,879.20 per troy ounce.

India Gold Price Update

FXStreet derives India gold prices by converting international prices using USD/INR and local units. Prices are updated daily at publication time and may differ slightly from local market rates.

Central banks were reported as the largest gold holders and buyers. They added 1,136 tonnes of gold worth around $70 billion in 2022, according to the World Gold Council, the highest annual total since records began.

Gold is described as tending to move inversely to the US Dollar and US Treasuries. Price drivers listed include geopolitical risk, recession fears, interest rates, and US Dollar movements.

The post states that an automation tool was used in its creation. It is attributed to the FXStreet Team.

Derivative Market Positioning

With gold prices showing strength, we are seeing derivative traders react to a mix of conflicting market signals. The asset’s traditional role as a hedge against inflation and geopolitical risk is being tested by current central bank policies. This tension is creating opportunities for those who can navigate the expected volatility in the coming weeks.

The US Federal Reserve’s latest statements indicate interest rates may remain elevated, especially after the March 2026 inflation report showed a higher-than-expected reading of 3.1%. This has kept the US Dollar Index firm around the 106 mark, which normally puts pressure on gold prices. Some traders are therefore positioning for a potential short-term dip by purchasing put options, anticipating that a strong dollar could cap the recent rally.

However, strong underlying support for gold remains a powerful factor for the bulls. We note that geopolitical uncertainty continues to simmer, and recent World Gold Council data for the first quarter of 2026 showed central banks bought another 290 tonnes of gold, continuing their aggressive accumulation trend. This sustained demand is leading many traders to establish long positions through futures or call options, betting that safe-haven buying will overcome the drag from interest rate policy.

Looking back, we saw a similar dynamic play out in 2025, when gold prices surged as recession fears prompted initial rate cuts, only to face headwinds later in the year as inflation proved persistent. That period of whipsawing prices serves as a valuable lesson on market volatility. For those uncertain of direction but expecting a significant price move, strategies that profit from volatility, such as straddles, are becoming increasingly popular.

Create your live VT Markets account and start trading now.

WTI crude hovers near $93.65 as Strait of Hormuz disruptions persist and US-Iran peace talks stall

WTI, the US crude oil benchmark, traded near $93.65 in Asian hours on Monday. Prices edged up as transit through the Strait of Hormuz remained severely restricted and US–Iran talks stalled.

Iran reportedly sent the US a proposal to reopen the Strait of Hormuz and extend a ceasefire, via Pakistani mediators. It was unclear whether the White House would consider the plan, while concerns about supply disruption supported prices.

Geopolitical Tensions Drive Oil Prices

On Sunday, President Trump told Jared Kushner and Steve Witkoff to skip a trip to Pakistan and said Iran “offered a lot, but not enough”. Iran’s President Masoud Pezeshkian said Iran would not enter “imposed negotiations under threats or blockade”.

Traders awaited the American Petroleum Institute (API) inventory report due on Tuesday. A larger-than-expected draw can point to stronger demand, while a larger build can suggest weaker demand or excess supply.

WTI stands for West Texas Intermediate and is one of three major crude types, alongside Brent and Dubai. It is described as “light” and “sweet”, is sourced in the US, and is distributed via the Cushing hub.

WTI prices are driven by supply and demand, the US dollar, geopolitical risk, sanctions, and OPEC decisions. API data is published every Tuesday and EIA data the next day, with results within 1% of each other 75% of the time; the EIA is seen as more reliable. OPEC has 12 members, while OPEC+ adds ten non-OPEC members, including Russia.

Options Strategies For Elevated Volatility

The current WTI price near $93.65 is driven entirely by geopolitical fear, not just fundamentals. This level of uncertainty means we should expect significant price swings in the coming weeks. For derivative traders, this translates to elevated implied volatility, making option strategies particularly relevant.

We are looking at the potential for a severe supply shock, as nearly 21 million barrels of oil pass through the Strait of Hormuz daily, representing about 21% of global petroleum liquids consumption. A strategy to consider is buying out-of-the-money call options, such as the June $100 or $105 strikes, to profit from a potential price spike if talks collapse completely. This approach offers a defined risk limited to the premium paid.

Conversely, a surprise breakthrough in negotiations could send prices tumbling back toward the low-$80s range we saw for much of 2025. To prepare for this, purchasing put options can serve as a hedge against long positions or as a direct bet on a peaceful resolution. The high volatility, with the CBOE Crude Oil Volatility Index (OVX) recently pushing above 40, means these options are expensive, so traders might look at put spreads to reduce the initial cost.

Given the binary nature of the geopolitical outcome, we believe a good strategy is to trade the volatility itself. Buying a straddle, which involves purchasing both a call and a put option with the same strike price and expiration, could be profitable if the price moves sharply in either direction. This is especially relevant heading into this week’s API inventory report, which could act as a catalyst for a major price move.

We remember the price volatility back in 2025 when OPEC+ surprised the market with production cuts, causing a short-term spike before demand concerns took over. The current situation feels similar, where news headlines are the primary driver, not underlying demand which has been moderate according to recent EIA data showing only modest inventory draws. Therefore, any positions we take must be nimble, as a single news report could erase gains.

Create your live VT Markets account and start trading now.

FXStreet data shows Malaysia’s gold price increased, with bullion edging higher, as reported in compiled figures today

Gold prices in Malaysia rose on Monday, based on FXStreet data. Gold was priced at MYR 600.51 per gram, up from MYR 598.44 on Friday.

The price per tola increased to MYR 7,004.28 from MYR 6,980.08 on Friday. Other listed prices were MYR 6,005.14 for 10 grams and MYR 18,678.09 per troy ounce.

Malaysia Gold Pricing Method

FXStreet calculates Malaysia’s gold prices by converting international rates using USD/MYR into local units. Prices are updated daily at the time of publication and are for reference, as local rates may differ.

Gold has been used historically as a store of value and a medium of exchange. It is often bought during market stress and is also used as a hedge against inflation and currency weakness.

Central banks held the largest gold reserves and added 1,136 tonnes worth about $70 billion in 2022, according to the World Gold Council. This was the highest yearly purchase since records began, with emerging economies such as China, India and Turkey increasing reserves.

Gold often moves inversely to the US Dollar and US Treasuries, and can also move opposite to risk assets such as shares. Gold prices are influenced by geopolitical events, recession fears, interest rates, and US Dollar strength, as gold is priced in USD (XAU/USD).

Key Market Drivers

Gold prices are showing a slight uptick, reflecting its role as a store of value against currency fluctuations. This movement, while small, is part of a larger trend that derivative traders need to watch closely. The underlying support for gold remains firm due to persistent and broad-based buying from central banks.

We saw this trend build throughout 2025, continuing the pattern from previous years where central banks consistently added to their reserves. For example, the World Gold Council reported that central banks collectively bought over 1,000 tonnes in both 2023 and 2024, a pace that has established a strong price floor. This consistent demand from official sources suggests that any significant dips in price will likely be met with buying interest.

However, the primary headwind for gold is the outlook for interest rates and the strength of the US Dollar. The market is currently digesting signals that the U.S. Federal Reserve may not cut rates as quickly as was anticipated at the end of last year. Higher interest rates increase the opportunity cost of holding non-yielding gold, which can limit its upside potential.

The inverse relationship with the dollar remains a key factor, as a strong greenback makes gold more expensive for holders of other currencies. Geopolitical instability also continues to simmer in the background, providing a baseline of support for gold as a safe-haven asset. Any escalation in global tensions could easily trigger a flight to safety, benefiting gold prices.

For derivative traders, this environment points towards range-bound conditions with the potential for sharp, headline-driven moves. Selling volatility through strategies like short strangles or iron condors could be advantageous if gold remains contained between the support from central bank buying and resistance from interest rate policy. Conversely, holding long-dated call options offers a low-cost way to position for a potential breakout driven by geopolitical events or a sudden dovish pivot from the Fed.

Create your live VT Markets account and start trading now.

Gold rises over $50 from Asian lows as US-Iran peace optimism and easing inflation weaken USD

Gold rose by more than $50 from an Asian low near $4,672 as some traders bought dips. Reports said Iran sent the US a proposal on reopening the Strait of Hormuz and ending the war, with nuclear talks delayed.

This reduced support for the US dollar and helped gold. Lower oil prices also eased inflation fears and kept expectations open for at least one 25-basis-point US rate cut in 2026.

Geopolitical Risks And Shipping Disruptions

Shipping through the Strait of Hormuz remained mostly blocked due to Iran’s movement limits and a US naval blockade of Iranian ports. Israel’s Prime Minister Benjamin Netanyahu said he ordered strong attacks on Hezbollah targets in Lebanon, keeping risks elevated.

Markets also awaited a two-day FOMC meeting starting Tuesday for guidance on rates amid sticky inflation and firm US activity. News on US-Iran relations was expected to add volatility to gold.

In Asia, gold premiums rose on tight supply and demand. India premiums hit a more than two-and-a-half month high, while China premiums were $9 to $12 an ounce versus $3 to $6 the week before.

Technically, gold stayed range-bound, with RSI near 47 and MACD mildly positive. Support was noted near $4,700 and $4,650-$4,645, while resistance sat at $4,750, $4,800, and $4,860-$4,865, with $5,000 as the next round level.

Trading Strategy And Risk Management

Given the conflicting signals, we should prepare for significant volatility in the coming weeks. The positive news about potential US-Iran talks is causing a short-term rally in gold, but the upcoming FOMC meeting is a major risk event. With US core inflation remaining stubbornly above 3%, a problem we also faced back in 2024 and 2025, the Federal Reserve may deliver a hawkish message that could quickly strengthen the dollar and push gold back down.

The geopolitical situation remains tense and should not be underestimated. The Strait of Hormuz is a critical chokepoint, historically responsible for the passage of about 20% of the world’s daily oil supply, and its continued blockage supports oil prices and the dollar’s safe-haven appeal. This reality puts a cap on how high gold can go based on peace talks speculation alone.

For derivative traders, this environment suggests using options to define risk. Buying call options or bull call spreads on dips towards the $4,650 support area offers a way to position for a potential breakout with a limited downside. This approach aligns with the strong physical demand from Asia, which suggests that sharp drops will likely be met with buying interest.

However, we must temper our bullishness with the reality of a resilient US economy. Recent jobs reports, which have consistently added over 200,000 jobs per month, give the Fed little reason to rush into cutting rates. Therefore, any strength in the dollar following the FOMC meeting could present an opportunity to buy put options as a hedge or a speculative play on gold falling back into its recent range.

Ultimately, we are trading within a well-defined range between roughly $4,650 and $4,865. We should treat these levels as key pivot points for our strategies in the near term. A decisive breakout above the range high would be our signal to become more aggressive with bullish positions, targeting the psychological $5,000 level.

Create your live VT Markets account and start trading now.

During Asian hours, EUR/JPY slips near 186.70, holding nine-day EMA support around 186.50, within bullish channel

EUR/JPY slipped slightly after modest gains the day before, trading near 186.70 during Asian hours on Monday. The daily chart places the pair in an ascending channel, pointing to a bullish bias.

The pair is consolidating above the nine-day and 50-day Exponential Moving Averages (EMAs). The 14-day Relative Strength Index (RSI) is near 60, which suggests positive momentum without extreme conditions.

EUR/JPY may move towards the all-time high of 187.95, set on 17 April. A break above 187.95 could open the way to the channel’s upper boundary near 189.70.

On the downside, immediate support is at the nine-day EMA at 186.75. This area is close to the channel’s lower boundary around 186.60, while a sustained break below the channel could bring the 50-day EMA at 184.94 into view.

The technical analysis was produced with help from an AI tool.

The EUR/JPY cross is signaling a continuation of its upward trend, as it remains within a clear ascending channel. With the price holding above key moving averages, we see the potential for further gains in the near future. This setup encourages strategies that benefit from a rising market.

For those expecting a move higher, buying call options could be a straightforward approach. We are looking at strike prices around the 188.00 level, near the recent high, with a more aggressive target being the 190.00 strike. The current momentum suggests such a push is possible without the market being overly stretched.

This technical picture is supported by recent news, with Eurozone inflation for early April coming in at a firm 2.6%, reinforcing the European Central Bank’s hawkish stance. This continues the policy direction that we saw solidify in the last half of 2025. The euro’s fundamental strength provides a solid backbone for this trade.

Alternatively, selling out-of-the-money put options is a way to generate income while maintaining a bullish bias. We could consider selling puts with a strike near the 186.50 support level for a more aggressive play. A more conservative entry would be to sell puts around the 185.00 strike, which aligns with longer-term support.

This strategy also relies on continued yen weakness, which seems likely given the Bank of Japan just reaffirmed its accommodative policy last week. This policy divergence is widening, especially as Japan’s own preliminary Q1 GDP figures were just reported at a lackluster 0.2%. This dynamic is very similar to the conditions that drove the pair up through 2025.

It is crucial for us to use the lower boundary of the channel, around 186.60, as a key decision point. A decisive break below this level would signal a potential reversal in the bullish trend. Such a move would require us to reassess our positions quickly.

Amid stalled US–Iran talks, silver climbs for a second day, nearing $76 as safe-haven demand rises

Silver (XAG/USD) rose for a second day, trading near $76.00 per troy ounce during Asian hours on Monday. Demand increased as safe-haven buying picked up after US–Iran talks stalled.

US President Donald Trump cancelled a planned delegation to Pakistan, which is mediating talks with Iran. Trump told Jared Kushner and Steve Witkoff not to travel, saying Iran “offered a lot, but not enough”.

Geopolitical Tensions Drive Safe Haven Demand

Trump said, “If they want to talk, they can come to us, or they can call us.” Iranian President Masoud Pezeshkian said Iran would not enter “imposed negotiations under threats or blockade.”

Traffic through a strategic waterway remains largely restricted due to Iran’s controls and a US naval blockade. This has supported crude oil prices and raised concerns about supply disruption.

Higher energy prices can add to inflation pressure and keep central banks cautious, which may cap gains in non-interest-bearing silver. The US Federal Reserve is expected to hold rates steady at its April meeting, with gradual cuts anticipated under incoming Chair Kevin Warsh.

With silver near $76.00, we are seeing a classic conflict between geopolitical fear and monetary policy. The stalled US-Iran talks are providing strong safe-haven support for the metal. However, the resulting spike in energy prices is creating a significant headwind through fears of a hawkish Federal Reserve.

The immediate outlook suggests high volatility, making long-volatility strategies like straddles on silver options attractive. We saw a similar situation back in early 2022 when the conflict in Ukraine sent precious metals soaring over 10% in a matter of weeks. The CBOE Silver Volatility Index (VXSLV) is currently trading above 35, a level not seen since that period, indicating traders are pricing in significant price swings.

Positioning And Fed Risk Ahead

For those betting on further escalation, buying call options on the July futures contract offers leveraged upside with defined risk. A breakdown in talks or further restrictions in the strategic waterway could easily push silver towards the $80 mark. Open interest in out-of-the-money calls has surged nearly 40% in the last week, showing this is already becoming a popular trade.

Conversely, the upcoming Federal Reserve meeting is a major risk, and purchasing put options could be a prudent hedge against a sharp decline. We only need to look back to the 2022-2023 hiking cycle to see how a hawkish Fed can pressure non-yielding assets, even amid inflation. If incoming Chair Warsh signals a firm stance against energy-driven inflation, we could see a rapid unwinding of speculative long positions.

The key is to watch the rhetoric from both Washington and Tehran, as any sign of de-escalation could trigger a sharp sell-off. The latest Commitment of Traders report shows managed money holds its largest net-long position in silver in over two years. This makes the market vulnerable to a sudden reversal if the geopolitical risk premium evaporates before the Fed meeting.

Create your live VT Markets account and start trading now.

During the Asian session, EUR/USD recovers near 1.1730, supported by the 20-day EMA as USD weakens

EUR/USD recovered early losses and traded slightly higher near 1.1730 in Monday’s Asian session. The move came as the US Dollar weakened, with the US Dollar Index (DXY) down 0.06% to about 98.45.

DXY opened around 99.35 after the US cancelled a visit to Islamabad for further Iran peace talks. The cancellation came as Iran’s foreign minister Seyed Abbas Araghchi visited Pakistan to resume discussions.

Iran presented a proposal to the US to reopen the Strait of Hormuz and end the war, according to Axios as cited by Bloomberg. The proposal included delaying nuclear talks until after any US blockade of the Strait of Hormuz is lifted, in the context of an almost two-month-long conflict.

Volatility is expected this week as the Federal Reserve and the European Central Bank announce policy on Wednesday and Thursday. EUR/USD remains above the 20-day EMA at 1.1696, with RSI at 54.9.

Resistance sits at 1.1749, then 1.1828, 1.1941, and near 1.2085. Support levels include 1.1696, 1.1670, 1.1572, and around 1.1413.

As of today, April 27, 2026, we are watching the EUR/USD trade near 1.0850, a level far below what we saw in a similar setup back in 2025. That year, the pair was trading much higher around 1.1730, but the market was also tense ahead of major central bank meetings. The fundamental drivers of volatility, central banks and geopolitics, remain the same today.

We recall how in 2025, tensions between the US and Iran over the Strait of Hormuz caused a sharp, but temporary, spike in the US dollar. Today, while that specific issue has faded, we are now focused on trade disputes in the Asia-Pacific region which could trigger similar safe-haven dollar buying. This shows how geopolitical risk can quickly shift market sentiment, making headline-driven volatility a key factor.

The upcoming Federal Reserve and European Central Bank meetings this week are the market’s primary focus, just as they were then. However, the economic data is now much different; recent reports from earlier this month showed US inflation holding firm at 2.8%, while Eurozone inflation has cooled to 2.1%. This growing divergence suggests the Fed has more reason to maintain a restrictive policy than the ECB.

Given this policy divergence, we are looking at buying EUR/USD put options with a strike price around 1.0800 to position for a potential downward move. These options would provide downside exposure if the Fed signals a more hawkish stance than anticipated. A break below this level could open the way for a slide towards the year’s low of 1.0720.

Volatility is expected to rise sharply around the announcements, and the Cboe EuroCurrency Volatility Index has already ticked up to 8.2 in anticipation. For traders who expect a big move but are unsure of the direction, a long straddle strategy involving buying both a call and a put option could be effective. This would allow a trader to profit from a significant price swing, regardless of whether it is up or down.

We remember from the 2025 incident how fast the market can turn on a single piece of news. Therefore, any long positions should be protected with stop-loss orders below the immediate support at 1.0820. The key is to manage risk carefully, as a surprise from either central bank could easily overwhelm the technical picture.

During Asian trading, the Dollar Index slipped under 98.50 amid reports Iran proposed reopening Hormuz passage

The US Dollar Index (DXY) traded slightly lower at about 98.45 in early Asian trading on Monday, falling below 98.50. The move followed reports that Iran sent the United States a proposal linked to reopening the Strait of Hormuz.

Bloomberg reported that the proposal includes reopening the strait and steps to end the war, with nuclear talks delayed. It also called for extending a ceasefire so both sides can work towards a permanent end to the fighting.

Us Iran Proposal And Market Reaction

On Sunday, US President Donald Trump told Jared Kushner and Steve Witkoff not to travel to Pakistan, which is mediating talks. Trump said Iran “offered a lot, but not enough.”

Markets are also focused on the Federal Reserve rate decision on Wednesday. The Fed is expected to keep the federal funds rate between 3.50% and 3.75%, where it has been since January.

Deutsche Bank analysts said a shift in expected Fed policy towards a more hawkish stance, driven by persistent oil-related inflation, could lift the DXY. The US Dollar is the most traded currency, making up over 88% of global foreign exchange turnover, or about $6.6 trillion per day, based on 2022 data.

We remember how the US Dollar Index reacted last year to news about the Strait of Hormuz, dropping below 98.50 on the mere possibility of a deal. As of today, April 27, 2026, the DXY is stronger, sitting near 103, but that sensitivity to geopolitical shocks remains a key risk. Traders should therefore be cautious, perhaps buying volatility through options on currency ETFs to protect against any sudden Mideast headlines.

Oil Risk And Hedging Ideas

The memory of 2025 serves as a reminder of how tightly oil is linked to these tensions. With Brent crude currently trading around $87 a barrel, a figure supported by ongoing OPEC+ production discipline that has kept global inventories tight, any disruption could cause a significant price spike. We see value in long-dated call options on oil futures or energy sector funds, which act as a direct hedge against a potential conflict flare-up.

The Federal Reserve’s position has changed dramatically since last year when rates were holding steady in the 3.50% to 3.75% range. Today, the central bank has already started a cautious easing cycle, with the federal funds rate now at 4.50% as inflation has cooled to a stubborn 3.4% annually. This shift means we are no longer watching for hikes but for the pace of future cuts.

Given this new environment, the primary derivatives play on the Fed is about the path of interest rates. The market is currently pricing in two more quarter-point cuts by the end of this year, which we believe may be too optimistic given recent inflation data. Therefore, positioning in options on Fed Funds futures that would profit from a slower pace of cuts than anticipated could be a prudent strategy for the coming weeks.

Create your live VT Markets account and start trading now.

Back To Top
server

Hello there 👋

How can I help you?

Chat with our team instantly

Live Chat

Start a live conversation through...

  • Telegram
    hold On hold
  • Coming Soon...

Hello there 👋

How can I help you?

telegram

Scan the QR code with your smartphone to start a chat with us, or click here.

Don’t have the Telegram App or Desktop installed? Use Web Telegram instead.

QR code