South Korea’s service sector output recorded 0% growth in January.
This was down from 1.1% in the previous period.
Service Sector Stalls In January
The recent data showing South Korea’s service sector output dropping to 0% in January is a significant warning sign. This stall from the previous 1.1% growth suggests a sharp loss of momentum in domestic demand. We should view this as a leading indicator of broader economic weakness for the first quarter of 2026.
Given this outlook, we should consider establishing bearish positions on the KOSPI 200 index. Buying put options offers a defined-risk way to profit from a potential downturn in the coming weeks. Shorting KOSPI 200 futures is a more direct approach for those anticipating a slide below key support levels.
This domestic weakness is compounded by recent statistics showing February’s semiconductor exports fell by 4.5%, signaling that external demand is also faltering. This dual pressure from both domestic and foreign headwinds makes a sustained rally in Korean equities unlikely. Selling out-of-the-money call spreads is an effective strategy to collect premium while betting on a stagnant or falling market.
The slowing economy will likely pressure the Bank of Korea to consider a more dovish stance, which is bearish for the won. We should look at long positions in USD/KRW futures or call options to speculate on KRW depreciation. We saw a similar pattern of won weakness back in mid-2024 when GDP growth first began to falter, creating a profitable currency trade.
This uncertainty should also drive up market volatility. The VKOSPI, South Korea’s volatility index, has already ticked up to 18.5 from a low of 14 just last month. Buying option straddles on the index could be profitable as traders begin to price in larger price swings ahead of the next batch of economic data.
Create your live VT Markets account and start trading now.
Start trading now – Click here to create your real VT Markets account
South Korea’s industrial output rose 7.1% year on year in January. This was above the forecast of 2.2%.
The 7.1% year-on-year industrial output figure for January is a significant beat against the 2.2% forecast. This blowout number suggests the underlying South Korean economy is running much hotter than we anticipated. We must now seriously question the bearish sentiment that lingered from the global trade slowdown we saw in mid-2025.
Semiconductor Led Upside
This strength is overwhelmingly driven by the semiconductor sector, where demand for AI-related memory chips continues to surge. Recent trade data for February 2026 showed chip exports expanding by over 60% from the previous year, confirming that January’s production number was not an anomaly. This trend solidifies the view that the tech cycle upswing is robust and has strong momentum.
Given this, we should consider establishing or increasing long positions on South Korean equities through derivatives. Call options on the KOSPI 200 index look particularly attractive as a way to capture upside with defined risk. This is a marked shift from our more cautious stance late last year when concerns about global consumer demand were paramount.
The surprising economic strength also has direct implications for the Korean Won. A robust economy typically leads to a stronger currency, so we should anticipate the KRW gaining against the USD. We can position for this by evaluating put options on the USD/KRW currency pair, betting on a decline in the pair’s value.
This data forces us to reconsider the Bank of Korea’s future actions. The probability of an interest rate cut in the first half of the year has now diminished substantially, a fact reflected in the recent rise of the 3-year government bond yield to 3.4%. Traders should adjust interest rate swap positions to reflect a more hawkish central bank outlook than previously priced in.
Global Demand Signal
As a key global exporter, South Korea’s manufacturing boom signals that global demand for high-tech goods is healthier than we thought. This strength is likely to have positive knock-on effects for other export-oriented economies, especially in the technology supply chain. We should monitor volatility indices, as such a strong upside surprise could lead to short-term market repricing.
Create your live VT Markets account and start trading now.
Start trading now – Click here to create your real VT Markets account
South Korea’s industrial output fell by 1.9% in January. This was below expectations for a 0.5% increase.
The release indicates output declined rather than rising as forecast. No further figures or breakdowns were provided in the update.
Industrial Output Drop Signals Regional Weakness
The sharp and unexpected drop in South Korea’s January industrial output is a major red flag for us. This isn’t just a minor miss; it signals a potential contraction in a key global manufacturing hub. We must now position for continued economic weakness out of the region in the first quarter of 2026.
This poor industrial data strongly suggests a weaker Korean Won, so we should consider shorting the KRW against the US dollar. Since the January data was released, the USD/KRW has already moved from 1340 to touch 1375, and the Bank of Korea is now unlikely to raise rates. We saw a similar pattern in late 2025 when weak export numbers preceded a 4% slide in the Won over the following month.
For equities, this points to downside risk for the KOSPI 200 index, which is heavily weighted with industrial exporters like Samsung Electronics and Hyundai. We should look at buying put options or shorting KOSPI futures to capitalize on this bearish sentiment. February’s preliminary trade data, released just this week, confirmed the trend with a year-over-year decline in exports for the first time in six months.
The contraction is particularly concerning for the global semiconductor market, as chip production is a core component of this data. Global semiconductor sales figures for January already showed a 2.2% month-over-month decline, and this news from a top producer suggests the slowdown is accelerating. Bearish positions on semiconductor ETFs could therefore be a profitable strategy.
Finally, this level of uncertainty means market volatility is likely to rise. We should consider buying call options on the VKOSPI, the volatility index tracking the Korean market. As of early March 2026, the index is trading near 18, which is historically low compared to the spikes above 25 we witnessed during periods of economic stress in 2025.
USD/JPY rose about 0.15% on Tuesday to near 157.60, extending last week’s rally. Since late January it has traded in a wide 152.00–159.00 range, after an early-February dip towards 153.00.
Conflict in the Middle East has weighed on the Yen after the Strait of Hormuz was effectively shut, a route carrying roughly 20% of the world’s oil. Higher energy prices have hit Japan, which is almost fully dependent on imported fuel.
Policy Signals And Intervention Watch
Finance Minister Satsuki Katayama said officials are watching the Yen’s fall “with a strong sense of urgency” and are coordinating with the US, leaving intervention as an option. At the Bank of Japan, Hajime Takata again called for rate rises, and Kazuo Ueda said the March and April meetings are “live”, while board nominations and reports of caution have clouded timing.
In the US, the Federal Reserve held rates at 3.50% to 3.75% in January, and minutes showed some discussed further rises if inflation stays above target. Demand for the Dollar as a safer asset has supported the currency and reduced expectations of near-term cuts.
Technically, the pair trades near 157.55, above the 50-day and 200-day EMAs, with resistance at 158.50 and 160.00, and support at 156.00, 155.50, and 154.00.
Looking back to early 2025, we saw the market grappling with USD/JPY pushing towards 158, driven by Middle East conflict and a hawkish Federal Reserve. That environment has now reversed, creating a different set of opportunities for the coming weeks. The fundamental drivers that supported the dollar throughout last year have significantly weakened.
Shift In The Macro Backdrop
The geopolitical risk premium that pressured the yen has unwound since the diplomatic resolution in the Strait of Hormuz in the third quarter of 2025. Consequently, oil prices, which spiked to over $100 per barrel during that period, have since stabilized and now average around $78, easing Japan’s import costs. This removes a key headwind for the yen that was prominent this time last year.
The Bank of Japan has also shifted from talk to action, delivering two small rate hikes in the second half of 2025 to bring the policy rate to 0.25%. With Tokyo’s core inflation for February coming in at a persistent 2.5%, the market is now pricing in a more aggressive tightening path than previously expected. This monetary policy convergence is the most important factor now providing strength to the yen.
Meanwhile, the Federal Reserve has pivoted from its firm stance in early 2025, initiating a rate-cutting cycle in November after US jobless claims rose for three straight months. Fed funds futures are currently pricing in an 80% chance of another 25-basis-point cut this month as the US economy shows clear signs of slowing. This growing interest rate differential in favor of the yen puts sustained downward pressure on the USD/JPY pair.
Given this backdrop, we should treat any strength in USD/JPY as an opportunity to establish bearish positions. Buying out-of-the-money puts with expiries in the second quarter allows for positioning for a potential move towards the 142 level. This strategy offers a defined-risk way to capitalize on the shifting fundamental landscape we are now witnessing.
Create your live VT Markets account and start trading now.
Start trading now – Click here to create your real VT Markets account
Oil prices rose as escalating US-Israel strikes on Iran disrupted Middle East energy infrastructure.
Tanker attacks and continued closure of the Strait of Hormuz are tightening supply expectations.
Iraq has already cut nearly half its oil production due to export disruptions.
US naval escort proposals may stabilise shipping routes but have yet to restore market confidence.
Oil prices moved higher on Wednesday as escalating military conflict between the United States, Israel and Iran disrupted energy flows across the Middle East.
Brent crude rose about 1.4% to $82.53 per barrel after closing at its highest level since January 2025 in the previous session. US West Texas Intermediate climbed to around $75.37, marking its strongest settlement since June.
The latest price gains reflect growing concern that regional supply disruptions may intensify if the conflict continues to damage production and export infrastructure.
Export Routes Under Pressure
The Strait of Hormuz remains the central pressure point for global energy markets.
Iranian forces have targeted tankers passing through the waterway, effectively halting traffic for a fourth consecutive day. Roughly one-fifth of the world’s oil and liquefied natural gas flows through the Strait, making even temporary disruption highly significant for global supply chains.
Major oil storage sites in Saudi Arabia are filling rapidly as the key export route through the Strait of Hormuz effectively remains closed to shipping, according to geospatial analytics company Kayrros https://t.co/iSuwomH8XU
The conflict has already forced producers and shipping operators to reassess logistics across the region.
Iraq Cuts Output as Export Channels Close
Iraq, the second-largest crude producer in OPEC, has reduced output by roughly 1.5 million barrels per day due to limited storage capacity and blocked export routes.
Officials warned that if exports do not resume soon, nearly 3 million barrels per day of production could be shut down entirely within days.
Such a reduction would represent a substantial tightening of global supply, particularly at a time when geopolitical risk is already elevated.
Washington has also directed the US International Development Finance Corporation to provide political risk insurance and financial guarantees for maritime shipping in the Gulf.
While these measures may help reduce shipping risks, market participants remain cautious. Ship owners and analysts have questioned whether military protection alone will be sufficient to restore confidence.
Technical Analysis
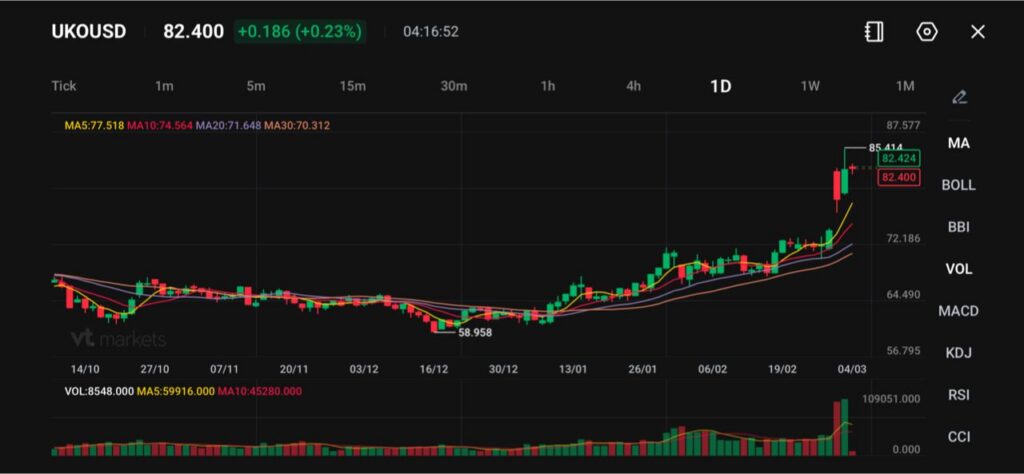
Oil prices remain elevated, with UKOUSD (Brent Crude) trading near $82.40, holding close to recent highs after a strong rally from the December low around $58.96. The broader daily structure shows a clear bullish trend, supported by a sequence of higher highs and higher lows since the start of the year.
Momentum indicators reinforce the upward bias. The 5-day moving average (77.52) and 10-day (74.56) are sharply rising, while the 20-day (71.65) and 30-day (70.31) remain well below current price levels and continue to trend higher. This wide separation between price and the longer-term averages reflects strong bullish momentum following the recent breakout above the $80 psychological level.
Immediate resistance is located near $85.40, where the latest rally stalled. A decisive break above this zone could extend the move toward $87.50. On the downside, initial support sits around $80.00–$81.00, followed by stronger structural support near $75.00–$77.00, where the short-term moving averages are clustered. As long as prices remain above the $80 region, the near-term outlook remains constructive, though the recent sharp rally may leave room for short-term consolidation before the next directional move.
Global Buyers Seek Alternative Supply
With uncertainty surrounding Middle East shipping routes, major energy-importing countries have begun exploring alternative supply options. India and Indonesia are seeking replacement cargoes, while some Chinese refineries have either reduced operations or brought forward maintenance schedules.
Meanwhile, Saudi Arabia’s Aramco is reportedly attempting to reroute certain exports through the Red Sea to bypass the Strait of Hormuz.
These adjustments illustrate the scale of disruption currently affecting global energy logistics.
Learn more about trading Energies on VT Markets here.
Frequently Asked Questions
Why are oil prices rising? Oil prices are increasing due to supply disruptions linked to escalating conflict between the United States, Israel and Iran. Attacks on energy infrastructure and shipping routes have raised concerns about global supply availability.
Why is the Strait of Hormuz so important for oil markets? The Strait of Hormuz handles roughly 20% of global oil and liquefied natural gas shipments. Any disruption to traffic through the Strait can significantly affect global energy supply and prices.
How much production has Iraq already cut? Iraq has reduced output by around 1.5 million barrels per day due to storage constraints and blocked export routes. Officials warn that production could fall further if exports do not resume.
Could US naval escorts reopen shipping routes? US naval escorts may help protect tankers and restore shipping confidence. However, analysts remain uncertain whether military protection alone will be enough to fully normalise traffic.
How are global buyers responding to the disruption? Several countries are seeking alternative supply sources. India and Indonesia are exploring new import routes, while some Chinese refineries are adjusting operations due to supply uncertainty.
Start trading now – Click here to create your real VT Markets account
China’s Two Sessions start in Beijing and cover the annual week-long meeting of the Chinese Parliament and the Chinese People’s Political Consultative Conference. The meetings set China’s political priorities and macroeconomic targets.
A new five-year plan running until 2030 is due to be published. The macro targets are linked to the Yuan exchange rate.
Key Targets In Focus
The main targets in focus are economic growth and new debt. Provincial growth goals, when weighted by economic size, point to a national target of 5%, slightly lower than last year.
New debt last year is estimated at around 9% of GDP, compared with an official figure of 4%. The plan may also include wording or targets related to internationalisation of the RMB.
As we enter the new political cycle, it’s useful to look back at the targets set during last year’s Two Sessions in 2025. The key themes then were achieving around 5% growth, managing high levels of hidden debt, and pushing for the international use of the RMB. These same factors continue to shape the trading landscape today.
Last year’s growth target was largely met, with China’s official 2025 GDP coming in at 5.2%, but the focus now is on current momentum. Recent data shows the Caixin General Manufacturing PMI for February 2026 registered 50.9, indicating a slight expansion in factory activity for the fourth straight month. This suggests some underlying stability, which could keep downside risks for equity-linked derivatives, like options on the FTSE China A50 index, in check for the near term.
Trading Implications And Positioning
The significant gap between official and true new debt, which we estimated was around 9% of GDP in 2025, remains a primary concern. This underlying leverage continues to weigh on investor sentiment and could cause sharp, unpredictable swings in the market. Traders should consider strategies that protect against sudden downturns in Chinese equities, as any official action on local government debt could trigger volatility.
For currency traders, the push for RMB internationalization that was a focus in 2025 has yielded tangible results, with the yuan’s share of global payments via SWIFT reaching 4.61% in January 2026. This policy goal means authorities have a strong incentive to prevent sharp depreciation of the currency. The People’s Bank of China continues to set a strong daily reference rate for the yuan, keeping the USD/CNY pair in a tightly managed range around 7.20.
This creates a split environment where the government’s actions are suppressing currency volatility while debt issues could fuel stock market volatility. Therefore, strategies that bet on a stable yuan, such as selling short-dated USD/CNY volatility, may be attractive. In contrast, the ongoing economic balancing act means traders should remain prepared for potential shifts in equity markets.
Create your live VT Markets account and start trading now.
Start trading now – Click here to create your real VT Markets account
United States total vehicle sales reached 15.8 million in February. This was above the forecast of 15.2 million.
The difference between actual sales and the forecast was 0.6 million. The figures indicate sales exceeded expectations for the month.
Implications For Consumer Strength
The strong February vehicle sales data suggests the US consumer is more resilient than we anticipated. This strength in a major sector of the economy forces us to reconsider the timing of expected interest rate cuts. The market may now have to price in a more delayed easing cycle from the Federal Reserve.
This report challenges the narrative of a cooling economy that many held throughout 2025. Given that recent Core CPI data has remained sticky around 2.9%, this consumer strength adds weight to the Fed’s “higher for longer” stance. We’ve seen fed funds futures react immediately, with the probability of a rate cut by June 2026 dropping from over 60% to below 40% overnight.
For equity derivatives, we should look for upside in automakers and their suppliers. Call options on names like General Motors and Ford, as well as on ETFs like CARZ, are becoming more attractive as earnings estimates will likely be revised higher. Implied volatility in these stocks is expected to rise, reflecting the uncertainty around future demand and financing costs.
This data is particularly notable when we look at inventory levels, which have stabilized after the supply chain issues we saw back in 2024 and early 2025. Automakers now have more pricing power than forecasted just a few months ago. This could also signal strength in related sectors, such as auto lenders and parts manufacturers.
Rates Strategy Adjustments
We should adjust interest rate positions accordingly, possibly by selling short-term Treasury futures to hedge against a more hawkish Fed. The economic strength shown here means the central bank has little reason to rush into cutting rates. The market had been too optimistic on the timing of a policy pivot.
Create your live VT Markets account and start trading now.
Start trading now – Click here to create your real VT Markets account
Indonesia’s February CPI rose to 4.76% year-on-year, up from 3.55% in January and above Bank Indonesia’s target range. On a monthly basis, CPI increased 0.68%, after a 0.15% fall in the prior month.
The rise was linked to base effects from electricity tariffs, higher gold prices, and food demand ahead of Ramadan. Food inflation was 4.01% year-on-year in February and has stayed above 3% since July 2025.
Drivers Behind The Inflation Spike
Inflation is expected to ease as base effects fade, and the recent drivers were described as non-structural. The report stated these factors are unlikely to change Bank Indonesia’s interest-rate stance.
Upside risks were tied to military action involving Iran and the Middle East and its impact on energy prices. A revised Brent crude assumption of about 15% on average over the next three quarters was estimated to add around 0.32 percentage points to overall inflation.
On that basis, inflation for 2026 was put at about 2.8–2.9%, within Bank Indonesia’s target range but nearer the upper end.
We see that February’s inflation number came in hot at 4.76%, which is well outside Bank Indonesia’s target range of 1.5-3.5%. However, we believe this spike is temporary, driven by one-off base effects and pre-Ramadan food price increases. Consequently, derivative traders should not price in an imminent interest rate hike from the central bank.
Potential Trades And Key Signals
The main risk to the Indonesian Rupiah is not domestic policy but global energy prices. With Brent crude recently hitting $95 per barrel after the latest flare-up in the Middle East, the pressure on the IDR will mount. We should consider buying call options on USD/IDR, as this provides a cheap way to profit from potential Rupiah weakness in the coming weeks.
This environment of uncertainty is perfect for volatility plays. Implied volatility on USD/IDR options is likely to rise as traders weigh the temporary domestic inflation against the very real external oil shock. This suggests strategies that benefit from a large price move, such as buying straddles, could be profitable.
Looking back, we saw food inflation running consistently hot since the middle of 2025, so this is a persistent issue that oil prices will only worsen. A direct hedge or speculative position would involve going long on Brent crude futures or options. This aligns with the view that oil could climb another 15% over the next few quarters.
While we anticipate Bank Indonesia will hold rates steady for now, sustained high oil prices could force their hand later in the year. Therefore, traders should monitor forward rate agreements for the third and fourth quarters of 2026. Any sign that the market is beginning to price in a future hike would be a key signal to adjust positions.
Create your live VT Markets account and start trading now.
Start trading now – Click here to create your real VT Markets account
New Zealand’s terms of trade index rose by 3.7% in the fourth quarter. This was above the forecast of a 0.7% fall.
The terms of trade index measures the ratio of export prices to import prices. The 3.7% result indicates an increase in this ratio for the quarter.
Terms Of Trade Surprise Lifts Outlook
The surprise jump in New Zealand’s fourth-quarter 2025 terms of trade, hitting 3.7% against a forecast drop, is a clear bullish signal for the economy. This indicates we are receiving significantly more for our exports relative to what we are paying for imports. Traders should view this as a direct positive for the New Zealand dollar and reassess short positions.
This robust economic data makes it much harder for the Reserve Bank of New Zealand to consider cutting interest rates anytime soon. With inflation data from late 2025 still showing a stubborn 4.5% annual rate, well above the target band, this report adds pressure for a “higher for longer” stance. We should anticipate interest rate futures to price out any lingering expectations of a rate cut before the third quarter of this year.
The strength appears driven by a recovery in key export prices, particularly in dairy, where recent Global Dairy Trade auctions in February 2026 have shown price increases of over 5%. Looking back at similar periods in 2024, a rising terms of trade directly preceded a period of NZD outperformance against the Australian dollar. This makes long NZD/AUD positions, possibly through call options to limit risk, a logical strategy over the coming weeks.
Given the magnitude of this economic surprise, we expect implied volatility on NZD options to rise. The forecast miss is one of the largest we have seen since the post-pandemic recovery period of 2023-2024. This presents an opportunity for traders to sell downside protection, such as out-of-the-money NZD/USD put options, to collect richer premiums while aligning with the bullish fundamental outlook.
EUR/USD fell in the North American session and traded at 1.1618, down 0.63%. It touched a daily low of 1.1530 before rebounding.
Rising Middle East tensions supported a safe-haven bid for the US Dollar. A report that Donald Trump ordered the DFC to provide political risk insurance and guarantees for maritime trade, especially energy through the Persian Gulf, pushed oil prices lower and lifted the euro.
Market Drivers And Safe Haven Flows
Trump also said the US Navy could escort tankers through the Strait of Hormuz. The US Dollar Index (DXY) was up 0.50% at 99.04.
There was no major US data, but Fed officials spoke. John Williams said policy is “well positioned” and later rate cuts could be appropriate, while Jeffrey Schmid and Neel Kashkari said inflation remains too high and the neutral rate may be higher.
Eurozone inflation rose in February but stayed below the 2% goal. HICP increased to 1.9% year on year from 1.7%, while underlying HICP rose to 2.4% from 2.2%.
EUR/USD fell below the 200-day SMA at 1.1664, with RSI turning bearish. Resistance levels are 1.1664, 1.1668, 1.1700, and 1.1773; support is 1.1600, 1.1576, 1.1530, and 1.1500.
Looking back at the sharp swings of 2025, we see a familiar pattern where geopolitical events create a flight to the US dollar. That dip to 1.1530 and subsequent rebound on a single political announcement serves as a key reminder of how headline risk can override economic data. Traders should position for similar volatility, as the underlying tension between inflation data and geopolitical safety-seeking remains.
Positioning And Volatility Outlook
The focus on the Strait of Hormuz last year has since shifted, but the core issue of maritime trade security persists. We are now seeing disruptions in the Red Sea, which have caused container shipping rates to more than double since December 2025, according to the Drewry World Container Index. This continues to support the US dollar as a safe-haven currency, suggesting that any EUR/USD strength may be short-lived.
In the Eurozone, inflation remains a central concern, much like it was back in 2025. The latest flash estimate for February 2026 showed Harmonized Index of Consumer Prices (HICP) at 2.5%, which is down slightly but still stubbornly above the ECB’s 2% target. This puts the ECB in a difficult position, limiting its ability to cut rates and creating uncertainty that options traders can capitalize on.
Similarly, the Federal Reserve continues to signal a hawkish stance, echoing the warnings we heard from officials like Jeffrey Schmid last year. With the latest US Consumer Price Index data for January 2026 showing inflation at 3.1%, market expectations for aggressive rate cuts have been significantly scaled back. This fundamental strength for the dollar suggests that selling rallies in EUR/USD could be a viable strategy in the coming weeks.
Given this backdrop, we should anticipate continued choppiness, making long options strategies attractive. Implied volatility on EUR/USD options, as measured by the Cboe EuroCurrency Volatility Index (EVZ), has ticked up to 8.2, reflecting the market’s nervousness. Buying straddles or strangles ahead of upcoming central bank meetings or inflation data releases could prove profitable, regardless of the direction the pair moves.
From a technical standpoint, the pair is trading well below the levels seen in 2025 and is currently finding resistance near the 1.0900 level. We are seeing significant open interest build up in put options with a 1.0750 strike for the April expiry, indicating that many traders are positioning for a potential downward move. Therefore, using this 1.0900 level to initiate bearish positions or buy protective puts could be a prudent approach for the near term.
Create your live VT Markets account and start trading now.
Start trading now – Click here to create your real VT Markets account