Bank of Japan Executive Director Koji Nakamura said it is appropriate to reduce bond buying in a predictable way. He said a new bond taper plan will be prepared for the June policy meeting.
Nakamura said he will listen to the views of various market participants when compiling the plan. He said the bond taper so far has helped improve market functioning, while the Bank of Japan’s presence in the bond market remains large.
Bond Taper Signals
At the time of writing, USD/JPY was 0.08% lower on the day at 157.55.
We recall those statements from mid-2025 signalling a slow, predictable bond taper, which set the stage for the current environment. That cautious process has led us to where we are now, with the Bank of Japan having raised its policy rate to 0.15% in two small increments. The USD/JPY has since moved from those highs above 157 and is now trading near 148.20.
The Bank’s gradual tightening continues to put upward pressure on government bond yields, with the 10-year JGB yield recently hitting 1.10%. Derivative traders are positioning for this trend to continue by shorting JGB futures contracts, anticipating a further rise in yields toward 1.25% this year. This activity reflects market consensus that at least one more rate hike is coming before year-end.
This uncertainty around the pace of future policy moves is increasing currency market volatility. One-month implied volatility for USD/JPY options has climbed to 9.5% in recent weeks, up from an average of 7.8% in the fourth quarter of 2025. We believe strategies like buying option straddles are attractive, as they can profit from a large price swing in either direction.
The key driver for the Bank of Japan remains domestic inflation, which is proving persistent. With the latest national core CPI data holding firm at 2.2%, the pressure to act more decisively is building on policymakers. A higher-than-expected inflation report in the coming weeks could easily accelerate the timeline for the next rate hike.
Carry Trade Unwind Risk
The risk of a disorderly unwind of the historic yen carry trade remains a primary concern for us. While the initial unwind in late 2025 was managed well, a surprise hawkish turn from the Bank could trigger a rapid appreciation in the yen. For this reason, holding some out-of-the-money USD/JPY put options is a sensible hedge against a sudden shift in policy.
Create your live VT Markets account and start trading now.
Start trading now – Click here to create your real VT Markets account
Written on March 10, 2026 at 11:59 am, by josephine
Germany’s seasonally adjusted trade balance was €21.2 billion in January. The result was above the expected €15.2 billion.
This means Germany’s trade surplus in January was €6.0 billion higher than forecast. The figure compares actual net exports with market expectations for the month.
Implications For The German Economy
Germany’s strong January trade data is a significant bullish signal for its economy. It suggests that global demand for German goods is robust, which could be a turning point after the industrial slowdown we saw in 2025. This fundamental strength should provide a solid floor for the Euro in the near term.
This report is supported by other recent figures, like the flash manufacturing PMI for February which rose to 51.2, its highest level in over a year. This confirmation of an industrial recovery makes long positions in DAX index futures look attractive. Key German exporters in the automotive and machinery sectors are likely to see improved earnings forecasts.
The data also has implications for the European Central Bank’s interest rate policy. With Eurozone inflation remaining slightly above target at 2.4% last month, this economic strength reduces the pressure on the ECB to cut rates anytime soon. This policy divergence from the US Federal Reserve, which is signaling potential cuts, should further support the euro against the dollar.
Looking back, we remember how weak industrial production figures plagued Germany for much of the second half of 2025. The current trade surplus is the largest we have seen since late 2024, indicating a decisive shift in economic momentum. We should therefore consider selling out-of-the-money put options on the Euro Stoxx 50 to collect premium, betting that this positive trend will prevent a sharp market downturn.
Trading Strategy Considerations
While the outlook is positive, we must be mindful of the strong US jobs report from last week, which has kept the US dollar firm. This could create some resistance for the EUR/USD pair around the 1.10 level. Therefore, a strategy of buying EUR/USD call spreads may be prudent, as it defines risk while positioning for a gradual upward move in the currency pair.
Create your live VT Markets account and start trading now.
Start trading now – Click here to create your real VT Markets account
Written on March 10, 2026 at 11:58 am, by josephine
Germany’s imports fell by 5.9% month on month in January. The previous month recorded a 1.4% rise.
The latest figure shows a move from growth to decline. The month-on-month change measures imports compared with the prior month.
German Demand Signal
This sharp drop in German imports signals a significant cooling of domestic demand, a concerning indicator for Europe’s largest economy. We should interpret this as a leading sign of a broader Eurozone slowdown in the first quarter of 2026. This data point strongly suggests that economic activity is contracting faster than many had anticipated.
Given this weakness, we see a clear divergence trade against the stronger U.S. economy, where the latest Non-Farm Payrolls report added a robust 250,000 jobs. This reinforces the case for a weaker Euro relative to the dollar. Therefore, derivative traders should consider establishing short positions on EUR/USD futures or buying put options on the Euro.
The data also spells trouble for German corporate earnings, making the DAX index look vulnerable. The latest HCOB Flash Germany Composite PMI for February already fell to 47.8, and this import data confirms the negative trend. We believe buying DAX put options is a prudent way to position for a potential correction in German equities over the coming weeks.
This economic fragility increases the likelihood of a more dovish European Central Bank. Recent Eurostat data showing February’s flash inflation at 1.9%, below forecasts, further supports the view that the next ECB move will be a rate cut. Consequently, going long on German Bund futures is an attractive trade, as bond prices will rise if the central bank signals easier monetary policy.
We observed a similar pattern in the third quarter of 2025, when a brief industrial slowdown led to a significant flight to quality into German government debt. The current environment feels reminiscent of that period, suggesting a similar market reaction is likely. Traders should prepare for this rotation out of riskier assets and into perceived safe havens.
Volatility And Hedging
Overall uncertainty in the Eurozone is clearly rising, which should lead to higher market volatility. We can expect the VSTOXX index, which measures Euro Stoxx 50 volatility, to climb from its current low levels. Buying VSTOXX call options or futures could be an effective hedge or a direct bet on increasing market turbulence.
Create your live VT Markets account and start trading now.
Start trading now – Click here to create your real VT Markets account
Written on March 10, 2026 at 11:58 am, by josephine
Middle East conflict affects the US economy through higher oil prices, weaker household portfolios, and rising uncertainty. These can raise inflation, lift yields via expectations, and reduce output through a negative supply shock.
Market volatility can lower consumer wealth and curb spending, while higher fuel costs can cut real incomes. Unstable conditions can also delay business planning, investment, hiring, and other decisions.
Shifting Rate Cut Expectations
Before the outbreak of hostilities, markets priced in just over two US Federal Reserve rate cuts by year-end. Since then, pricing has moved to well under two cuts, pointing to less dovish expectations.
The Federal Reserve is also dealing with sticky inflation and waning labour demand. BNY expects three rate cuts this year.
The ongoing conflict in the Middle East is creating a negative supply shock for the U.S. economy. We see this hitting through higher oil prices, which are currently keeping Brent crude futures hovering around $98 a barrel, and through general market uncertainty. This situation complicates the path forward for interest rates.
The Federal Reserve faces a dilemma between persistent inflation and slowing growth. The latest Consumer Price Index report for February showed inflation remains stubborn at 3.1%, leading many in the market to scale back rate cut expectations. In fact, Fed funds futures now imply only a 40% chance of a second rate cut by December.
Trading Hedges And Volatility
However, we believe the focus should be on the weakening labor market, which will ultimately force the Fed’s hand. The most recent jobs report showed a gain of only 150,000 nonfarm payrolls, missing forecasts, while the unemployment rate ticked up to 4.1%. We are therefore maintaining our view that three rate cuts are likely this year, contrary to current market pricing.
For derivatives traders, this sets up an opportunity in interest rate futures. Options on SOFR futures that would profit from a drop in rates later this year appear mispriced relative to our outlook. Positioning for a steeper decline in the forward curve than the market currently anticipates could be a favorable strategy in the coming weeks.
The broad economic uncertainty also suggests higher volatility ahead. The Cboe Volatility Index (VIX), which saw lows near 12 back in 2025, has been establishing a higher base recently. Traders should consider buying VIX calls or call spreads as a hedge against a sudden market downturn triggered by geopolitical events or a surprisingly weak economic report.
In the energy sector, the elevated oil prices create a two-way risk. A sudden de-escalation could send prices tumbling, while a wider conflict could cause another major spike. Using options strategies like straddles on oil ETFs can allow traders to profit from a large price move in either direction while keeping risk defined.
Create your live VT Markets account and start trading now.
Start trading now – Click here to create your real VT Markets account
Written on March 10, 2026 at 9:04 am, by josephine
Chinese exports rose by nearly 40% year on year in February. Imports also increased, but more slowly than exports, which lifted the trade surplus.
Over the past 12 months, China’s trade surplus reached about 6.2% of GDP. The combined January–February surplus was also reported at about 6.2% of GDP.
Currency Moves And Trade Balance
The CNY appreciated slightly against the US dollar in the first two months of the year. The CNY also rose only slightly against the euro over the same period.
Exports to the United States fell by 11%. Exports to the EU increased by over 27%, despite the modest rise in the CNY.
The article states it was produced with the help of an AI tool and reviewed by an editor.
We are looking back at the exceptionally strong Chinese export data from early 2025, when year-on-year growth for February approached 40%. This performance created a massive trade surplus, equivalent to about 6.2% of GDP over the preceding 12 months. The key takeaway from that period was the export sector’s strength, even as the CNY firmed slightly against the dollar and euro.
Implications For Traders In 2026
This contrasts sharply with the situation now in the first quarter of 2026. Recent data shows China’s official manufacturing PMI for February 2026 came in at 49.9, failing to show the robust expansion we saw a year ago. This softening suggests the export momentum from 2025 has not carried over, creating uncertainty for the coming weeks.
Given this divergence, traders should re-evaluate currency positions on the Chinese Yuan. While the CNY’s slight appreciation in early 2025 did not hinder trade, the current weaker economic pulse means authorities may resist further strengthening to support exports. We see this in the USD/CNY exchange rate, which has stabilized near 7.28, implying that options strategies betting on the yuan remaining in a tight range could be prudent.
The significant shift in trade from the US to the EU seen in 2025 makes European indices particularly sensitive to China’s current slowdown. While exports to the EU surged by over 27% back then, the current weakness in Chinese demand could disproportionately affect German industrial stocks. This may warrant considering put options on the DAX index as a hedge against a potential drop in European exports.
This weaker manufacturing outlook is also weighing on industrial commodity markets. Last year’s boom supported strong prices, but as of March 2026, copper prices have retreated over 3% from their recent highs amid concerns over Chinese demand. Traders should monitor inventory levels closely, as any further builds could signal opportunities to short commodity futures.
The dynamic between the Eurozone and China has become more complex. In 2025, the CNY remained stable against the euro, but now, with the European Central Bank still signaling caution over inflation figures that remain above its 2% target, monetary policies are diverging. This could introduce greater volatility to the EUR/CNY pair, making long volatility strategies like straddles attractive.
Create your live VT Markets account and start trading now.
Start trading now – Click here to create your real VT Markets account
Written on March 10, 2026 at 9:04 am, by josephine
Brent crude saw sharp price moves, rising towards $120 in early Asian trading before ending the US session below $90. Drivers cited included Saudi supply shut-ins, G7 plans for a coordinated stockpile release, and possible US policy steps.
Each day the Strait of Hormuz remains closed, global inventories are estimated to fall by 10–15m barrels. With 700m barrels available outside strategic petroleum reserves at the end of February, this implies depletion in 35 to 70 days.
G7 Stockpile Release And US Policy Options
A coordinated G7 stockpile release was announced but delayed until the following day, which was estimated to add around 30 days to the depletion timeline. Separate reports said the US was considering suspending US oil exports, waiving the Jones Act for fuel cabotage, and/or cutting petrol taxes for US consumers.
The scenario described includes potential effects on how oil is priced in currencies, and on pricing in other asset markets. The article notes it was produced using an AI tool and reviewed by an editor.
We just witnessed mind-blowing volatility in oil, with Brent crude rocketing towards $120 before crashing below $90 in a single session. This was triggered by major Saudi supply disruptions and the ongoing closure of the Strait of Hormuz. For traders, this extreme range signals that outright directional bets are incredibly risky without protection.
The core issue is the supply countdown we are now facing. With the Strait closed, we are drawing down global inventories by 10 to 15 million barrels every single day. Current estimates from early March 2026 show about 700 million barrels in commercial storage, giving us a window of only 35 to 70 days before a physical shortage hits.
Market Positioning And Risk Management
In response, the G7 nations have announced a coordinated release from their strategic petroleum reserves. This action is expected to add about a 30-day buffer to the countdown, pushing the potential depletion date out. However, traders should view this as a temporary fix, not a solution to the underlying geopolitical crisis shutting down a key global chokepoint.
The severity of this situation is clear when you look at the numbers. The Strait of Hormuz normally handles about 21 million barrels of oil per day, representing roughly 20% of global daily consumption. A prolonged shutdown is unprecedented in the modern era and makes past supply disruptions, like the drone attacks in 2025, look minor by comparison.
Adding to the uncertainty are potential policy moves from the United States to lower domestic prices. We are hearing talk of suspending US crude exports or wavering the Jones Act, which would add complexity and unpredictable price pressures. These measures, while aimed at consumers, would introduce fresh volatility for derivative markets to price in.
Given this backdrop, options strategies are paramount for managing risk over the next few weeks. The CBOE Crude Oil Volatility Index (OVX) has surged to levels not seen since 2022, making options expensive but necessary. Traders should consider buying puts to protect against a sudden diplomatic resolution or bearish policy news, while call options offer a way to capitalize if the crisis deepens.
This is no longer just about the price of oil, but also about the currency it is priced in. A crisis of this magnitude could have profound effects on the US dollar and the currencies of major oil exporters. We need to watch for signs of stress in currency markets as an indicator of how the broader financial system is handling this shock.
Create your live VT Markets account and start trading now.
Start trading now – Click here to create your real VT Markets account
Written on March 10, 2026 at 9:02 am, by josephine
EUR/USD fell to about 1.1615 in early European trade on Tuesday, near 1.1600. Worries about possible oil flow disruption through the Strait of Hormuz supported the US Dollar as a safe-haven.
Iran’s Islamic Revolutionary Guard Corps said Tehran will decide when the war ends, not the US. It warned that continued US and Israeli attacks could lead Iran to block regional oil exports.
Strait Of Hormuz Risk Drives Safe Haven Demand
US President Donald Trump said late Monday that if Iran stops oil flows through the Strait of Hormuz, the US would respond with strikes. Higher oil prices have raised concerns about inflation and policy rates.
Reduced expectations for US Federal Reserve rate cuts have provided further support for the US Dollar. Traders are awaiting US February Consumer Price Index data for new direction.
The headline CPI is forecast at 2.4% year on year in February, while core CPI is forecast at 2.5%. The story was corrected on March 10 at 06:40 GMT to state the CPI focus is later on Wednesday, not Tuesday.
Given the current geopolitical climate, the pattern we observed around this time in 2025 is re-emerging, where tensions in the Middle East directly strengthen the US dollar. Threats to oil flows through the Strait of Hormuz create a flight to safety, and the dollar remains the ultimate safe-haven asset. We should anticipate this dynamic to pressure currency pairs like the EUR/USD in the coming weeks.
Oil Inflation And Fed Cut Expectations
This situation complicates the path for the Federal Reserve, much as it did last year. Rising oil prices feed inflation, which reduces the likelihood of near-term interest rate cuts. We saw a similar scenario play out following the onset of the conflict in Ukraine in 2022, when Brent crude spiked over $120 a barrel, contributing to inflation that the Fed aggressively hiked rates to contain.
The Euro is particularly vulnerable here because the Eurozone is a net energy importer, making it more sensitive to oil price shocks than the United States. During the initial shock of the 2022 conflict, the EUR/USD pair fell sharply from over 1.13 to below 1.10 in just a few weeks. The drop to the 1.1600 level we saw in 2025 reflects this same fundamental weakness during a crisis.
For derivative traders, this environment suggests positioning for a stronger dollar and higher currency volatility. Buying put options on the EUR/USD provides a direct way to profit from a decline while limiting risk to the premium paid. Historically, periods of high geopolitical stress see volatility indexes, like the CBOE’s EVZ for the Euro, spike, making long volatility strategies attractive.
Hedging existing long Euro positions with puts is also a prudent defensive maneuver. For those looking for a more capital-efficient bullish dollar trade, a bull call spread on the U.S. Dollar Index (DXY) can be effective. This strategy allows us to bet on a rise in the dollar while defining our maximum risk and lowering the upfront cost compared to an outright long call.
The upcoming Consumer Price Index data will be a critical inflection point, just as it was in 2025. Last quarter’s core CPI miss of just 0.1% triggered a 70-point swing in the DXY within an hour, showing how sensitive the market is to inflation surprises right now. A higher-than-expected inflation number would likely reinforce the strong dollar trend by pushing back expectations for Fed rate cuts even further.
Create your live VT Markets account and start trading now.
Start trading now – Click here to create your real VT Markets account
Written on March 10, 2026 at 9:02 am, by josephine
EUR/JPY eased to about 183.20 in early European trade on Tuesday, slipping below 183.50 as the Japanese Yen strengthened on safe-haven demand linked to escalating conflict in the Middle East.
Uncertainty over the Bank of Japan rate path may limit further Yen gains. Reuters reported that while some analysts expected a March hike, many now see the BoJ holding rates until at least April or July after Governor Kazuo Ueda pointed to possible economic effects from the Middle East conflict.
Daily Chart Technical Picture
On the daily chart, the pair remains mildly bullish because it is holding above the rising 100-day EMA. The RSI has moved back towards 50 from overbought levels, suggesting weakening upside momentum rather than a reversal.
Support is seen at 182.90, then around 181.30 where the 100-day EMA aligns, with 180.00 next if that area breaks. Resistance stands at 184.85 and then 185.70, near the upper Bollinger Band.
The Yen’s value is driven by Japan’s economic performance, BoJ policy, yield differences between Japanese and US bonds, and risk sentiment. The BoJ’s ultra-loose policy from 2013 to 2024 weakened the Yen, while gradual policy unwinding in 2024 has offered some support.
We see that the safe-haven demand for the Yen, which was a key concern due to Middle East tensions in early 2025, has since faded into the background. As of today, March 10, 2026, the market’s focus has shifted decisively back to the slow pace of policy normalization by the Bank of Japan. This has allowed the EUR/JPY to grind higher over the past year, recently trading near 188.50.
BoJ Policy And Options Implications
The uncertainty we noted around the Bank of Japan’s interest rate path last year has resolved into a clear, cautious approach. After delivering two minor rate hikes in mid-2025, the BoJ has held its policy rate at 0.25%, as core inflation in Tokyo for February 2026 came in at a softer-than-expected 1.8%. This suggests Governor Ueda will not be rushed, creating an environment where selling JPY volatility through options could be a prudent strategy.
From a technical standpoint, the support levels we watched near 181.30 in 2025 have long since become a distant floor. With the cross now well above its rising 100-week moving average, a strategy of selling out-of-the-money EUR/JPY put options could allow traders to collect premium while benefiting from the pair’s slow, upward drift. This aligns with the fundamental picture of a hesitant BoJ.
The yield differential story remains central, but the dynamics have shifted since last year. While the BoJ has tightened modestly, the European Central Bank is now signaling a potential easing cycle as the latest Eurozone Q4 2025 GDP growth was revised down to just 0.1%. This divergence cap may limit explosive upside, making strategies like call spreads attractive for capturing measured gains while defining risk against a dovish turn from the ECB.
Create your live VT Markets account and start trading now.
Start trading now – Click here to create your real VT Markets account
Written on March 10, 2026 at 9:01 am, by josephine
WTI crude rose back above $88.00 in Asian trading on Tuesday after reversing from its highest level since June 2022. The Middle East war and the closure of the Strait of Hormuz have raised fears of reduced global fuel supply.
The IEA is reportedly discussing a coordinated release of emergency oil reserves among member countries. The Trump administration announced a $20 billion reinsurance programme to support shipping in the Strait of Hormuz.
Technical Outlook And Momentum
Technically, Monday’s fall held above the 200-hour EMA near $78.85. The MACD moved up towards the zero line and the histogram contracted, pointing to weaker bearish momentum.
The RSI rose to 45.33 from oversold levels. Support sits at $86.85, then $84.70, with $83.00 as a further downside level.
Resistance is seen at $89.00 and $91.00, with $96.80 as a higher target if $91.00 breaks. The broader uptrend remains in place after a pullback from the $112 area.
WTI is a US-sourced benchmark oil traded via the Cushing hub. API and EIA inventory reports can move prices; their results are within 1% of each other 75% of the time, and the EIA data is treated as more reliable. OPEC has 12 members, and OPEC+ adds 10 more.
March 2026 Market Backdrop
We are seeing a very different market in March 2026 than what we experienced during the turmoil of last year. The 2025 conflict in the Middle East and the closure of the Strait of Hormuz sent WTI prices soaring past $110, but the market has since settled into a new, higher range. Currently, WTI is trading with more stability around the $95 per barrel mark, suggesting a persistent risk premium is now built into the price.
Global supply remains a key concern and supports the current price levels, even after government interventions in 2025 like the IEA reserve release. Last week’s Energy Information Administration report on March 4, 2026, showed a modest inventory draw of 1.8 million barrels, signaling that demand continues to absorb available supply. Furthermore, OPEC+ has signaled it will maintain its current production quotas through the second quarter, providing a solid floor for prices.
For derivative traders, this means implied volatility is much lower than the peaks of 2025, but it remains elevated above pre-crisis levels. This makes strategies that benefit from collecting premium, such as selling out-of-the-money puts with strike prices below the $90 support level, an attractive option. However, we must remain aware that any renewed tension in the Middle East could cause volatility to spike quickly.
The cautious bullish bias from last year still holds, but the strategy should now focus on this new price range. We believe using call spreads is a prudent way to position for a gradual move towards the $100-$105 resistance area later this year. For example, buying a June 2026 $98 call while selling a June 2026 $105 call can offer upside exposure with a defined cost and risk.
Create your live VT Markets account and start trading now.
Start trading now – Click here to create your real VT Markets account
Written on March 10, 2026 at 9:01 am, by josephine
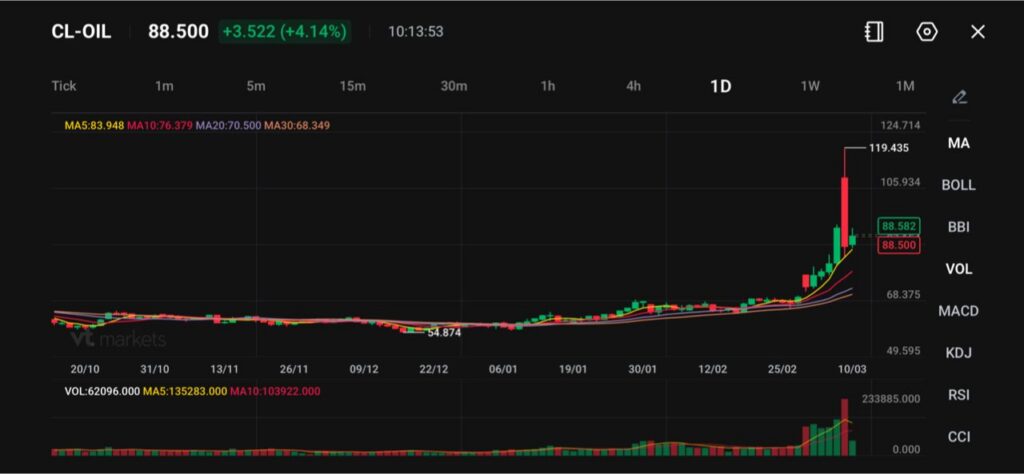
CL-OIL trades at 88.500, up +3.522 (+4.14%), with MA5 83.948, MA10 76.379, MA20 70.500, MA30 68.349 and a recent spike marker near 119.435.
Trump said the war was ahead of schedule and “very much complete”, which eased risk pricing, while traders also weighed strategic reserve releases and potential relief on Russia oil sanctions.
Tanker traffic through the Strait of Hormuz remains the key proof point, after Reuters data showed daily transits dropped to zero from 37 just before the conflict escalated.
Oil Trades Headlines, But The Strait Sets The Floor
Markets welcomed President Trump’s signal that the war against Iran was ahead of schedule and “very much complete”. That kind of language usually pulls air out of the risk premium because traders stop pricing a worst-case supply outage as the base case.
President Trump is expected to review a set of options to tame oil prices, which have spiked to more than $100 a barrel due to the Iran war, according to two people familiar with the matter https://t.co/0ru8Tw76pypic.twitter.com/Hjsa8BljaX
Our research desk pointed to two policy levers that can cool pricing pressure: a strategic reserve release and the prospect of easing oil-related sanctions on Russia.
Still, the oil market does not clear on speeches alone. It clears on flows. Reuters’ shipping analysis showed the number of daily tankers passing through Hormuz fell to zero as of Wednesday from 37 on Friday, February 27. Until that number rises in a steady pattern, traders will keep paying for supply anxiety even if they also trade de-escalation headlines.
If tanker transits stay near zero or remain patchy, crude can stay volatile and hold a supply-risk premium. If shipping resumes at scale and stays stable for several sessions, oil can retrace faster than many expect because the market has already priced extreme disruption risk.
Supply Relief Options Shift The Risk Premium
Analytical framing matters because it reflects how policymakers can lean on the market. A strategic reserve release can add prompt barrels and calm panic bids. The market has already started to debate that path, but Reuters reporting says G7 finance ministers discussed the issue and saw broad agreement not to release reserves immediately, while stressing they stand ready to act if needed.
On Russia, Reuters reporting says the Trump administration has reviewed options that include easing sanctions on Russian oil as part of a wider package to curb spiking prices. That can change sentiment because it offers a substitute supply valve if Middle East flows stay constrained.
Trump's administration is considering reducing oil sanctions on Russia to help cool a surge in global energy prices triggered by the US and Israeli war on Iran, with an announcement possible as soon as March 9, according to three sources familiar with the planning…
If officials announce clear, credible supply relief such as targeted sanctions exemptions or a coordinated reserve release, oil can soften even without perfect shipping conditions. If policymakers only signal readiness without action, traders may keep buying dips because the physical risk still dominates.
Technical Analysis
WTI crude oil (CL-OIL) is trading near $88.50, up around 4.14%, as prices attempt to stabilise after the extraordinary spike that pushed the market to a high near $119.43.
The recent surge marked an aggressive breakout driven by supply shock dynamics, but the sharp rejection from the highs suggests the market is now entering a phase of volatility and price discovery.
From a technical perspective, oil remains well above its key moving averages despite the pullback. The 5-day moving average (83.95) and 10-day (76.38) are rising steeply, while the 20-day (70.50) and 30-day (68.35) remain far below current price levels.
This wide separation reflects the intensity of the recent rally and confirms that the broader trend remains strongly bullish, even as prices retrace part of the spike.
In the near term, $95–$100 now represents the first major resistance zone following the rejection from the $119 peak. A move back above $100 would suggest renewed bullish momentum and could reopen the path toward the $110–$120 region.
On the downside, immediate support appears around $85–$88, followed by stronger structural support near $80, which aligns with the recent breakout area before the surge.
Overall, oil markets remain highly volatile but structurally bullish, with the sharp correction likely reflecting profit-taking after the historic rally. As long as prices hold above the $80–$85 region, the broader upward trend remains intact, though short-term consolidation may persist as the market absorbs the recent shock.
What Traders Should Watch Next
Evidence that Hormuz traffic recovers from zero daily transits toward pre-shock flow levels, because that decides whether the move stays a supply event or fades into a risk premium unwind.
Any confirmed policy action on strategic reserves after the G7 decision to wait, because timing will matter as much as volume.
Any formal move on Russia oil sanctions relief, because even a targeted exemption can shift how traders price forward supply.
Learn more about trading Energies on VT Markets here.
FAQs
Why Did Oil Pull Back After the Earlier Spike? Markets reacted to President Trump saying the war against Iran was ahead of schedule and “very much complete”, which reduced the immediate risk premium. Danske Bank also flagged two extra relief levers: a possible easing of oil-related sanctions on Russia and the release of strategic reserves.
Does “Very Much Complete” Mean Oil Risk is Over? Not yet. Even with calmer messaging, traders still need proof that physical flows normalise. Danske Bank said it wants more definitive signs that traffic picks up through the Strait of Hormuz again. Without that, the market can reprice higher on any fresh shipping or security headline.
What is the Market Watching in the Strait of Hormuz Right Now? It is watching the shipping flow and insurance conditions. If tanker traffic remains thin, supply risk stays elevated even if leaders claim the operation is finishing. If traffic restarts in size, the risk premium can fade faster.
How Do Strategic Reserves Affect Oil Prices? Strategic reserve releases can add near-term barrels and calm panic bids. They work best when the problem is a short-term supply fear. They work less well if the issue becomes a persistent logistics blockage, because barrels still need safe routes and functioning distribution.
How Would Easing Russia Oil Sanctions Move the Market? Easing sanctions can increase available supply or improve routing flexibility. Traders treat that as a bearish input for oil, because it can help offset Middle East disruption risk. The market will still demand clarity on timing, volumes, and enforcement before it prices a lasting impact.
Start trading now – Click here to create your real VT Markets account
Written on March 10, 2026 at 9:01 am, by josephine