USD/CHF rose for a second day on Wednesday, gaining nearly 0.45% after bouncing from the 100-day SMA just above 0.7900. It was trading at 0.7915, with the US Dollar supported by geopolitical uncertainty.
The pair has mostly moved sideways due to a lack of a clear catalyst linked to the Middle East war. In the past two days, it has pushed towards the 200-day SMA at 0.7946, which is acting as resistance on the route to 0.8000.
Upward Momentum Building
The RSI is above 50 and moving towards overbought territory, pointing to stronger upward momentum. A break above 0.7946 would put focus on 0.8000, and then the YTD high at 0.8040.
If 0.8040 is cleared, the next resistance level is the 5 November swing high at 0.8124.
Looking back at the analysis from late 2025, we saw how buyers were targeting the 200-day moving average after bouncing from 0.7900. That bullish momentum did carry through, eventually pushing the pair past the 0.8124 resistance level in early 2026. The geopolitical drivers mentioned at the time provided a strong tailwind for the US Dollar.
As of today, March 26, 2026, the fundamental picture has shifted to central bank policy divergence. The Swiss National Bank executed a surprise 25 basis point interest rate cut last week, weakening the franc as they become the first major central bank to ease policy. This contrasts sharply with the US, where recent inflation data came in at a stubborn 2.8%, suggesting the Federal Reserve will hold rates steady for longer.
Strategy And Key Levels
This policy gap suggests we should be positioning for further USD/CHF strength in the coming weeks. Buying call options with an expiration in late April or May provides a way to capture this expected upward move with a defined risk. With current implied volatility around 7.2%, strikes around the 0.8350 level appear attractive for a potential test of the year-to-date highs.
The key technical level to watch is the support around 0.8210, which has held firm since the SNB’s announcement. As long as we remain above this floor, the path of least resistance is higher. A sustained break above 0.8290 would be our signal that the next leg of the rally is underway.
Create your live VT Markets account and start trading now.
Start trading now – Click here to create your real VT Markets account
Written on March 26, 2026 at 3:58 am, by josephine
Indonesia’s onshore markets are due to reopen after the long Lebaran break amid uncertain geopolitics and volatile global sentiment. Trading in IDR assets is expected to be cautious in this environment.
Global markets have swung between upbeat and downbeat moods as there are brief pauses in hostilities followed by conflicting statements from key actors. This has kept risk sentiment unstable.
Local authorities are reported to be considering risk mitigation steps in response to higher energy costs and supply shortages. Measures mentioned in local press include work-from-home policies, curbs on non-essential vehicle and transport use, and hybrid school sessions to conserve fuel.
The report points to rising inflation pressures and possible budget reallocations and efficiency measures. It also says higher risks to price stability and greater financial market volatility may reduce the scope for further monetary easing in Indonesia this year.
The article states it was created with the help of an Artificial Intelligence tool and reviewed by an editor.
We are seeing a familiar pattern of cautious trading in Indonesian assets as we head into the second quarter of 2026, reminiscent of the post-Lebaran volatility we observed back in 2025. The Rupiah has been trading nervously, recently testing the 16,100 per dollar level amid ongoing tensions in the South China Sea. This environment suggests that trading will be cautious for the near future.
Given this backdrop, we should consider strategies that benefit from either Rupiah weakness or increased volatility. Purchasing call options on the USD/IDR pair offers a defined-risk way to position for further currency depreciation. This is particularly relevant for contracts expiring in the next 30 to 60 days to capture this near-term uncertainty.
Rising price pressures are a significant concern, with February’s inflation data hitting 3.8% year-on-year, driven largely by energy and food costs. This makes further monetary easing from Bank Indonesia highly unlikely, a sentiment they reinforced in their last meeting. This suggests positioning for a stable or rising short-term interest rate environment using interest rate swaps could be a prudent hedge.
The combination of a hawkish central bank and external risks will likely weigh on the Jakarta Composite Index (JCI). We see value in protective strategies, such as buying put options on the JCI or establishing bearish put spreads. This approach allows us to hedge existing equity exposure or speculate on a market downturn with limited risk.
Start trading now – Click here to create your real VT Markets account
Written on March 26, 2026 at 2:59 am, by josephine
Markets moved on reports of possible ceasefire talks, which first eased tensions. Uncertainty returned after Iran signalled reluctance to engage with the United States.
The US Dollar Index (DXY) rose to near 99.50, just below 100, supported by rate gaps and earlier safe-haven demand. EUR/USD fell towards 1.1570 after weak Eurozone PMI data, and GBP/USD slipped towards 1.3370 amid UK growth and inflation concerns.
Dollar Strength And Risk Sentiment
USD/JPY climbed to about 159.30 on higher US yields and policy divergence between the Federal Reserve and the Bank of Japan. AUD/USD dropped to around 0.6960 as the stronger US dollar and risk mood limited gains.
WTI crude edged up to about $90.30 a barrel, then eased from recent highs as ceasefire hopes reduced near-term supply fears. Gold rose towards $4,550, helped by lower yields and reduced oil-led inflation concerns, while geopolitical risks stayed in focus.
Upcoming data includes Germany GfK Consumer Confidence (Apr), Eurozone GDP (Q4), the Bundesbank monthly report, US initial jobless claims, and New Zealand ANZ–Roy Morgan confidence (Mar). Friday brings UK consumer confidence, UK retail sales, Eurozone HICP (prelim), and US Michigan sentiment and inflation expectations.
WTI is a US crude benchmark sold via the Cushing hub. Prices are driven by supply and demand, geopolitics, sanctions, OPEC quotas, the US dollar, and weekly API and EIA inventory reports, which are within 1% of each other 75% of the time.
Positioning Themes Across Major Assets
The current market jitters, driven by fragile ceasefire talks, are keeping the US Dollar strong. We see the Dollar Index (DXY) pushing towards the 100 mark, a level it hasn’t consistently held since early 2025, suggesting a flight to safety is the dominant play. This safe-haven demand is likely to persist, making long dollar positions attractive against weaker currencies.
Given the weak Eurozone PMI data from earlier in the week, we expect continued pressure on the EUR/USD. The final Q4 2025 GDP figures for the Eurozone, which came in at a sluggish 0.2%, support our view that the European Central Bank will be slow to match the Fed’s stance. This creates a clear case for considering puts on the Euro or shorting the pair, targeting moves below the 1.1550 level.
The policy divergence between the Fed and the Bank of Japan remains the most powerful force driving USD/JPY, which is now above 159. This trend has been profitable since it broke through the 152 barrier back in 2024, and with no signs of the BoJ abandoning its ultra-loose policy, the carry trade is still compelling. We should anticipate continued upward momentum as long as US yields remain elevated.
Oil is caught between geopolitical hope and fundamental tightness, keeping WTI around $90 per barrel. While ceasefire talks could temporarily lower prices, we note that the latest EIA report from last week showed a surprise crude inventory draw of 1.8 million barrels. This suggests underlying demand is robust, creating a solid floor for prices and making dips a potential buying opportunity for call options.
The surge in Gold to $4,550 is remarkable and reflects a multi-year trend of de-dollarization and central bank accumulation we observed throughout 2025. This isn’t just about the latest geopolitical flare-up; it’s a structural shift, as central banks globally increased their gold reserves by over 800 tonnes last year alone. This underlying bid means gold remains a core holding, and any pullback should be viewed as an opportunity to add to long positions.
Create your live VT Markets account and start trading now.
Start trading now – Click here to create your real VT Markets account
Written on March 26, 2026 at 2:59 am, by josephine
Gold (XAU/USD) rose nearly 2% on Wednesday and was trading at $4,556. Oil futures fell on reports of possible US–Iran talks to end a conflict that began nearly four weeks ago.
The US sent Iran a 15-point proposal, with talks potentially starting as early as Thursday in Pakistan or Turkey. Iranian media said the proposal was rejected, while other sources said Iran would respond later on Wednesday.
Dollar Yields And Gold
The US Dollar Index (DXY) rose nearly 0.40% to 99.55. US 10-year Treasury yields fell four basis points to 4.328%, supporting gold.
A weak US two-year Treasury auction pushed the 2-year yield towards 3.936%. US import prices rose 1.3% in February, the biggest rise since March 2022, versus forecasts of 0.5%, after January’s 0.2% increase.
Markets removed expectations of 2026 Federal Reserve rate cuts and priced in 4 basis points of tightening. Thursday’s calendar includes US Initial Jobless Claims for the week ending 21 March and speeches by Cook, Miran, Jefferson, Logan, and Barr.
Technically, gold is range-bound between the 100- and 200-day SMAs, with support near the 200-day SMA at $4,083. Levels include $4,592, $4,600, $4,961, $4,500, $4,305, and $4,098.
Conflicting Forces For Bullion
The market is currently pulled in two directions, creating a tense setup for gold. The possibility of peace talks between the US and Iran is putting pressure on gold’s safe-haven status, while sticky inflation is providing strong underlying support. This conflicting environment suggests that volatility could be the main trade in the coming weeks.
We see that stubborn inflation remains the key issue, with February’s US import prices showing the largest jump since March 2022. Recent CPI data for February 2026 confirmed this trend, coming in hotter than expected at 3.5% and fueling speculation that the fight against inflation is far from over. Consequently, traders have completely priced out any Fed rate cuts for 2026 and are now anticipating further tightening.
The sharp drop in oil prices is directly linked to the hope for de-escalation, which temporarily improves risk appetite and acts as a headwind for bullion. However, we must remember that Iran has not officially agreed to any proposal, meaning any negative headline could cause both oil and gold to reverse course sharply. This makes holding outright short positions on gold particularly risky.
Looking back at 2025, we saw a similar pattern where geopolitical tensions would fade, but the persistent theme of central bank buying provided a solid floor for gold prices. This trend continues, as central banks in emerging markets added significantly to their reserves in the last quarter of 2025, supporting the idea that dips will be bought. This historical action creates a strong argument against expecting a major price collapse.
Given that gold is trading in a range between its key 100-day and 200-day moving averages, strategies that benefit from this sideways action are attractive. Traders could consider selling options volatility through strategies like iron condors, defining the expected range between roughly $4,100 and $4,600. A decisive break of these levels would be a signal to close out such positions and follow the new trend.
This week’s speeches from several Fed officials will be critical for the market’s direction. Given the recent inflation numbers, we should be prepared for hawkish commentary that could boost the US Dollar. A stronger dollar might push gold down to test its recent low around the $4,305 level.
Create your live VT Markets account and start trading now.
Start trading now – Click here to create your real VT Markets account
Written on March 26, 2026 at 2:58 am, by josephine
USD/JPY rose for a second day on Wednesday after bouncing from the 20-day SMA near 158.24 on Monday. It traded at 159.27, up 0.36%, but stayed below the weekly high of 159.65 set on Monday.
Technical signals suggest a short-term retest of the weekly highs. The RSI points to ongoing upward momentum, while possible Japanese FX intervention could limit moves towards 160.00.
Technical Levels And Near Term Bias
If the pair falls, support sits at the 20-day SMA at 158.24. A break below that may bring the March 19 daily low at 157.51 into view, with the 50-day SMA near 156.56 as the next support.
Further weakness would put focus on the 100-day SMA at 156.26. The next level below that is 156.00.
We see the USD/JPY pressing against the 159.65 resistance level, with bullish momentum suggesting another test is likely. However, the primary factor for traders is the looming threat of intervention from Japanese authorities as we approach the 160.00 milestone. This creates a tense standoff where technical trends are fighting against fundamental government risk.
The upward pressure is understandable given recent economic data. February’s US Core PCE inflation report came in at 2.9%, higher than anticipated, which keeps the Federal Reserve from cutting rates and supports a strong dollar. Meanwhile, the Bank of Japan has held its policy steady but has increased its verbal warnings against rapid yen depreciation, creating a clear policy divergence that fuels the currency pair’s climb.
Intervention Risk And Options Positioning
We must remember the sharp interventions that occurred back in the spring of 2024 when the pair crossed the 160.00 mark. On at least two occasions, the currency fell by several yen within hours, wiping out long positions that were not properly hedged. This history shows that Japanese officials are willing to act decisively, and traders should expect similar volatility if that key level is breached again.
Given this environment, implied volatility for USD/JPY options is elevated, with the JYVIX index trading near 11.5. This suggests that buying a straddle, which involves purchasing both a call and a put option at the same strike price, could be a prudent strategy. This position profits from a large price movement in either direction, capitalizing on the breakout or the potential intervention-driven collapse.
For those with a directional bias, a bull call spread could be used to target a move toward 160.00 while capping risk if intervention occurs. Conversely, buying puts outright remains the most direct way to profit from a potential sharp downturn triggered by official action. These puts could provide a substantial payout given the speed at which the pair has fallen during past interventions.
The key downside levels to watch are the 20-day SMA at 158.24 and the recent low of 157.51. A breach of these supports, especially on high volume, could be the first sign that an intervention has taken place or that the market is finally reversing. These levels are critical for setting strike prices on bearish option strategies or for placing stop-losses on any bullish positions.
Create your live VT Markets account and start trading now.
Start trading now – Click here to create your real VT Markets account
Written on March 26, 2026 at 2:58 am, by josephine
Societe Generale’s Kunal Kundu said India’s new GDP series shows weaker past growth and softer domestic demand than earlier data. The revised series also points to a lower level of overall activity.
The revision suggests real GDP growth was overstated by about 2 percentage points. It also indicates that real GDP and consumption were overstated in the earlier series.
New Series And Growth Reality
The new series aligns more closely with high-frequency indicators and labour market surveys. It also supports the view that the post-pandemic recovery has faced limits to growth.
The updated data shows a negative manufacturing sector deflator in several periods, including when inflation was rising. This points to weak domestic demand conditions across those spans.
The analysis refers to structural constraints and stress on household balance sheets. It also says the September 2025 GST rate cut offers limited support for overall demand.
The new GDP series confirms what we have been arguing for some time: the Indian economy’s recovery has hit a structural wall. With prior growth and domestic demand now shown to be significantly overstated, we must expect a major downward repricing of Indian assets. The market has been operating under a false narrative, and this correction will likely be swift.
Trade Ideas And Market Positioning
Given this fundamental reassessment, we should consider buying put options on broad market indices like the Nifty 50 for the coming weeks. The data’s revelation of weak manufacturing demand is supported by the latest Index of Industrial Production (IIP) figures from January 2026, which showed a disappointing 1.2% year-on-year growth. This indicates the underlying economic engine is sputtering far more than previously believed.
We should also anticipate a sharp rise in market volatility as investors digest the nearly 2 percentage point downward revision in historical growth. Buying India VIX futures or call options provides a direct way to profit from the coming uncertainty. Looking back, we saw a similar spike in the VIX during the growth scare in late 2025, and this official data confirmation could trigger an even stronger move.
The report’s focus on weak domestic demand and household stress signals a clear bearish stance on consumer-facing sectors. We should establish short positions, perhaps through put options on major auto and consumer discretionary stocks. The ineffectiveness of the September 2025 GST rate cut, which failed to meaningfully boost consumption in the fourth quarter of last year, was a clear early warning of this deeper problem.
This weaker economic outlook will inevitably weigh on the Indian Rupee as foreign capital re-evaluates its exposure. We anticipate further depreciation, especially as the USD/INR pair has already broken above the 84.50 level this month. Going long on USD/INR futures contracts is a logical strategy to hedge against, and profit from, potential capital outflows.
The Reserve Bank of India is now in a difficult position, as the latest CPI inflation data for February 2026 remains stubbornly high at 5.4%. This stagflationary mix of weak growth and persistent inflation kills any prospect of monetary easing in the near term. With no rate cuts on the horizon to support the market, the path of least resistance for equities is down.
Create your live VT Markets account and start trading now.
Start trading now – Click here to create your real VT Markets account
Written on March 26, 2026 at 2:00 am, by josephine
NZD/USD fell for a second day, trading near 0.5820 on Wednesday and down 0.22%. The move followed a stronger US Dollar, helped by a risk-off tone in markets.
Middle East tensions increased demand for safe-haven assets. Talks between the US and Iran remained uncertain, with recent events pointing to no quick agreement.
Drivers Behind The Move
The US Dollar also gained support from expectations that the Federal Reserve may stay hawkish. Inflation worries, linked in part to higher energy prices, led markets to price in higher US interest rates.
New Zealand’s outlook stayed weak. RBNZ Chief Economist Paul Conway said spare capacity will affect how the bank responds to inflation pressures from higher oil prices.
Fitch Ratings revised New Zealand’s sovereign outlook to negative. It cited risks tied to the Middle East conflict and New Zealand’s reliance on energy imports, adding pressure on the NZD.
Looking back at the situation in late 2025, we saw the NZD/USD pair under significant pressure around 0.5820 due to Middle East tensions and a hawkish Federal Reserve. That downward momentum largely played out as the interest rate differential between the US and New Zealand widened. The analysis from that time correctly identified the key drivers for the pair’s weakness.
Strategy Implications For Traders
The Federal Reserve did indeed prove more resolute than many expected, with US inflation remaining sticky above target, currently at 2.8% for February 2026. While the Fed has initiated its cutting cycle, the Fed Funds Rate at 4.75% remains elevated, providing ongoing support for the US Dollar. This contrasts with the Reserve Bank of New Zealand, which began cutting rates earlier and now holds its Official Cash Rate at 5.00%.
This policy divergence helped push NZD/USD to lows near 0.5600 earlier this year, though we have since seen a recovery to around 0.5950. The Fitch downgrade in 2025 proved prescient as New Zealand’s economy entered a technical recession, from which it is only now showing early signs of recovery. For traders, this means the environment has shifted from one of clear directional momentum to a more range-bound reality.
Given that the major rate policy moves may now be priced in, implied volatility has been falling. The Cboe NZD/USD 3-month volatility index has dropped to 8.5% from the highs of over 12% we saw in late 2025. This suggests that strategies involving selling options to collect premium could now be more favorable than outright directional bets.
Therefore, traders should consider selling strangles or straddles, betting on the pair remaining within a defined range as the economic picture in both nations slowly stabilizes. This is a shift from the previous environment where buying puts or holding short futures positions was the more obvious trade. The reduced volatility and clearer central bank paths make premium collection an attractive strategy in the coming weeks.
Create your live VT Markets account and start trading now.
Start trading now – Click here to create your real VT Markets account
Written on March 26, 2026 at 1:59 am, by josephine
USD/CAD rose on Wednesday for a third straight session as a stronger US Dollar kept the Canadian Dollar under pressure. The pair traded near 1.3806, its highest level since 22 January.
The US Dollar found support from rising Middle East tensions. Iran rejected a US-backed ceasefire proposal and dismissed Washington’s 15-point plan, saying any deal would be on its own terms.
Oil Price Volatility And Cad Sensitivity
Oil prices stayed volatile but remained above pre-conflict levels despite a pullback. Canada is a major crude exporter, so higher oil prices can support the Canadian Dollar, but US Dollar strength and risk aversion outweighed that effect.
Technically, USD/CAD gained momentum after breaking above the 50-day SMA at 1.3680 and moving through the 1.3700–1.3750 resistance zone. It also rose above the 100-day SMA at 1.3783, pointing to a more bullish near-term bias.
The RSI was 65, moving towards overbought territory. The MACD stayed above its Signal line with a positive histogram, showing continued buying pressure.
Resistance levels are 1.3850 and 1.3900. Support is the 1.3700–1.3750 zone, with the 100-day SMA as a key level.
Correction And Session Count
A correction noted that the move extended gains for a third session, not a second, as of 25 March at 18:15 GMT.
We remember looking at a similar setup back in March of 2025, when geopolitical risk pushed USD/CAD above 1.3800. While that rally was driven by safe-haven demand for the US dollar, the situation today is being shaped more by economic fundamentals. The core theme for the coming weeks will be the growing difference in monetary policy between the US and Canada.
The latest inflation data for February 2026 shows US CPI holding firm at 3.2%, while Canadian CPI has cooled to 2.8%. This gap suggests the Federal Reserve will likely keep interest rates higher for longer than the Bank of Canada. This policy divergence is creating a strong tailwind for the US dollar against the loonie.
For derivative traders, this outlook favors strategies that profit from a rising USD/CAD. We should consider buying call options to gain upside exposure with limited risk. A bull call spread, buying a lower-strike call and selling a higher-strike call, could also be used to reduce the initial cost of the trade.
Even with West Texas Intermediate crude oil prices staying strong around $81 a barrel, this is not providing the usual support for the Canadian dollar. Just as we saw in 2025, the powerful influence of interest rate expectations is currently outweighing the positive impact of high oil prices. This makes shorting USD/CAD, even with firm oil, a risky proposition.
Currently, the pair is testing resistance near the 1.3650 level, which corresponds with the 200-day moving average. A decisive break above this point would signal that the next leg up is beginning. This technical confirmation would be a key trigger for us to add to bullish positions.
Therefore, traders should watch for a sustained move above 1.3650 to initiate long positions. An effective strategy would be to buy May 2026 call options with a strike price of 1.3700 or 1.3800. This provides a clear path to profit if the expected policy-driven rally continues through the second quarter.
Create your live VT Markets account and start trading now.
Start trading now – Click here to create your real VT Markets account
Written on March 26, 2026 at 1:58 am, by josephine
At a European Parliament committee hearing on 18 March 2026, Claudia Buch, Chair of the ECB Supervisory Board, said there was no decline in bank asset quality and non-performing loan (NPL) ratios remained stable. NPL ratios are used as an indirect measure of the financial health of borrowing firms in the EU, especially in manufacturing.
Across most EU countries, manufacturing NPL ratios are at historically low levels. Countries with the highest ratios at the start of the period generally saw the sharpest falls.
Manufacturing Npl Trends Across The Eu
In most cases, manufacturing NPL ratios fell by more than half between Q2 2019 and Q4 2025. Where ratios rose over that time, the increases were generally modest.
The overall fall in manufacturing NPL ratios points to improved financial health in many EU countries. This suggests the sector may be better placed to absorb the 2026 energy shock linked to the war in Iran than it was at the start of the 2022 war in Ukraine.
Policy support is expected to be more limited due to budget constraints. Orders linked to defence, public infrastructure and AI may help reduce the impact on business bankruptcies and unemployment.
We are seeing European manufacturing corporations face this new energy shock from Iran from a position of relative strength. Following Claudia Buch’s comments on March 18, we know bank asset quality is stable, with non-performing loan (NPL) ratios for manufacturers having fallen by more than half by the end of 2025. However, with Brent crude futures now surging past $115 a barrel, this underlying health will be severely tested in the coming weeks.
Volatility And Hedging Trade Setups
This situation points towards a spike in market uncertainty, making long volatility positions attractive. The VSTOXX index, Europe’s main fear gauge, has already climbed to 28, and we should consider buying call options or futures on it, anticipating a move towards the levels over 40 seen during the 2022 shock. At the same time, this implies downside pressure on broad indices, making put options on the Euro Stoxx 50 a reasonable hedge against long equity portfolios.
The impact will not be uniform across sectors, creating opportunities for pair trades. We should look at buying put options on energy-intensive industrial ETFs, as the latest flash PMI data from March 24th already showed a dip to 45.2, citing energy costs. These short positions can be paired with call options on defence contractors like Rheinmetall, which continue to benefit from strong order books established through 2025.
Beyond equities, the credit markets may be underpricing the coming risk due to the historically low NPLs. We could consider buying protection through credit default swaps (CDS) on indices tracking lower-rated European corporate debt. A sustained energy price shock will inevitably strain balance sheets, regardless of their starting point.
Finally, this is a clear negative for the Euro, as the region is a net energy importer. The European Central Bank’s focus on inflation, as reiterated last week, limits its ability to soften the blow, reinforcing the case for a weaker currency. We should view any strength in the EUR/USD as an opportunity to initiate short positions.
Create your live VT Markets account and start trading now.
Start trading now – Click here to create your real VT Markets account
Written on March 26, 2026 at 1:58 am, by josephine
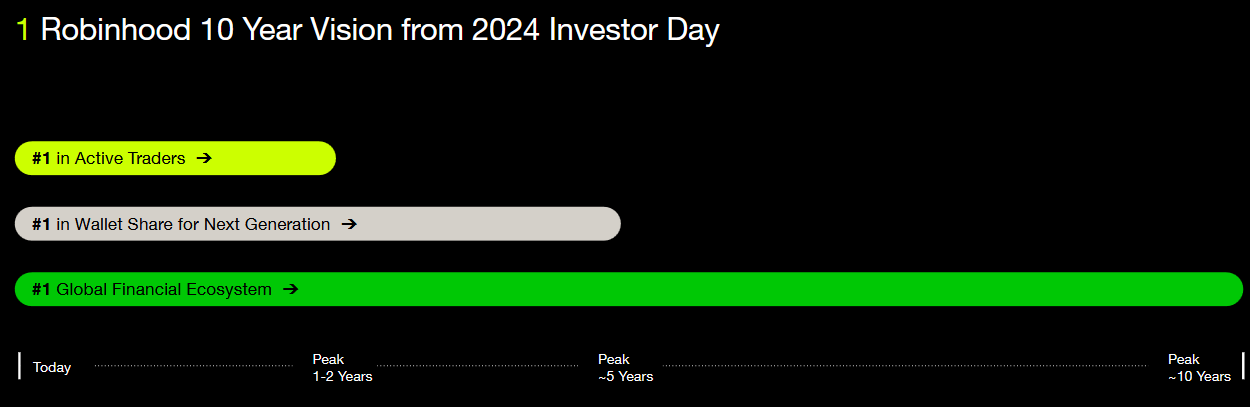
Robinhood is back in focus, but not for the reasons that first made it famous.
At a glance
– Robinhood is trying to expand from a retail trading app into a broader consumer-finance platform.
– Its product range now includes cards, cash tools, retirement products, managed investing, and private-market access.
– Users, assets, and deposits are growing, but revenue still depends heavily on trading activity, crypto cycles, and market sentiment.
– The investment case now rests on whether product expansion can lead to more stable and diversified earnings.
Robinhood is a US fintech platform best known for retail stock, options, and crypto trading.
But the announcement signals a larger purpose. Robinhood is no longer trying to be seen only as a trading app built for bursts of market activity. It is trying to establish itself as a broader financial platform that can hold more of a user’s money, attention, and financial behaviour over time.
Previously, Robinhood was seen as a symbol of meme-era retail trading. Now, the focus is shifting to whether it can retain users as they become more experienced, better funded, and less reliant on short-term speculation.
Find HOOD stock as a CFD Share on our platform today.
How Robinhood is changing beyond trading
Robinhood’s original appeal was straightforward. It lowered the barrier to market access and matched well with users who were comfortable taking risks, acting quickly, and participating in fast-moving themes.
That trading-led base still matters. Robinhood remains centred on self-directed retail activity across equities, options, and crypto. These are products that naturally attract active users and benefit from volatility, engagement, and risk appetite.
What has changed is the company’s effort to build around that base rather than rely on it alone.
That progression is important because it shows how management sees the business evolving.
Instead of focusing only on trading frequency, Robinhood is trying to capture a larger share of each user’s overall financial life.
Its expanding product set now includes:
cash management and spending tools
credit products, including premium cards
retirement accounts and longer-term investing features
managed portfolios
private-market exposure through retail-facing fund structures
This is not a move away from trading. It is a move to keep users inside the platform as their financial behaviour becomes more deliberate and more diversified.
How Robinhood fits Trader Behaviour
For a risk-aware audience, this shift is easier to understand when viewed through trader behaviour rather than product labels.
Many active traders do not stay in one financial mode forever. They often begin with shorter-term opportunities, build confidence through market participation, then gradually develop broader goals around cash management, capital preservation, diversification, and long-term allocation.
Robinhood’s strategy increasingly reflects that progression.
This is where Robinhood looks more credible than it did a few years ago. The company is no longer built only for the first phase of the customer journey. It is trying to remain useful as that same customer becomes more financially capable and more selective.
That also helps explain the move upmarket.
Reuters reported that Robinhood’s premium card strategy is aimed at higher-income users, reflecting an effort to move beyond its earlier speculative image as its customer base ages. The February filing for a planned $1 billion private investment fund IPO fits the same pattern. It is not really an institutional pivot. It is a retail-facing wrapper that allows ordinary investors to buy exposure to private-company stakes through a listed fund structure.
In other words, Robinhood is broadening its menu for the same broad retail audience, from newer traders to wealthier and more experienced users.
Why eyes are on HOOD stock
There are solid reasons why investors are taking this transition more seriously.
As of March 2026, Robinhood reported:
27M funded customers
$322B in platform assets
$68B in net deposits
These figures suggest more than app engagement. They show that Robinhood continues to gather assets and retain financial relevance even as the business broadens beyond trading alone.
The product mix is also becoming more coherent.
Trading may be the entry point, but newer services are designed to increase retention and make the platform useful across different financial needs. A customer who once used Robinhood for options or crypto can now also hold cash, use credit, contribute to retirement products, and explore managed or alternative exposure without leaving the ecosystem.
One of the more interesting additions is Robinhood Ventures Fund I (RVI). Unlike a debit card or cash feature, RVI, which debuted at $658.4 million, is a publicly traded closed-end fund designed to give retail investors access to a concentrated basket of private companies. Structurally, that makes it less of a payment feature than an access product. But it still says something important about where Robinhood is positioning itself in the financial sector.
By offering indirect exposure to private companies such as Stripe, Revolut, Ramp, and Databricks, Robinhood is expanding what retail users can do on the platform. Instead of waiting for high-profile fintech and infrastructure businesses to reach the public market, users can gain earlier exposure through a listed fund wrapper, placing the platform closer to where financial innovation is being built.
The larger significance is that Robinhood is not just serving users who want to trade what is already public. It is gradually widening access across different layers of the financial ecosystem, from liquid markets to private-company exposure. That makes the platform more relevant to users whose strategies, capital base, and time horizon are becoming more developed.
Robinhood’s past identity is still intact
Even with a broader product set, Robinhood’s earnings profile remains closely linked to market conditions.
A significant portion of revenue still depends on:
This matters because it shows that platform expansion has not yet fully changed the business model’s sensitivity to market activity.
Robinhood may be adding more stable-looking products around the edges, but the core earnings engine still responds strongly to cycles in participation, volatility, and speculative interest.
That is the restraint investors keep returning to. The company is broadening structurally, but the income statement still appears cyclical.
Why Traders are alert
For traders, Robinhood is not interesting only because of its products. It is interesting because the company itself reflects a style of market participation.
Robinhood grew by appealing to users who value access, speed, flexibility, and the ability to act on conviction quickly, aligning up with active CFD trading behaviour.
What is different now is that the business is trying to hold that user for longer. Instead of benefiting only from short-term activity, Robinhood wants to benefit as that same user matures, builds capital, and starts allocating across more financial needs.
That makes Robinhood more inviting for serious assessment than it was when it was mainly discussed through the lens of meme stocks and speculative bursts.
For a market-aware reader, the company now raises a broader question about platform quality:can a business that was built around active risk-taking grow into one that also supports longer-term financial habits without losing the energy that made it relevant in the first place?
Bull vs Bear: reading Robinhood today
Bull case
Bear case
Robinhood is expanding into a broader financial ecosystem beyond trading.
Revenue is still meaningfully tied to trading activity and crypto cycles.
Funded customers, platform assets, and net deposits continue to grow.
Recent results still showed sensitivity to expectations and activity fluctuations.
New products may increase wallet share, improve retention, and support a more mature customer base over time.
Newer products still need to prove they can scale and monetise consistently.
RVI shows Robinhood broadening retail access beyond public markets into private-company exposure.
Access products can widen the menu, but they do not automatically change earnings quality in the near term.
The $1.5 billion buyback signals confidence and capital maturity.
Valuation may remain volatile if growth slows or activity weakens.
A successful transition could support a re-rating toward a diversified fintech profile.
The market may continue to treat Robinhood as a cyclical trading platform until revenue becomes less market-dependent.
In simple terms, the bull case rests on platform maturity, accessibility, and retention.
If Robinhood can deepen wallet share and retain users across more stages of their financial lives, these layers begin to reinforce one another. Robinhood may look less like a trading app reacting to market bursts and more like a consumer-finance platform with a wider role in capital allocation.
The bear case is that this broader menu still sits on top of an earnings base that remains highly sensitive to trading volumes, crypto activity, and retail sentiment. Until the newer layers contribute more meaningfully and more consistently, the market may remain reluctant to reward the company with a steadier valuation framework.
From here, investors are likely to watch three things closely:
whether asset growth leads to more stable revenue streams
whether newer products gain enough scale to reduce earnings dependence on trading
whether Robinhood can retain users as they become more sophisticated, rather than losing them to more traditional platforms
Robinhood’s Coming-of-Age
Robinhood looks more credible today than it did in its meme-stock era. Its product range is broader, its customer base is larger, and management is clearly trying to grow wallet share rather than rely only on trading activity.
But the transition is not complete. The business is still exposed to trading volumes, crypto cycles, market sentiment, and retail participation, which means the re-rating case still needs firmer proof. The challenge is no longer product expansion by itself. It is whether those newer products can gradually reduce Robinhood’s dependence on trading-driven revenue.
Robinhood’s next phase will be judged less by headlines and more by whether it can turn platform expansion into steadier earnings, deeper customer relationships, and a more durable role in how users manage money.
We equip traders with the tools, insights, and execution capabilities to navigate these transformative shifts, helping you position ahead of major market developments. Join today.
Click here for Refresher!
What is Robinhood trying to become? Robinhood is trying to evolve from a retail trading app into a broader consumer-finance platform with products across trading, cash management, credit, retirement, managed investing, and private-market access.
Why is Robinhood still considered cyclical? Robinhood is still considered cyclical because a significant part of its revenue depends on trading activity, crypto sentiment, retail risk appetite, and overall market conditions.
Why does Robinhood’s buyback matter? The $1.5 billion buyback signals management confidence in the company’s capital position and long-term value, although it does not remove concerns about earnings volatility.
What is the bull case for Robinhood stock? The bull case is that Robinhood can grow wallet share, deepen product usage, and eventually be valued more like a diversified fintech platform rather than a trading-led business.
What is the bear case for Robinhood stock? The bear case is that Robinhood’s earnings remain heavily exposed to trading cycles, crypto activity, and market sentiment, which could keep the stock volatile if growth slows or activity declines.
Start trading now – Click here to create your real VT Markets account