Back

Week Ahead: Oil Puts Fed Cuts On Ice

Key Points

  • The Fed held rates at 3.50% to 3.75%, but the 8 to 4 vote split showed a deeper divide over inflation, growth, and the next policy move.
  • Oil remains the key macro variable as prices above $100 keep inflation expectations and rate-cut pricing under pressure.
  • The week’s main data risk sits with the RBA cash rate decision, US JOLTS job openings, and Friday’s US Non-Farm Payrolls report.
  • Technical setups still favour selective dollar weakness, gold strength, firm oil, and cautious risk appetite unless US labour data changes the Fed narrative.

Markets enter the new week with one question doing most of the heavy lifting: can the Fed cut rates if oil keeps inflation alive?

The Fed held rates at 3.50%-3.75%, but the real story was the split vote. An 8-to-4 division marked the most divided FOMC decision since 1992, showing that policymakers no longer agree cleanly on the next step. One side sees slowing growth and wants room to ease.

The other still sees inflation risk, especially with energy prices feeding into transport costs, goods prices, wages, and inflation expectations.

Higher Oil Keeps The Fed Boxed In

If oil stabilises, inflation can still ease later in the year. If oil stays above $100 or pushes higher, the Fed becomes boxed in. It cannot cut aggressively while energy-driven inflation threatens to move through the wider economy.

This is why Powell’s tone still holds weight. He described the US economy as resilient, with growth expected to stay above 2% this year, supported by consumer spending and data centre investment. That is not the language of a central bank racing to cut. It sounds more like a late-cycle economy where growth still holds up, but inflation refuses to fade cleanly.

The market impact is clear. Strong growth reduces the urgency for cuts. Sticky inflation reduces the room for cuts. Higher oil reduces the Fed’s freedom further. That mix supports the “higher for longer” trade and keeps bond yields, the dollar, gold, oil, and equities vulnerable to sharper moves.

The labour market now has to carry a lot of weight. Friday’s US Non-Farm Payrolls report is forecast at 60K, down from 178K, while unemployment is expected to hold at 4.3%. A soft jobs print could revive rate-cut bets, but only if wage and inflation signals do not look too sticky. A stronger print would give the Fed more reason to wait.

Australia returns to the spotlight this week. The RBA cash rate decision comes with markets watching for a move from 4.10% to 4.35%, as inflation concerns remain in focus. For AUDUSD, the reaction may depend on whether the RBA confirms a more restrictive path or sounds more cautious about growth risks.

Markets may stay volatile rather than directional. Oil needs to cool before risk assets get cleaner upside air. Until then, the Fed remains boxed in, the dollar may stay choppy, gold can stay supported on dips, and equities may need strong earnings or softer labour data to extend gains.

Key Symbols to Watch

  • USDX
  • XAUUSD
  • USOil
  • SP500
  • BTCUSD
  • USDJPY

Key Events of the Week

DateCurrencyEventForecastPreviousAnalyst Remarks
Tue, May 05AUDCash Rate4.35%4.10%A hawkish RBA can support AUDUSD near key bullish zones.
Tue, May 05USDJOLTS Job Openings6.87M6.88MLabour demand will shape the next Fed rate-cut debate.
Fri, May 08USDNon-Farm Employment Change60K178KPayrolls can reset USDX, XAUUSD, and SP500 direction.
Fri, May 08USDUnemployment Rate4.30%4.30%A higher rate may revive Fed rate-cut expectations.

Next week’s data calendar also matters, with US CPI y/y due on 12 May, US PPI m/m on 13 May, GBP GDP m/m on 14 May, and US Retail Sales m/m on 14 May. These releases could decide whether markets treat oil as a temporary inflation shock or a larger policy problem.

For a full view of upcoming economic events, check out VT Markets’ Economic Calendar.

Key Movements Of The Week

USDX

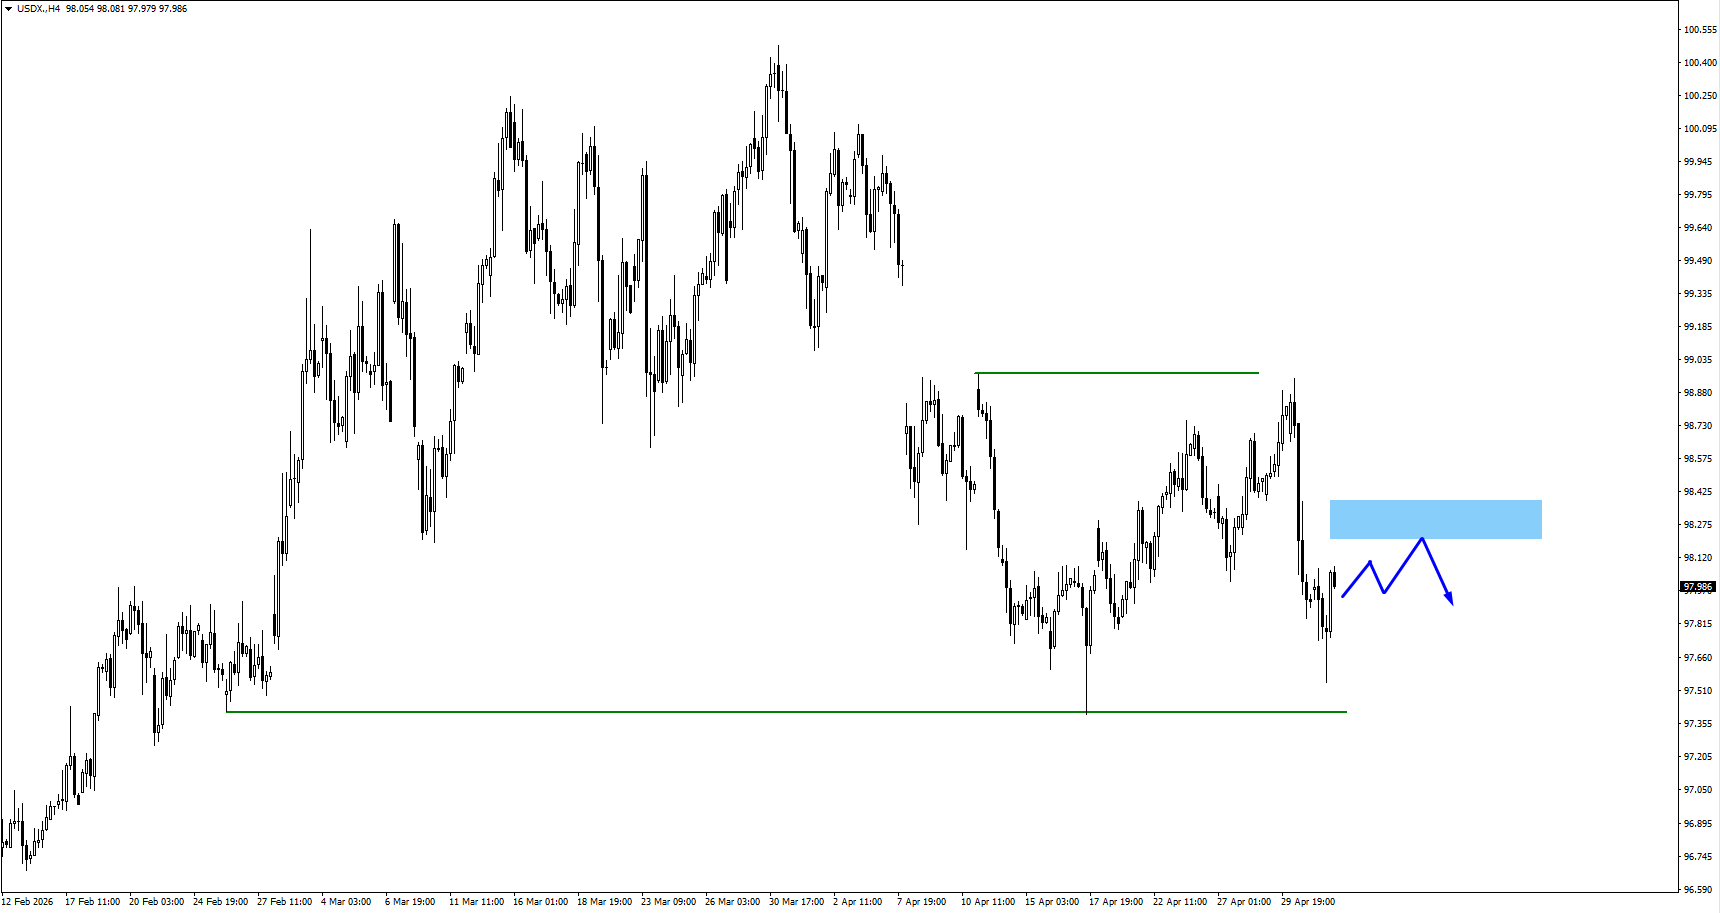
  • USDX remains under pressure after the prior sell-off, but the index may attempt to consolidate higher.
  • The 98.20 area is the key resistance zone to watch for bearish price action.
  • If price later takes out the 97.399 swing low, the dollar may face renewed downside pressure.

USDJPY

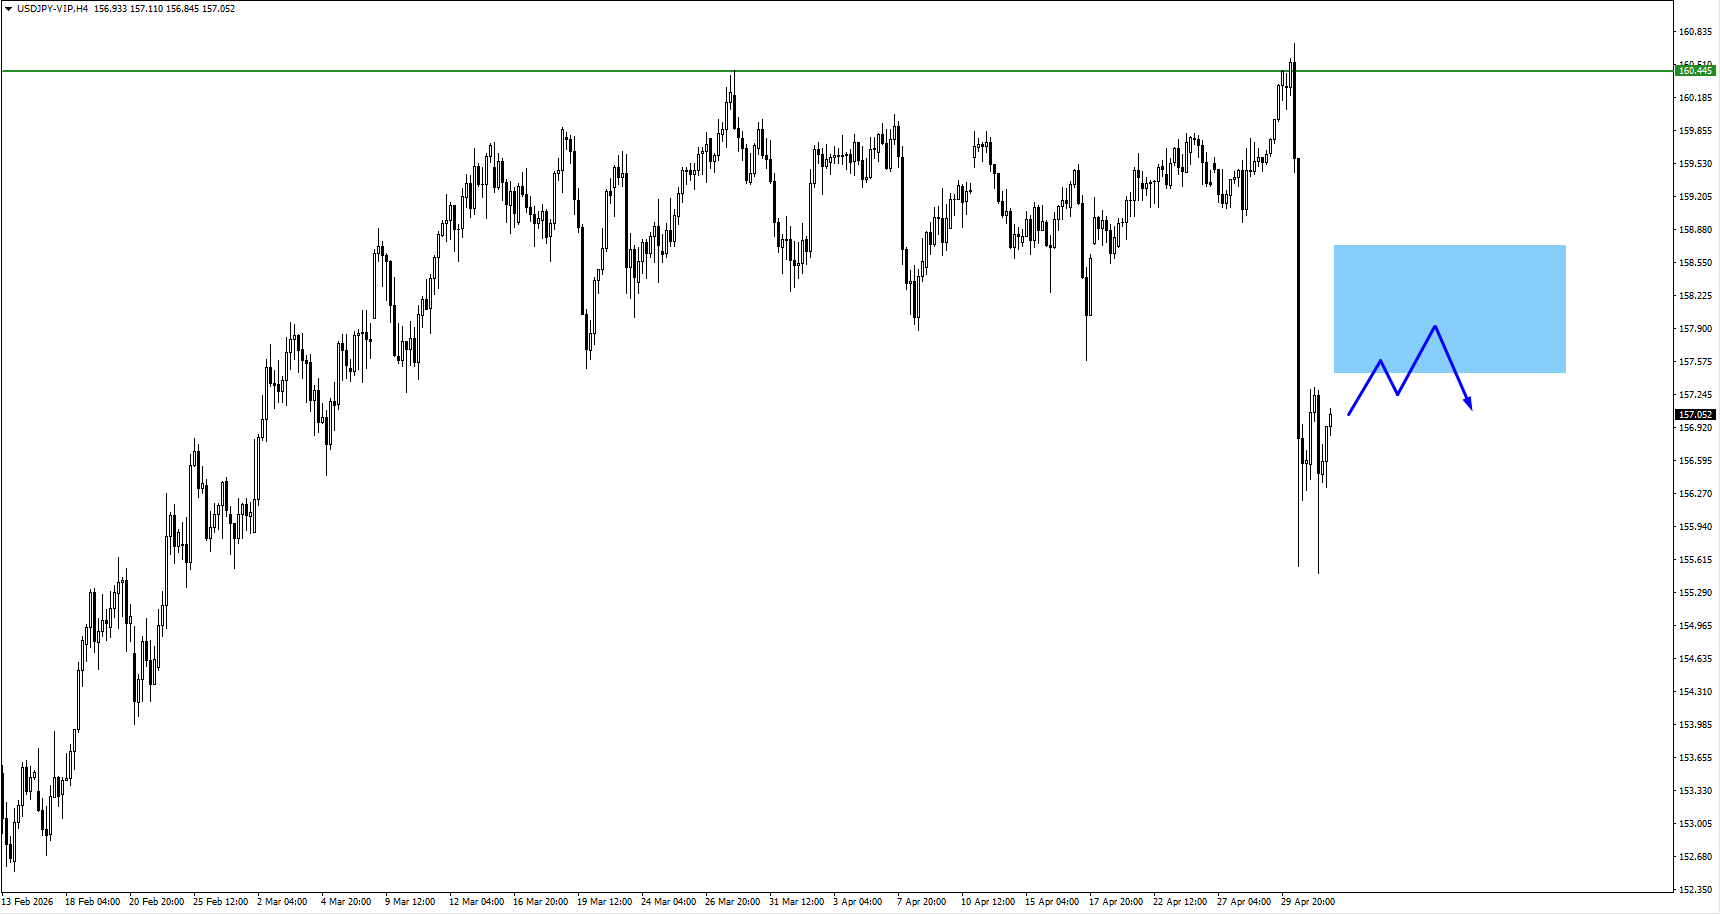
  • USDJPY traded upward from the 158.90 monitored area and broke above 160.45 before pulling back.
  • The pullback puts focus on whether upside retracements attract fresh selling.
  • Bearish price action may be watched at 157.50, 158.10, or 158.70 if price consolidates upward.

USOil

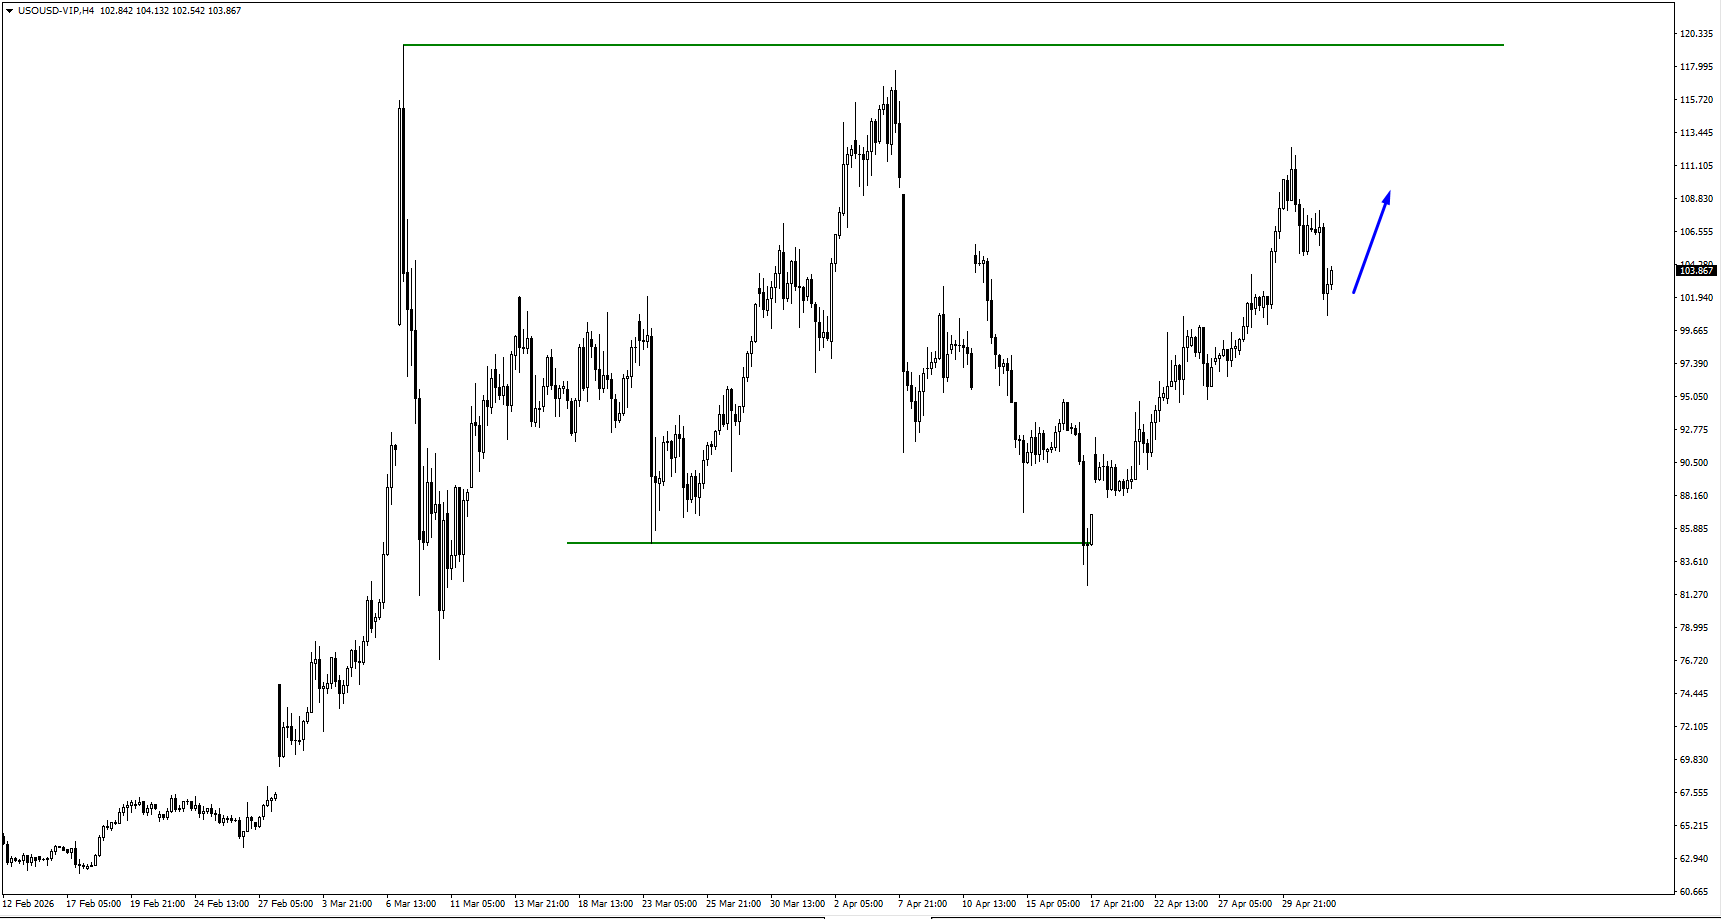
  • USOil continued to rise after breaking above 103.75, then retraced.
  • The broader structure still leaves room for another upside extension if price consolidates cleanly.
  • Oil remains the main macro pressure point because sustained strength can keep inflation and Fed policy risk alive.

Gold

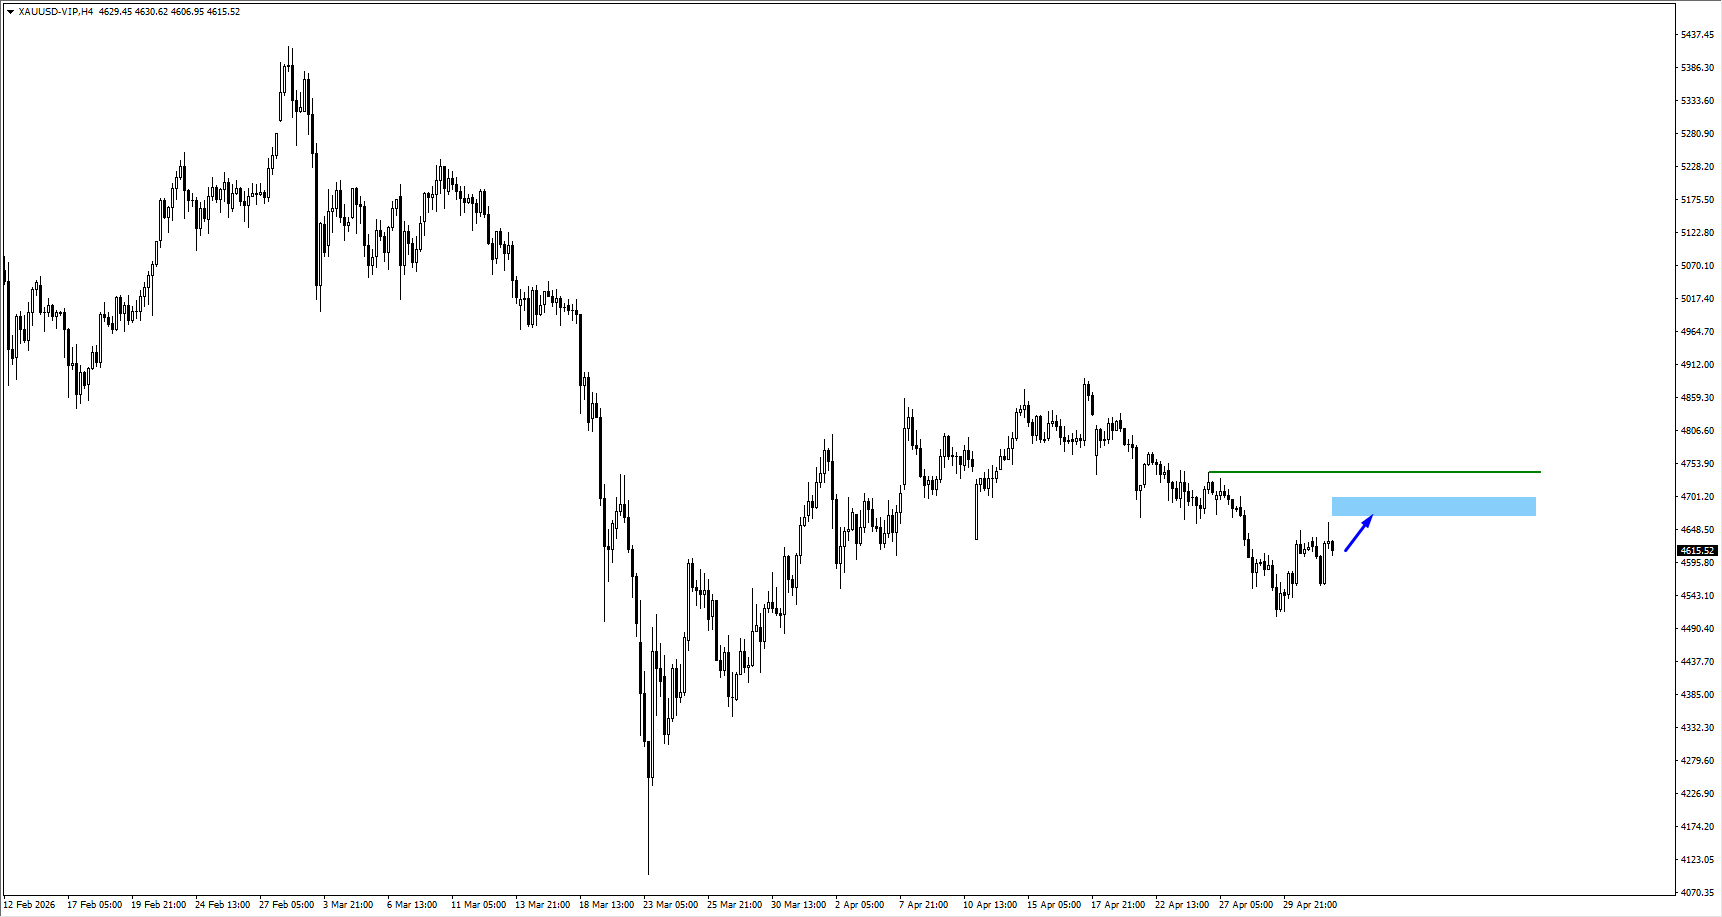
  • Gold broke 4633.39 and traded higher.
  • The move fits the broader macro backdrop of sticky inflation, delayed rate-cut hopes, and geopolitical risk.
  • As price moves higher, 4690 is the next area to monitor for price action.

SP500

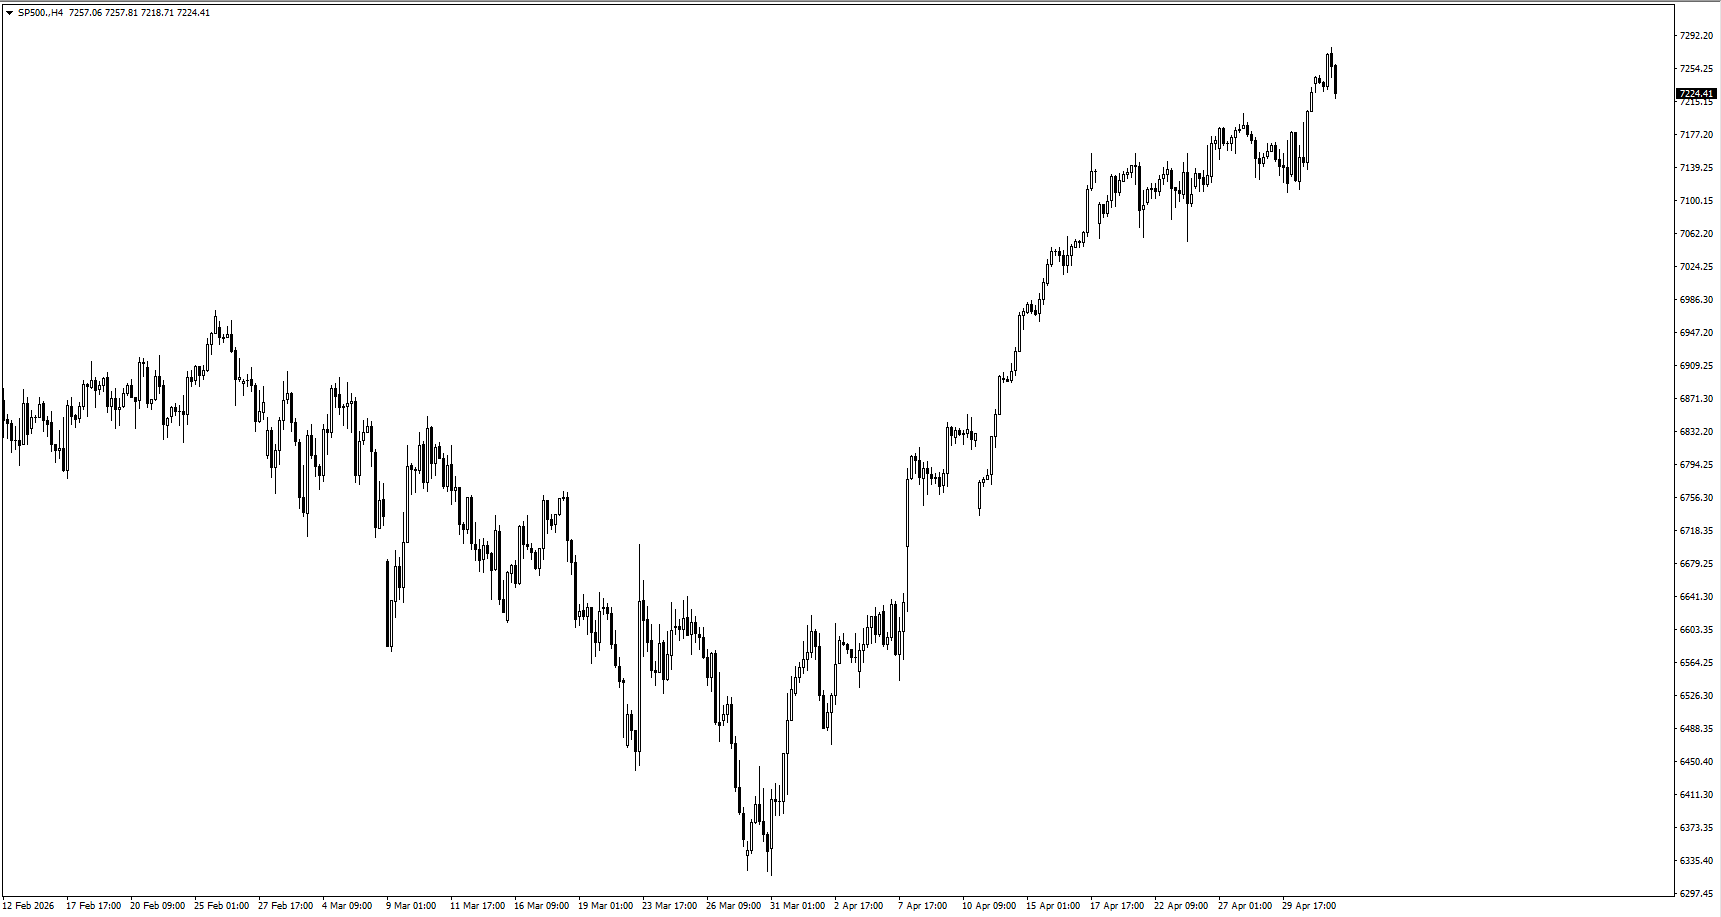
  • SP500 continued to trade higher and remains near all-time highs.
  • Traders should monitor price action closely because stretched rallies can attract profit taking.
  • If the 7110 swing low is taken out, profit taking could be underway.

Bitcoin

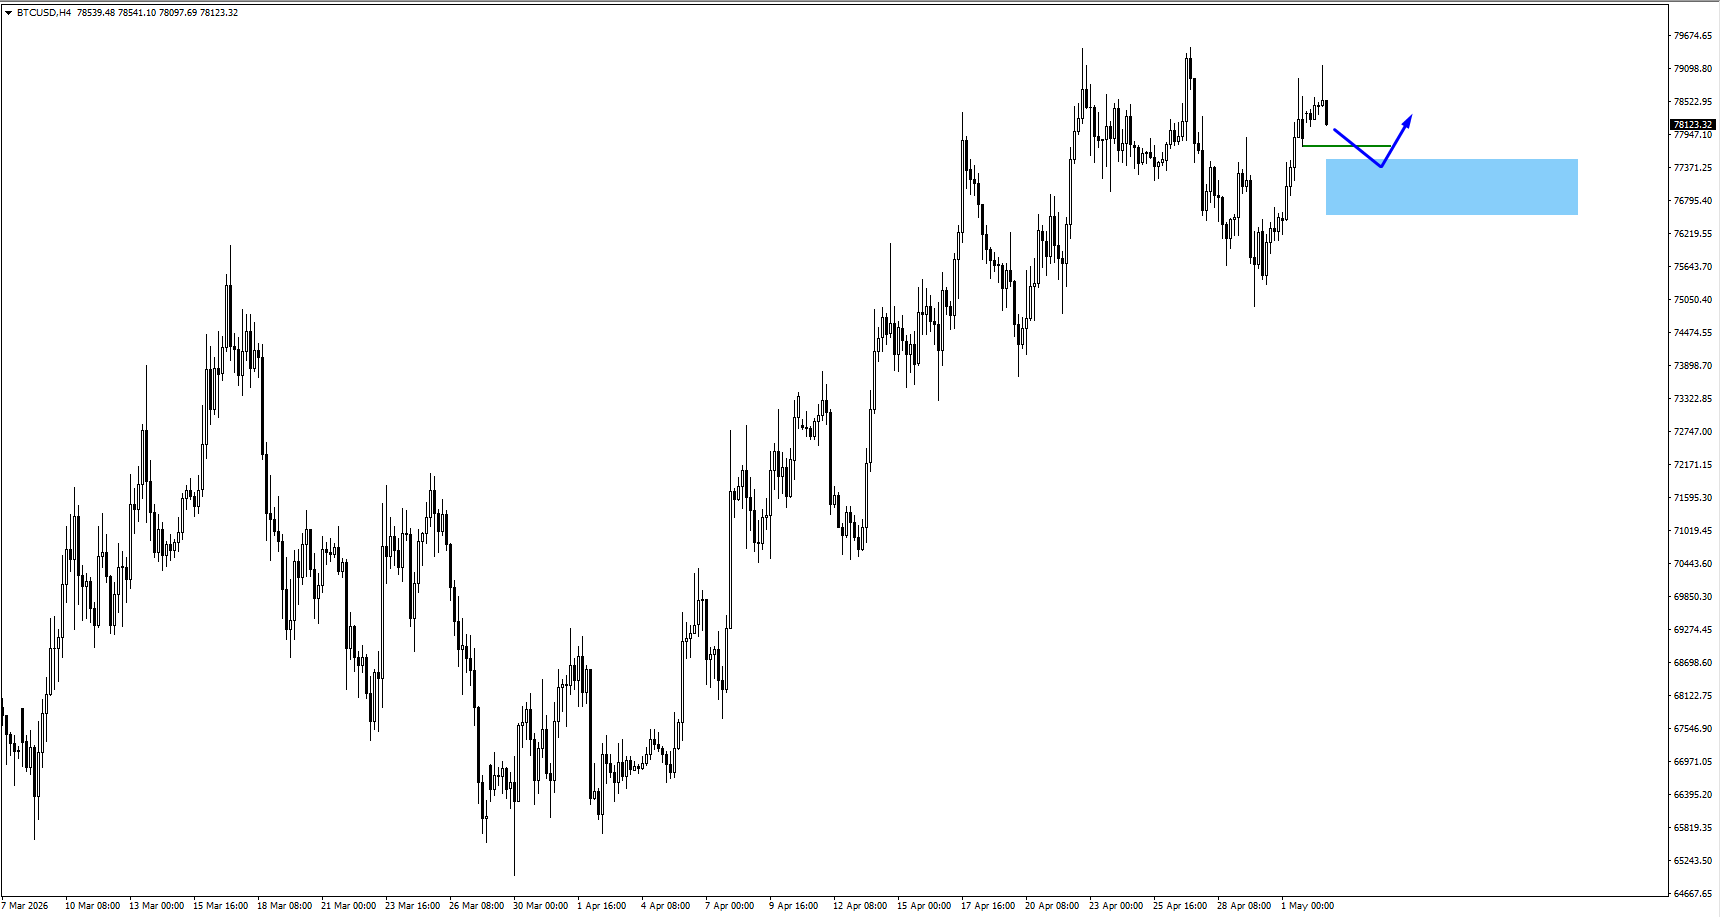
  • Bitcoin traded higher from the 75,600 area.
  • The structure remains constructive if risk appetite holds and the dollar stays capped.
  • If price consolidates next, 77,550, 77,000, and 76,550 are the key zones to watch for bullish price action.

Bottom Line

The week ahead is less about one data print and more about the market regime forming around it. A divided Fed, oil above $100, and resilient growth create a difficult setup for traders. Softer US labour data may help risk assets and gold, but oil must cool before markets can price an easier Fed path with confidence. Until then, rallies in SP500 and BTCUSD may need confirmation, USDX may stay volatile around resistance, and XAUUSD can remain supported if inflation and geopolitical risk stay in focus.

Create a live VT Markets account today to access our platform features, including market insights and educational content.

Trader Questions

Why Is Oil So Important For The Fed This Week?

Oil matters because it can keep inflation pressure alive even when other parts of the economy slow. Higher energy prices feed transport costs, goods prices, inflation expectations, and wages. That makes it harder for the Fed to cut rates quickly.

What Would A Weak NFP Report Mean For Markets?

A weak NFP report could revive rate-cut hopes and pressure the dollar. Gold, SP500, and BTCUSD may benefit if traders see softer jobs growth without a fresh inflation scare. The reaction may fade if wages stay hot or oil keeps rising.

What Would A Strong NFP Report Mean For Markets?

A strong NFP report would support the Fed’s patient stance. It could lift USDX and bond yields while creating short-term pressure on gold, equities, and crypto. The key risk is that strong jobs plus high oil keeps the higher-for-longer story alive.

What Should Traders Watch On USDX?

The key level is 98.20. A bearish reaction there could confirm that dollar rallies are still being sold. A break below 97.399 would add pressure and may support EURUSD, GBPUSD, gold, and other risk-sensitive assets.

Is Gold Still Bullish This Week?

Gold still has support from delayed rate cuts, inflation risk, and geopolitical tension. The next area to watch is 4690. A clean reaction there could decide whether buyers keep control or whether price needs a deeper consolidation first.

Start trading now – Click here to create your real VT Markets account

Singapore’s manufacturing PMI edged up to 50.7 from 50.5 previously, indicating modest sector expansion

Singapore’s Manufacturing Purchasing Managers’ Index (PMI) rose to 50.7 in April. It was 50.5 in the previous month.

A PMI reading above 50 indicates expansion in manufacturing activity. A reading below 50 indicates contraction.

The latest manufacturing PMI data for April shows continued expansion, moving up to 50.7. This marks the ninth consecutive month of growth, suggesting a resilient economic undercurrent. For us, this steady, albeit slow, acceleration signals that the foundation of the Singaporean economy is firming up.

This positive headline figure is strongly supported by the electronics sector, a key driver for Singapore’s economy, which saw its own sub-index rise to 51.2. This aligns with the most recent non-oil domestic exports (NODX) data from March, which showed a year-on-year increase of 3.1%, beating consensus forecasts. The consistent positive data points towards a solidifying recovery in global tech demand.

Looking back, this trend is a welcome change from the more volatile readings we saw in late 2025 when the PMI hovered much closer to the 50-point mark. The sustained growth in early 2026 suggests the manufacturing downturn from that period is now firmly behind us. This gradual improvement builds confidence that the current momentum is sustainable.

For equity derivative traders, this reinforces a bullish bias on the Straits Times Index (STI). We should consider buying STI call options with June and July expiries to capitalize on potential upside as positive economic news gets priced in. Selling out-of-the-money puts on blue-chip manufacturing stocks is also an attractive strategy to collect premium while expressing a positive view.

In the currency market, this data gives the Monetary Authority of Singapore (MAS) more reason to maintain its policy of gradual appreciation for the Singapore Dollar. The economic strength reduces the likelihood of any policy easing, making the SGD attractive. We see an opportunity in selling USD/SGD call options, betting that the pair will remain capped as the Singapore Dollar holds firm.

The firming economic picture also has implications for interest rates, suggesting they will remain stable at current levels for longer than previously anticipated. The prospect of rate cuts is diminishing, which should be factored into pricing for interest rate swaps and futures. We should be cautious about holding positions that rely on a near-term dovish pivot from the central bank.

Geopolitical Leverage: Economy as a weapon

The New Architecture of Power

Power used to be measured in missiles and troop counts.

Today, it’s increasingly measured in pipelines, trade tariffs, and payment systems.

While this shift has been gradual, it is now the foundation of global competition. Over the last two decades, major economies have learned to turn their commercial strengths into political leverage. By controlling trade access, energy supplies, or financial infrastructure, states can now extract concessions and reshape relationships without firing a single shot.


From Military Force to Economic Pressure

The best way to see this shift is to look at the tools leaders look to first.

  • The United States operates at the structural level. By controlling access to the US dollar and the SWIFT payment system, it can effectively decide who gets to participate in global trade.
  • Russia spent decades building energy dependency in Europe, using natural gas exports as a tether.
  • China has secured a near-monopoly on processing rare earth minerals — the essential ingredients for electric vehicles, smartphones, and defense systems.
  • Saudi Arabia and OPEC use oil production levels to do more than just stabilise prices; they use them to signal friendship or displeasure to the West.

The logic across the board is identical: convert a dominant economic position into raw political power.

Key Leverages

1. Energy as a Tether: The “Interdependence” Theory

For decades, the West followed a theory called Change through Trade. The idea was that deep commercial links would make war too expensive for anyone to start. If Germany bought Russian gas and Russia needed German Euros, both were “locked in” to peace. In reality, this created a lopsided vulnerability. While Russia wanted cash, Europe needed the heat. When conflict broke out, Russia used this dependency as a leash, threatening to cut off fuel supplies to paralyze Europe’s political response.

This same logic applies to global “chokepoints” like the Strait of Hormuz. Roughly 20% of the world’s total oil consumption passes through this narrow stretch of water controlled by Iran. Much like Russia’s pipelines, the Strait is a physical valve. Iran has frequently used the threat of closing the Strait to deter sanctions or military pressure from the West. Today, global strategy has flipped: concentrated infrastructure and narrow shipping lanes are no longer seen as bridges to peace, but as “choke points” that a rival can squeeze to force submission.

2. The Resource Monopoly: Understanding “Rare Earths”

“Rare earths” are a group of 17 minerals used in almost everything high-tech, from smartphone screens to electric vehicle motors and missile guidance systems. While these minerals aren’t actually rare in nature, they are incredibly difficult and “dirty” to refine. Over the last few decades, China has positioned itself to handle about 60% of the world’s mining and nearly 90% of the refining for these materials. Read about China’s Export Surplus here.

Because China handles processing plants, they can slow down global tech production simply by tightening export licenses or changing regulations. They don’t need to declare a formal trade war to make an impact; the mere threat of a supply hiccup is enough to make other countries think twice during a diplomatic dispute. It turns a mining industry into a powerful tool for global negotiation.

3. The Financial Thermostat: What is OPEC?

OPEC acts as a global economic “thermostat.” By coordinating how much oil they pump, these nations can swing global prices, which directly impacts inflation and interest rates worldwide. However, this collective power is currently facing its biggest test following the UAE’s historic decision to go it alone.

FeatureThe Old Model (OPEC Unity)The New Reality (UAE Exit)
MembershipA 13-nation cartel led by Saudi Arabia.The UAE officially exited on May 1, 2026.
StrategyMembers follow strict production quotas to keep oil prices high.The UAE is prioritizing its own national revenue over group discipline.
LeverageA unified “shock” to the market can force global political concessions.Influence is now fragmented, making oil markets more volatile and harder to predict.
GoalCollective price stability for the group.Maximising individual production (targeting 5M barrels/day).

The UAE’s departure, the most significant in OPEC’s 65-year history, signals a shift away from central control. As major players prioritize their own investments over old alliances, the “thermostat” becomes much harder for any one group to control.

4. The ‘Chokepoint’: Payment Channels

SWIFT is often described as the “financial nervous system” of the world. It isn’t a bank, and it doesn’t hold money; it is a messaging network that allows 11,000 banks in 200 countries to securely send instructions for cross-border payments. Because it is so dominant and connects nearly every major financial institution, it has become the go-to for global trade.

Bank of Russia: Frozen Reserves. Source: Congress.gov

When a country is disconnected from SWIFT — as happened to several major Russian banks in 2022 — it effectively becomes an island in the global economy. Companies find it nearly impossible to pay for imports or receive money for exports.

The risk of being cut off has triggered a “fragmentation” of the global payments market, where “new forms of money are being developed” to ensure countries have a backup plan.

While these alternatives are growing, the dollar-based SWIFT system remains the central hub, meaning the ability to grant or deny access to this network remains one of the most significant tools of political pressure today.

The Axis is Changing

The global map is reshaping.

The common thread here is dependency. The more you need something, and the fewer alternatives you have, the more leverage the supplier holds.

As a result, we aren’t seeing “deglobalisation,” but rather a “strategic restructuring.”

Countries are no longer building supply chains based purely on the lowest cost. Instead, they are prioritising security:

  • Europe is diversifying its energy sources.
  • The US and Australia are racing to build domestic mineral processing.
  • China is attempting to internationalise the Yuan to bypass the dollar.

These aren’t just business moves; they are insurance premiums against economic coercion. Something that every country is increasingly impacted by in current trade dynamics of the Trump era.


What This Means for the Future

Markets are great at pricing known risks, but they are historically bad at pricing “strategic dependency.” A commercial relationship looks normal until the moment it is weaponized.

For investors and policy leaders, the gap between business and geopolitics has vanished. Exposure to oil prices or semiconductor minerals is no longer just a line item on a balance sheet—it’s a vulnerability.

In this new multipolar world, the most powerful players aren’t necessarily those with the biggest militaries. They are the ones who identified early which economic gears move the world—and put their hands on the lever. Find the most relevant, tradable assets and the latest news on world trade here at VT Markets.

Tap here for Article summary

What is “weaponised interdependence”?
It is a strategy where a state uses its control over a global network (like a payment system or a pipeline) to pressure others. Since modern nations are “locked in” to these networks to function, the party that controls the “tap” can exert political power without military force.

Why are “rare earths” a geopolitical risk?
While the minerals themselves are common, China controls nearly 90% of the refining process. Because they are essential for high-tech goods (EVs, smartphones, missiles), this monopoly allows one country to disrupt global tech supply chains through simple regulatory changes or export limits.

What does the UAE’s exit from OPEC mean for oil prices?
The UAE’s departure on May 1, 2026, signals the decline of centralised oil pricing. By leaving the cartel to maximize its own production (targeting 5M barrels/day), the UAE has prioritized national revenue over group unity, likely leading to a more volatile and competitive global energy market.

Is the world actually deglobalizing?
No, it is “restructuring.” Trade is moving away from the lowest-cost models toward “security-first” models. Countries are now willing to pay more to build redundant supply chains and domestic industries as an insurance premium against being coerced by rivals.

How does being cut off from SWIFT affect a country?
It acts as a financial “kill-switch.” Disconnected banks lose the ability to send secure payment instructions across borders, making it almost impossible to pay for imports or receive money for exports. This effectively exiles a nation from the global financial system.

Create a live VT Markets account today to access our platform features, including market insights and educational content!

Start trading now – Click here to create your real VT Markets account

AUD/USD stays positive near 0.7200, edging up slightly, set for weekly gain, bearish cap persists

AUD/USD traded near the top of a 0.7100–0.7200 consolidation band, hovering around 0.7200. Late in the North American session it was up 0.10%, and it was set to end the week 0.84% higher.

A bullish engulfing pattern was cited as limiting moves lower, while the Relative Strength Index remained above 50. That setup points to upward momentum within the current 100‑pip range.

Key Technical Levels

Resistance is seen at 0.7250, then 0.7282 (June 3, 2022 high) and 0.7300. A further level referenced is 0.7661 (April 5, 2022).

If the pair closes below 0.7200, support levels include the 20‑day SMA at 0.7121, then 0.7100 and the 50‑day SMA at 0.7059. These levels outline potential downside tests within the range.

The Australian Dollar is influenced by Reserve Bank of Australia policy, commodity prices and China’s economic conditions. The RBA targets inflation of 2–3% and can also use quantitative easing or tightening to affect credit conditions.

Iron ore is Australia’s largest export, totalling $118 billion a year based on 2021 data. Trade balance outcomes can also affect the currency.

Market Context In 2025

We can see how, when looking at the situation from the perspective of 2025, the bullish sentiment for the AUD/USD hovering around 0.7200 was based on strong technical signals like the RSI. That consolidation period represented a different market environment compared to where we stand today. The fundamental drivers, especially interest rate differentials, have since shifted the entire landscape.

The Reserve Bank of Australia has held its cash rate at 4.35% for several months now into mid-2026, trying to bring stubborn inflation back to its 2-3% target. However, with the U.S. Federal Reserve rate holding higher, the interest rate differential continues to favor the US dollar. This fundamental pressure is a key reason the pair now trades closer to 0.6650, far below the levels seen in that earlier analysis.

The commodity story, which was a tailwind back then, is now offering less support. Iron ore prices are currently hovering around $115 per tonne, a significant step down from the volatile but often higher prices we saw through much of 2022 and 2023. At the same time, recent manufacturing PMI data out of China has been mixed, creating uncertainty about demand from Australia’s largest trading partner.

This shift suggests that upside potential for the Aussie is capped for now. Derivative traders should note that implied volatility has been moderate, suggesting the market is not expecting explosive moves but is wary of downside risks. The old 0.7100-0.7200 range is now a distant memory, replaced by a new battleground between roughly 0.6600 and 0.6700.

Given the fundamental headwinds, traders might consider buying put options with a strike below the 0.6600 support level to position for a potential break lower, driven by any surprisingly weak Australian data or hawkish Fed commentary. For those who believe the downside is limited, selling out-of-the-money call options, perhaps with a 0.6800 strike, could be a strategy to collect premium while acknowledging the strong resistance overhead. This approach defines risk while capitalizing on the currently restrained upside.

Looking ahead, the next RBA meeting and upcoming U.S. inflation figures will be critical catalysts. Any sign that the RBA is becoming more concerned about growth than inflation could accelerate downside momentum. Traders should therefore watch these events closely to adjust their positions or identify fresh opportunities in the options market.

Create your live VT Markets account and start trading now.

Japan’s CFTC JPY non-commercial net positions fell to -102.1K yen, from -94.5K previously

Japan’s CFTC data shows non-commercial net positions in the Japanese yen fell to ¥-102.1K. This compares with the previous level of ¥-94.5K.

This indicates a larger net short position than before. The change is ¥-7.6K from the prior reading.

The net short position against the Japanese Yen has deepened significantly, reaching -102.1K contracts. This shows us that speculative traders are increasing their bets that the Yen will continue to fall in value. This is the most bearish positioning we have seen in several months and reinforces the ongoing downtrend.

This sentiment is anchored by the wide interest rate differential between the Bank of Japan and other central banks, particularly the U.S. Federal Reserve. Recent data from April 2026 showed U.S. core inflation remaining persistent around 2.9%, making near-term Fed rate cuts unlikely. This fundamental mismatch continues to fuel the carry trade, where traders borrow Yen to invest in higher-yielding currencies like the dollar.

For traders aligned with this trend, the data supports adding to short Yen positions through futures or buying call options on the USD/JPY pair. The path of least resistance appears higher for USD/JPY, especially as it tests levels above the 165 mark. The market momentum is clearly positioned for further Yen weakness in the coming weeks.

However, such a crowded trade presents a significant risk of a sharp reversal, much like the volatile swings we observed in late 2025. A surprise intervention by Japanese authorities or a sudden downturn in U.S. economic data could trigger a violent short squeeze. The extreme level of negative sentiment itself is a contrarian warning sign.

Therefore, a cautious strategy involves hedging these short positions. We should consider buying cheap, out-of-the-money put options on USD/JPY as a form of insurance. This provides a safety net against sudden policy shifts from Tokyo, a risk that has grown substantially since the confirmed interventions back in the spring and summer of 2024.

US CFTC data showed gold non-commercial net positions falling from 164K to 159.6K

US CFTC data shows net positions in gold for non-commercial traders fell from 164,000 to 159,600.

The change points to a drop of 4,400 contracts from the prior reading.

Speculative Positioning Shifts

We are seeing large speculators slightly reduce their bullish bets on gold, with net long positions dipping to $159.6K. This indicates some profit-taking or a small increase in caution after a period of strong buying. While not a major reversal, it is a signal that conviction may be starting to wane at current price levels.

This shift in positioning aligns with recent economic data, as the April 2026 jobs report came in stronger than expected, showing 285,000 new jobs against a forecast of 190,000. These numbers, combined with recent hawkish tones from the Federal Reserve, are pushing back expectations for a summer interest rate cut. A strong dollar, which just hit a three-month high around 106.50 on the DXY, adds further pressure on gold prices.

For derivative traders, this suggests a more defensive posture in the coming weeks. The failure of gold to convincingly hold above the $2,450 per ounce level last month makes the current price action look like a potential short-term top. We saw a similar pattern in the fall of 2025 when strong economic data caused a sharp, temporary pullback before the uptrend resumed.

Considering this, buying put options to hedge existing long positions appears to be a prudent strategy. It provides downside protection if gold tests lower support levels, possibly near the $2,300 mark, without requiring a full exit from the market. Bear put spreads could also be used to cheapen this hedge, defining the risk while targeting a moderate downturn.

Options Volatility Strategies

The uncertainty around the Fed’s next move may also increase implied volatility in the options market. Traders could look at strategies like long straddles or strangles if they expect a significant price move but are unsure of the direction. This would capitalize on a breakout from the current range, which often follows a period of consolidation and indecision.

Create your live VT Markets account and start trading now.

UK CFTC reports GBP non-commercial net positions fell from -£52K to -£60.6K, reflecting increased shorts

UK CFTC data showed GBP non-commercial net positions fell to £-60.6K from £-52K.

This indicates a larger net short position in sterling in the latest reporting period.

We are seeing speculative sentiment turn increasingly bearish on the British Pound. The net short position held by non-commercial traders has deepened to -£60.6k, indicating that more traders are betting on a fall in its value. This is a significant shift that warrants attention.

This negative positioning is likely driven by recent economic data showing UK inflation unexpectedly ticking up to 3.5% in April, while first-quarter GDP growth remained stagnant at just 0.2%. This combination of stubborn price pressures and a weak economy is putting the Bank of England in a difficult position. The market is now pricing in a lower probability of interest rate cuts this summer, which is weighing on growth prospects.

Looking back, we saw a similar dynamic unfold in mid-2025 when concerns about the UK’s twin deficits resurfaced alongside sticky services inflation. That period saw the pound weaken considerably against the dollar as capital sought safer havens. History suggests that when speculative shorts build to these levels, the currency can be vulnerable to a sharp move lower.

For derivative traders, this environment suggests considering strategies that profit from a decline in the pound. Buying put options on the GBP/USD pair, or establishing bear put spreads to limit cost and define risk, could be effective ways to position for potential downside. These instruments allow traders to capitalize on falling prices while controlling their maximum potential loss.

We should be watching key technical levels, particularly the 1.2350 support for GBP/USD, as a break below could trigger further selling. Upcoming UK employment and retail sales figures will be critical catalysts in the coming weeks. Any signs of further economic weakness could easily accelerate the pound’s decline.

US CFTC oil non-commercial net positions slipped to 191.9K, down from the prior 192.3K

US CFTC data shows oil NC net positions fell to 191.9K. The prior reading was 192.3K.

The slight dip in speculative net long positions shows that big money is hesitant to add to bullish bets right now. This is not a major rush for the exits but a sign of caution setting in. We are seeing a market that seems well-balanced, waiting for a new reason to move decisively in either direction.

Conflicting Macro Signals

This indecision makes sense given the conflicting economic signals we’ve received recently. April’s CPI print came in slightly hot at 3.1%, keeping the Federal Reserve on alert and tempering expectations for a quick boost in demand. However, the latest jobs report showed unexpected strength, which suggests the consumer isn’t collapsing just yet.

On the supply side, the market is also in a holding pattern ahead of the June OPEC+ meeting. The latest EIA report showed a surprise inventory build of 1.2 million barrels, which capped the upside for crude prices this week. Traders are now questioning if the voluntary production cuts, some of which were established back in 2025, will be extended.

We should remember the lessons learned from previous years, and looking at the sharp rallies from the perspective of 2025, it’s clear that getting caught short is dangerous. That experience is likely creating a floor under the market, preventing a larger sell-off despite some weaker data. This setup suggests that selling premium through strategies like covered calls or short strangles on WTI could be effective.

WTI crude seems comfortable in a range between roughly $82 and $88 a barrel for now. Implied volatility has been steadily decreasing, now sitting near 28%, making it less appealing to be a simple buyer of options. The current environment rewards traders who can collect theta decay while waiting for the market to choose a direction.

Rangebound Price Action

Create your live VT Markets account and start trading now.

US CFTC data shows S&P 500 non-commercial net positions rose to -101.4K from -110.1K

US CFTC data showed S&P 500 NC net positions rose to $-101.4K from $-110.1K.

The net position remained negative, meaning the total still reflected a net short stance.

The net short position on S&P 500 futures has decreased, moving from -110.1K to -101.4K contracts. This shows that large speculators, like hedge funds, are becoming less bearish on the stock market. While the overall sentiment is still negative, the pressure is easing as some of those short bets are being closed out.

This shift in positioning follows the April 2026 jobs report, which showed payrolls increasing by a moderate 195,000, calming fears of an overheating economy. Paired with the latest CPI inflation data holding steady at 3.4%, it gives the Federal Reserve room to pause its rate-hiking cycle. This economic stability is likely what’s causing the most pessimistic traders to reconsider their positions.

We saw a similar dynamic back in late 2025, when extremely high short interest preceded a sharp market rally as traders were forced to buy back their positions. That environment of “forced buying” can create powerful upward momentum in a short period. The current reduction in short positions suggests the beginning of a similar unwinding, which could push the market higher in the near term.

For the coming weeks, we believe traders should consider buying near-term call options or bullish call spreads on the S&P 500. This strategy allows for participation in a potential relief rally driven by continued short-covering. The goal is to capitalize on this shift in sentiment before it becomes the consensus view.

Alternatively, for a more conservative approach, selling out-of-the-money put spreads is an attractive option. This strategy profits from the market moving up, sideways, or even slightly down, reflecting the view that the intense selling pressure has likely subsided for now. With the VIX having recently dropped from 24 to below 20, it signals that market fear is diminishing, supporting this type of income-generating trade.

Australian CFTC data shows AUD non-commercial net positions rising from 64.8K to 71.9K

Australia’s CFTC AUD non-commercial net positions rose to 71.9k from 64.8k.

This shows an increase of 7.1k compared with the previous reading.

Rising Speculative Longs Support Aussie Outlook

Speculative net long positions in the Australian dollar have climbed again, showing that large traders are increasing their bets that the currency will rise. This build-up from $64.8K to $71.9K contracts points to a strengthening conviction in the market. We should view this as a significant tailwind for the AUD/USD pair in the near term.

The Reserve Bank of Australia’s recent hawkish stance is a key driver, especially with Australian Q1 inflation coming in hotter than expected at 3.8%. This contrasts with signals from the U.S. Federal Reserve that they may be nearing the end of their tightening cycle. The widening interest rate differential makes holding the Aussie dollar more attractive.

We are also seeing strength in key commodity markets, which directly supports Australia’s terms of trade. Iron ore prices, for instance, have recovered and are holding firm above $115 per tonne, a significant improvement from the lows we saw last year. This fundamental support for the Australian economy is likely what’s giving speculators confidence.

This bullish positioning is a stark contrast to the sentiment we saw in the latter half of 2025. We recall how concerns over a slowdown in China pushed the AUD/USD pair to significant lows back then. The current momentum suggests the market has moved past those fears for now.

For traders, this suggests that buying on dips remains a viable strategy, potentially using call options to manage risk while capturing upside. However, we must be cautious as the long-AUD trade becomes more crowded. A crowded position can unwind quickly on any unexpected negative news.

Key Risks To Monitor Going Forward

Keep a close eye on incoming U.S. economic data, particularly employment and inflation reports. Any signs of unexpected U.S. economic strength could revive the dollar and create a sharp reversal in the AUD/USD pair. This remains the primary risk to the current bullish thesis.

Create your live VT Markets account and start trading now.

Back To Top
server

Hello there 👋

How can I help you?

Chat with our team instantly

Live Chat

Start a live conversation through...

  • Telegram
    hold On hold
  • Coming Soon...

Hello there 👋

How can I help you?

telegram

Scan the QR code with your smartphone to start a chat with us, or click here.

Don’t have the Telegram App or Desktop installed? Use Web Telegram instead.

QR code