

Key Points
- SP500 trades at 6690.15, up +6.53 (+0.10%), but price remains below MA10 6783.72, MA20 6832.41, and MA30 6856.65.
- Traders are no longer fully pricing even one Fed rate cut this year, versus two rate cuts at the end of February.
- Brent surged more than 10% at one point to $101.59 per barrel, while the dollar has gained over 2% against six major rivals since the war began.
The S&P 500 is trying to stabilise, but the macro backdrop has turned more hostile. Markets are now adjusting to the prospect of a longer Middle East war, oil prices staying near the $100 per barrel area, and a more stubborn inflation outlook.
That mix has pushed traders toward a stagflation framework, where growth slows while price pressure stays high. Reuters reported that Wall Street fell sharply on Thursday as crude surged and traders reassessed the path for rates and growth.
That is a difficult setting for equities. Higher oil acts like a tax on consumers and businesses. It squeezes margins, weakens confidence, and pushes bond yields higher at the same time. If the shock lasts, traders may continue trimming exposure to broad equity indices rather than rushing back into dip-buying.
If oil holds near $100 and yields stay firm, the S&P 500 may struggle to build a lasting rebound and could remain vulnerable to rallies that fade.
Rate-Cut Hopes Have Reversed Fast
The biggest shift sits in rates. Traders are no longer fully pricing even one rate cut from the Federal Reserve this year, compared with pricing two rate cuts at the end of February. That is a major reset in a short period.
Fed funds futures have pushed easing expectations further out, with traders increasingly questioning whether the Fed can cut while energy-driven inflation risk remains elevated.
The pressure is not limited to the US. For the European Central Bank, money markets have fully priced a rate hike by July and a 70% chance of a second increase by December, compared with a roughly 40% chance to a rate cut before year-end in February.
Euro area Bund yields have risen to their highest level in almost 2-1/2 years, while the US two-year Treasury yield hit a six-month high.
For equities, this matters because it changes valuation support. If traders stop expecting cuts, the market loses one of its main cushions.
If central banks keep sounding wary on inflation next week, the S&P 500 may remain under pressure, especially in rate-sensitive sectors.
The Oil Shock Still Drives the Tape
Oil remains the central driver. Brent rose more than 10% at one point to $101.59 per barrel, and Reuters reported it was later up 7.9% at $99.21 in Asia trade even after the IEA agreed to release a record 400 million barrels from strategic stockpiles. The market response stayed muted because traders still doubt policy measures can fully offset the supply disruption.
Oil volatility also remains extreme. Reuters reported the Cboe oil volatility index, OVX, surged to 121.01, its highest level since the early stage of the COVID shock in 2020. That tells you traders still see wide daily ranges and poor visibility.
Even the better news has only softened the damage, not removed it. The US issued a 30-day waiver for countries to buy sanctioned Russian oil and petroleum products stranded at sea, but the reaction stayed limited because the broader bottleneck in Middle East energy flows has not been solved.
If oil volatility stays elevated and Hormuz traffic remains impaired, equities may keep trading with a heavy tone and higher downside sensitivity to headlines.
Dollar Strength Adds Another Headwind
The only clear safe haven through this stretch has been the US dollar. The dollar index has gained over 2% against six major rivals since the war began, according to Reuters. That matters for US equities because a stronger dollar can tighten financial conditions and pressure multinational earnings.
A firmer dollar also reflects global stress. Traders are buying dollars because they want liquidity and protection from the inflation shock. That tends to happen when risk appetite weakens across both bonds and stocks.
If the dollar keeps climbing, it may add another layer of pressure to the S&P 500, especially for globally exposed sectors such as tech and industrials.
Technical Analysis
The S&P 500 is trading near 6,690, edging up 0.10% on the session as the index attempts to stabilise after the recent decline from the 7,017 peak. The broader structure suggests the market has shifted from its earlier upward momentum into a short-term corrective phase, with price now testing lower support levels.
Technically, the index remains below several key short-term moving averages. The 5-day moving average (6,745) and 10-day (6,783) are positioned above the current price and trending lower, indicating continued pressure on the upside.
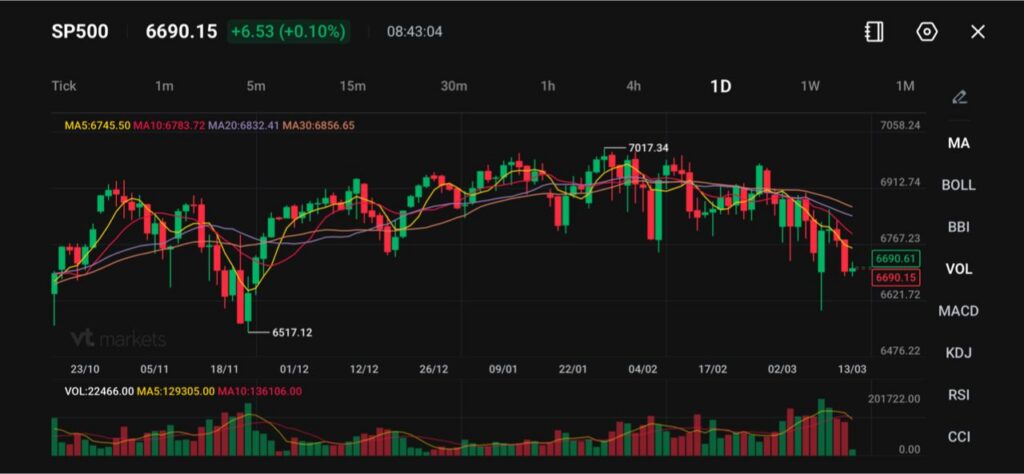
The 20-day moving average (6,832) and 30-day (6,856) also sit above the market, reinforcing the near-term bearish bias as the index trades beneath this cluster of resistance.
Immediate support is located around 6,650–6,670, an area that recently attracted buyers after the sharp drop. A break below this zone could expose further downside toward 6,550–6,600, where previous demand emerged earlier in the trend.
On the upside, initial resistance now sits around 6,740–6,780, followed by stronger resistance near 6,830, where the 20-day moving average is currently positioned.
Overall, the S&P 500 appears to be undergoing a short-term consolidation after failing to hold above 7,000. Unless the index can reclaim the 6,780–6,830 region, the near-term outlook may remain cautious, with the market vulnerable to additional downside pressure before a clearer directional move emerges.
What Traders Should Watch Next
Next week’s run of central bank meetings matters because policymakers now need to address inflation, rates, and slower growth at the same time. These meetings are a prime market focus, as the interest-rate outlook has been reshaped by the war and energy shock.
In the very near term, traders should watch three things: whether oil can stay below the recent panic highs, whether yields keep rising, and whether the S&P 500 can recover the first resistance band near 6745.50 and 6783.72. If those do not improve together, this bounce may stay shallow.
Learn more about trading Indices on VT Markets today.
FAQs
- Why Are Stagflation Risks Being Discussed in Markets Again?
Stagflation refers to a mix of slow economic growth and high inflation. Markets are raising this risk because oil prices surged above $100 per barrel, which can raise energy costs while also weakening global growth. - How Do High Oil Prices Affect Stock Markets?
Higher oil prices increase production and transport costs for companies while also reducing consumer spending power. This combination can squeeze corporate profits and weigh on equity markets such as the S&P 500. - Why Are Investors Pulling Back Rate-Cut Expectations?
Rising energy prices increase inflation risks, making central banks more cautious about cutting interest rates. Markets are now no longer fully pricing even one Fed rate cut this year, compared with two rate cuts priced at the end of February. - Why Are ECB Rate Expectations Moving Higher?
Money markets now fully price a European Central Bank rate hike by July and a 70% probability of a second hike by December. In February, traders had attached roughly a 40% chance to a rate cut before year-end, showing how sharply expectations have shifted. - How Does a Stronger Dollar Affect the S&P 500?
A stronger dollar can weigh on US equities because it tightens financial conditions and reduces overseas earnings for multinational companies when profits are converted back into dollars. - Did the Strategic Oil Reserve Release Calm Markets?
The International Energy Agency agreed to release 400 million barrels from strategic reserves. While this helped stabilise prices slightly, markets remain cautious because supply disruptions linked to the Middle East conflict have not fully resolved.
Start trading now – Click here to create your real VT Markets account


