


Key Points
- Brent cleared $100 at the open, hit $119.50, and sits up 25% on the day, taking gains since Trump ordered the attack on Iran to 60%.
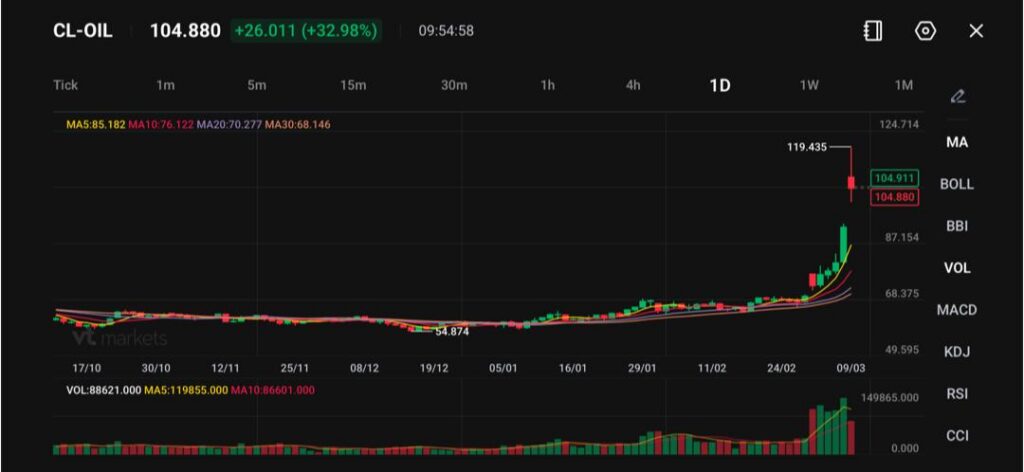
- US crude shows the same shock on the chart at 104.880, up +26.011 (+32.98%), with MA5 85.182, MA10 76.122, MA20 70.277, MA30 68.146.
- Risk assets fall hard: the Nikkei is off around 7%, South Korea 8%, Taiwan 5%, while European share futures drop 1% to 3% and Wall Street futures around 2%.
Oil has stopped behaving like a normal macro input and started behaving like a constraint. Brent cleared $100 at the open and did not look back. It hit a top of $119.50 so far and trades up 25%, which would rank as the biggest daily rise on record if it holds. It also lifts Brent’s gains since President Trump ordered the attack on Iran to 60%.
Those are recession-style numbers because energy acts like a tax. It lifts costs for transport, power, and food. It also hits confidence fast. The world uses less oil per unit of output than it did in the 1970s, but the market still struggles to replace lost barrels quickly when a chokepoint shuts. Traders now price duration risk. They do not price a one-day disruption.
If crude holds anywhere near a 25% daily gain, risk assets may stay under pressure as investors hedge a higher inflation path and weaker growth. If Brent slips back below $100 quickly, markets may still keep a risk premium in place until shipping flows resume at a sizeable level.
The Strait of Hormuz Turns a Price Spike Into a Supply Event
The key driver sits in shipping, not production geology. Tankers are not braving the Strait of Hormuz. Traders also doubt insurers will cover routes at a price that makes commercial sense while the conflict stays hot. Data showed traffic collapsing, supporting the idea that flows have stalled rather than slowed.
When crude cannot move, storage fills. Some Gulf states then have to scale back production because they cannot load cargoes. That matters because shutting wells and restarting them often takes time and care, even when the fields themselves remain intact.
If tanker flow stays near zero for another few sessions, oil may remain disorderly and spreads may stay wide. If navies reopen a safe corridor and insurers return, crude could fall sharply, but the market may still price higher volatility until it sees steady transit rates.
Fuel Markets Show the Pain First
Refined products often lead to crude during real disruptions. Europe’s jet fuel market gives a clean signal. Around half of Europe’s jet fuel comes through the strait, and prices have hit record highs equivalent to about $190 per barrel.
That sort of move hits airlines, freight, and tourism in days, not months. It also bleeds into inflation prints through transport costs. When airlines reprice tickets, households feel it quickly. When logistics reprice freight, companies pass it through into goods.
If jet fuel holds near the $190 per barrel equivalent area, airlines and travel names may keep sliding, and Europe may import inflation even if demand cools.
Technical Analysis
WTI crude oil (CL-OIL) has surged dramatically, trading near $104.88, marking an extraordinary +32.98% jump on the session. The explosive rally follows a powerful breakout from the mid-$80 range, sending prices to a recent high near $119.43 before a modest pullback.
The move represents one of the strongest single-session advances in recent history and reflects intense bullish momentum across energy markets.
Technically, price has accelerated far above its moving averages, confirming the strength of the breakout. The 5-day moving average (85.18) and 10-day (76.12) have turned sharply upward, while the 20-day (70.27) and 30-day (68.15) remain significantly below current levels.
This extreme separation between price and the moving averages highlights the magnitude of the rally and indicates that the market is currently trading in a high-volatility expansion phase.
In the near term, $119.40 represents immediate resistance after acting as the intraday peak during the rally. A sustained break above this level could open the door toward the $120–$125 range.
On the downside, the first meaningful support now sits around $95–$100, which aligns with the recent breakout area. Stronger structural support is located near $87, where the previous consolidation occurred before the sharp upward move.
Overall, the broader trend has shifted decisively bullish, but the steepness of the advance suggests the market may experience short-term volatility or consolidation as traders digest the rapid gains. Even so, as long as prices remain above the $95–$100 region, the bullish structure remains firmly intact.
What Traders Should Watch Next
- Brent’s ability to hold $100 and the day’s gain near 25%, because that sets the tone for risk appetite and inflation hedging.
- Any sign that tankers resume crossings, because the strait drives the physical squeeze and the fear premium.
- Equity futures reaction to the current drawdown levels: Nikkei -7%, South Korea -8%, Taiwan -5%, Europe -1% to -3%, Wall Street -2%.
- US petrol sensitivity if pump prices jump 10%, 20% or more, because domestic politics can change war duration risk faster than markets expect.
Learn more about trading Energies on VT Markets here.
FAQs
- What Makes This Move in Oil Different From a Normal Rally?
The market is pricing a supply shock, not stronger demand. Brent cleared $100 at the open, hit $119.50, and sits up 25% on the day. It also puts Brent up 60% since Trump ordered the attack on Iran. Moves of 25% in a day usually come from disrupted flows and forced repricing, not gradual macro trends. - Why Does the Strait of Hormuz Matter So Much for Prices?
The Strait acts like a valve for global energy flows. When tankers stop moving, physical crude cannot reach buyers. Even if producers still pump, storage fills, and exports stall. That is how a political event becomes a pricing event fast. - How Does a Shutdown Turn Into a Longer Problem for Producers?
If crude cannot leave the Gulf, some states must cut output because they run out of storage. Restarting scaled-back production can take time and careful steps, which can keep supply tight even after the immediate danger eases. - Why Are Jet Fuel Prices a Key Signal in This Shock?
Refined products often show stress first. Around half of Europe’s jet fuel comes through the strait, and jet fuel has hit record highs equivalent to about $190 per barrel. When jet fuel spikes, airlines, freight, and travel costs usually reprice quickly, which can spill into inflation. - What Do the Equity Index Falls Tell Us About Market Positioning?
They show fast de-risking across regions. The Nikkei is off by around 7%, South Korea by 8%, and Taiwan by 5%. European share futures are down 1% to 3%, and Wall Street futures are around 2%. Moves of that size often reflect systematic selling, hedging, and tighter financial conditions rather than single-sector weakness.
Start trading now – Click here to create your real VT Markets account


